Autonomous Routing Algorithms for Networks
with Wide-Spread Failures: A Case for Differential
Backlog Routing
MASSAC-,-!
S INSTITUTEby
NOV 13 2008
Wajahat Faheem Khan
LI BRARIES
B.S. in Electrical Science and Engineering
B.S in Mathematics with Computer Science
Massachusetts Institute of Technology, 2007
Submitted to the Department of Electrical Engineering and Computer
Science in partial fulfillment of the requirements for the degree of
Master of Engineering in Electrical Engineering and Computer Science
at the
MASSACHUSETTS INSTITUTE OF TECHNOLOGY
August 2008
@
2008 Wajahat Faheem Khan. All rights reserved.
The author hereby grants to MIT permission to reproduce and to
distribute publicly paper and electronic copies of this thesis document
in whole or in part in any medium now known or hereafter created.
Signature of Author:
Department of Electrical Engineering and Computer Science
August 7, 2008
Certified by:
,
Eytan H. Modiano
As
iate
ofessor of A~erautics and Astronautics
7 /Supervisor
Accepted by:
vs
Arthur C. Smith
Chairman, Department Committee on Graduate Theses
Autonomous Routing Algorithms for Networks with
Wide-Spread Failures: A Case for Differential Backlog
Routing
by
Wajahat Faheem Khan
Submitted to the Department of Electrical Engineering and Computer Science on August 29, 2008, in partial fulfillment of the
requirements for the degree of
Master of Engineering in Electrical Engineering and Computer Science
Abstract
We study the performance of a differential backlog routing algorithm in a network with random failures. Differential Backlog routing is a novel routing algorithm where packets are routed through multiple paths to their destinations based on queue back-log information. It is known that Differential Backback-log routing maximizes the through-put capacity of the network; however little is known about practical implementations of Differential Backlog routing; and its delay performance. We compare Differential Backlog to Shortest Path and show that Differential Backlog routing outperforms Shortest Path when the network is heavily loaded and when the failure rate is high. Moerover, a hybrid routing algorithm that combines principles of both Shortest Path and Differential Backlog routing is presented, and is shown to outperform both. Fi-nally, we demonstrate further improvements in delay performance of the aforemen-tioned hybrid routing algorithm through the use of Digital Fountains.
Thesis Supervisor: Eytan H. Modiano
Acknowledgments
Many factors contribute to a finished piece of work. It would be unfair to take sole responsiblity for this thesis even beyond the bibliograpy.
First and foremost, I want to thank my advisor Professor Eytan Modiano. His constructive feedback guided the thesis to its present form. His ideas and vision have provided the foundation and roadmap for the research that is the subject of this thesis. I learned a great deal from his methodoloy to analyze results and solve problems through the use of simple and elegant insights and principles. Even outside the scope of research, he has helped me to keep my priorities right in the bigger picture of academic and personal development.
Computer simulations play a signficant role in this thesis and required significant computer resources. I would like to thank my advisor for investing in a server suitable for simulations. Many of the results presented herein have just been possible because of faster simulation execution speeds thanks to the new server. Kayi Lee, a research colleague, also contributed by running his simulations at a lower priority to enable me to get some important results towards the end.
I am thankful for getting the opporunity to work in a wonderful research group. I got up-to-speed on many trades and tricks of the game under the mentorship of Gil Zussman who is now a Professor at Columbia University, NY. He made research en-joyable and shared his valuable philosophical perspectives on life. I am also delighted to have worked alongside Guner Celik, Murtaza Zafer, Jun Sun, Andrew Brzezinski, Krishna Jagannathan, Ryan Kingsbury, Anand Srinivas and Seb Neumayer.
Masoud Akbarzadeh, a graduate student in Department of Architecture, has been a great friend and roommate. Asad Kalantarian and Adnaan Jiwaji shared the same class year, major, and dormitory as me through four years of undergraduate life. I was lucky to have them around for Masters as well since they made classes and homework fun. Adnaan helped me a great deal in finishing this thesis, including help with some diagrams.
father for the energy which keeps me going. And I pray that the God Almighty keeps it the same way for times to come.
Finally, this work was supported by the Defense Threat Reduction Agency (DTRA) under grant number HDTRA1-07-1-0004.
Contents
1 Introduction 17
1.1 Communication Systems ... 17
1.2 Optical Communications ... 19
1.3 (Un)Robustness of Optical Networks . ... 22
1.3.1 Single-Link Failures ... ... 23
1.3.2 M ultiple Failures ... 23
1.4 Design of Optical Networks robust against large-scale failures .... . 24
1.5 Area of Focus ... 27
1.6 Thesis Outline ... 28
2 Previous Work 29 2.1 Routing Algorithms ... 29
2.1.1 Shortest Path Algorithms . ... . 29
2.1.2 Differential Backlog Routing . ... 34
2.2 Approach . . . .. . . . .. . 35
3 Performance Evaluation of Differential Backlog Routing 37 3.1 M ethodology ... 37 3.1.1 Assum ptions ... 37 3.1.2 Network Topologies ... 38 3.1.3 Implementation Details ... 40 3.1.4 Performance Metrics ... 40 3.1.5 Simulation Execution ... 40
3.1.6 Results Presentation ... 41
3.2 Differential Backlog Routing ... ... 41
3.2.1 Algorithm Description ... ... .. 41
3.2.2 Implementation Details ... ... 42
3.2.3 R esults . . . . . . .. . . 42
3.3 Comparison with Shortest Path ... .. 55
3.3.1 Algorithm Description ... 55
3.3.2 Implementation Details ... 56
3.3.3 Results . . . .. . 56
3.3.4 N otes . . . 64
4 Adaptations of Differential Backlog Routing 65 4.1 Differential Backlog Routing augmented with Shortest Path .... . 65
4.1.1 Algorithm Description ... 65
4.1.2 Implementation Details ... 66
4.1.3 R esults . . . .. . 66
4.2 Digital Fountains ... 78
4.2.1 Digital Fountain Model ... 79
4.2.2 Implementation Details ... 79
4.2.3 R esults . . . .. . 79
5 Discussion of Practical issues 99
6 Future Directions 103
List of Figures
1-1 OSI layered reference model [13] ... .. 18
1-2 Map of transcontinental fiber-optic submarine cables [1] ... 19
1-3 Qwest fiber-optic back-bone [8] ... .. 20
1-4 AT&T fiber-optic back-bone [8] ... 21
1-5 Example of a network failure and re-routing along alternative paths . 25 2-1 Sub-optimality of Shortest Path routing in terms of throughput . . . 31
2-2 Sub-optimality of Shortest Path routing in terms of delay ... 33
3-1 10-node 4-connected symmetric topology . ... 39
3-2 Qwest OC-192 backbone ... ... ... .. 39
3-3 Reconfigurable symmetry in the 10-node 4-connected symmetric topology 43 3-4 Evidence of the reconfigurable symmetry in the 10-node 4-connected symmetric topology ... 44
3-5 File and packet delays under variation in network loading for different average file sizes in the 10-node 4-connected symmetric topology . . . 46
3-6 Packet delays under variation in network loading for different average file sizes in the 10-node 4-connected symmetric topology ... 47
3-7 File and packet delays under variation in network loading for different average file sizes in Qwest OC-192 Backbone . ... 48
3-8 Packet delays under variation in network loading for different average file sizes in Qwest OC-192 Backbone ... 49
3-9 File and packet delays under variation in network loading with and without failures in the 10-node 4-connected symmetric topology . . . 50
3-10 File and packet delays under variation in network loading with and without failures in Qwest OC-192 Backbone . ... 51 3-11 Packet delays under variation in network loading with and without
failures in Qwest OC-192 Backbone . ... 52 3-12 File and packet delays under variation in failure rate for different values
of network loading in the 10-node 4-connected symmetric topology .. 53 3-13 File and packet delays under variation in failure rate for different values
of network loading in Qwest OC-192 Backbone . ... .... . . 54 3-14 Packet delays under variation in failure rate for different values of
net-work loading in Qwest OC-192 Backbone . ... 55 3-15 File and packet delays of Shortest Path routing as compared to
Dif-ferential Backlog routing under variation in network loading in the 10-node 4-connected symmetric topology . ... 57 3-16 File and packet delays of Shortest Path routing as compared to
Dif-ferential Backlog routing under variation in network loading in the 10-node 4-connected symmetric topology- extended . ... 58 3-17 File and packet delays of Shortest Path routing as compared to
Dif-ferential Backlog routing under variation in network loading in Qwest OC-192 Backbone ... . ... 59 3-18 File and packet delays of Shortest Path routing as compared to
Dif-ferential Backlog routing under variation in failure rate in the 10-node 4-connected symmetric topology at low network loading ... 60 3-19 File and packet delays of Shortest Path routing as compared to
Dif-ferential Backlog routing under variation in failure rate in the 10-node 4-connected symmetric topology at high network loading ... 61 3-20 File and packet delays of Shortest Path routing as compared to
Differ-ential Backlog routing under variation in failure rate in Qwest OC-192 Backbone at low network loading ... . 62
3-21 File and packet delays of Shortest Path routing as compared to Differ-ential Backlog routing under variation in failure rate in Qwest OC-192 Backbone at high network loading . ... . 63
4-1 Delay performance of HybridDB as compared to Differential Backlog routing and Shortest Path routing under variation in network loading for the 10-node 4-connected symmetric topology at low network loads 67 4-2 Delay performance of HybridDB as compared to Differential Backlog
routing and Shortest Path routing under variation in network loading for the 10-node 4-connected symmetric topology at high network loads 68 4-3 Delay performance of HybridDB as compared to Differential Backlog
routing and Shortest Path routing under variation in network loading for Qwest OC-192 Backbone at low network loads . ... 69 4-4 File and packet delays of HybridDB as compared to Differential
Back-log routing and Shortest Path routing under variation in failure rates for the 10-node 4-connected symmetric topology . ... 70 4-5 Packet delays of HybridDB as compared to Differential Backlog routing
and Shortest Path routing under variation in failure rates for the 10-node 4-connected symmetric topology . ... . . . 71 4-6 File and packet delays of HybridDB as compared to Differential
Back-log routing and Shortest Path routing under variation in failure rates for the 10-node 4-connected symmetric topology . ... 72 4-7 Packet delays of HybridDB as compared to Differential Backlog routing
and Shortest Path routing under variation in failure rates for the 10-node 4-connected symmetric topology . ... 73 4-8 File and packet delays of HybridDB as compared to Differential
Back-log routing and Shortest Path routing under variation in failure rates for the Qwest OC-192 Backbone ... 74
4-9 Packet delays of HybridDB as compared to Differential Backlog routing and Shortest Path routing under variation in failure rates for the Qwest OC-192 Backbone ... 75 4-10 File and packet delays of HybridDB as compared to Differential
Back-log routing and Shortest Path routing under variation in failure rates for the Qwest OC-192 Backbone at low failure rates ... . 76 4-11 File and packet delays of HybridDB as compared to Differential
Back-log routing and Shortest Path routing under variation in failure rates for the Qwest OC-192 Backbone at high failure rates . ... 77 4-12 Average successive packet delays for different file sizes for
10-node-4-connected topology, A = 1/5,p = 1/4 . ... 78 4-13 Delay performance of Digital Fountain approach in Differential Backlog
routing as a function of code rate for 10-node 4-connected symmetric topology . . . .. .. . 81 4-14 Delay performance of Digital Fountain approach in Differential Backlog
routing as a function of code rate for Qwest OC-192 Backbone . . .. 82 4-15 Delay performance of Digital Fountain approach in Differential Backlog
routing with failure rate for 10-node 4-connected symmetric topology 83 4-16 Delay performance of Digital Fountain approach in Differential Backlog
routing with failure rate for Qwest OC-192 Backbone . ... 84 4-17 Delay performance of Digital Fountain approach in HybridDB as a
function of code rate for 10-node 4-connected symmetric topology with and without failures ... 85 4-18 Delay performance of Digital Fountain approach in HybridDB as a
function of code rate for 10-node 4-connected symmetric topology with-out failures . . . .. . 86 4-19 Delay performance of Digital Fountain approach in HybridDB as a
function of code rate for 10-node 4-connected symmetric topology with failures ... ... ... 87
4-20 Packet delays of Digital Fountain approach in HybridDB as a function of code rate for 10-node 4-connected symmetric topology with and without failures ... ... 88 4-21 Delay performance of Digital Fountain approach in HybridDB as a
function of code rate for Qwest OC-192 Backbone with and without failures ... ... .. 89 4-22 Delay performance of Digital Fountain approach in HybridDB as a
function of code rate for Qwest OC-192 Backbone without failures . . 90 4-23 Delay performance of Digital Fountain approach in HybridDB as a
function of code rate for Qwest OC-192 Backbone with failures . . .. 91 4-24 Packet delays of Digital Fountain approach in HybridDB as a function
of code rate for Qwest OC-192 Backbone with and without failures 92 4-25 Delays of Digital Fountain approach in HybridDB as a function of
failure rate for 10-node 4-connected symmetric topology with different values of code rate ... 93 4-26 Delays of Digital Fountain approach in HybridDB as a function of
failure rate for 10-node 4-connected symmetric topology with code rate of 1.2 . . . .. .. . 94 4-27 Packet delays of Digital Fountain approach in HybridDB as a
func-tion of failure rate for 10-node 4-connected symmetric topology with different values of code rate ... 95 4-28 Delays of Digital Fountain approach in HybridDB as a function of
failure rate for Qwest OC-192 Backbone with different values of code rate . . . 96 4-29 Delays of Digital Fountain approach in HybridDB as a function of
failure rate for Qwest OC-192 Backbone with code rate of 1.2 . . .. 97 4-30 Packet delays of Digital Fountain approach in HybridDB as a function
of failure rate for Qwest OC-192 Backbone with different values of code rate . . . 98
List of Tables
Chapter 1
Introduction
1.1
Communication Systems
The field of Communications has been around since the evolution of mankind. The earliest examples include the use of smoke signals, mirrors and messengers. These primitive modes of communication were very limited in terms of message content as well as number of users. The need for greater versatility and higher volume of com-munications prompted the emergence of a service industry. The cycle of demand and innovation fueling each other, led to better quality and larger scale of communication services such as telegraph, telephone, wireless telegraph, radio, television, satellites, cellular phones and Internet.
Towards the end of twentieth century, a concerted effort to promote collabora-tion between numerous heterogeneous communicacollabora-tion networks was initiated. The approach taken to solve the problem can be best summarized in the words of one my engineering professors, "When there is a problem, just lump it". The result was the standardization of a layered architecture called The Basic Reference Model for Open
Systems Interconnection [13] for communication systems. The seven layers of OSI
model are shown in Fig. 1-1. Rather than being a strict reference, the OSI model serves more as a guideline and an educational tool for design and analysis.
OSI model can be best explained through example. The Physical layer is respon-sible for providing the medium for transmission of messages; horses, for example in
Open Open ysten nSten Application Presentation -0 Session -1 Transport -Network - 4 Data Link -b Physical - I---I--- I STS02930-94/dl
Physical nmedia for OSI
Figure 1-1: OSI layered reference model [13]
the Pony Express service (1860-1861). The setting of Pony Express network will be continued henceforth, to illustrate the other layers of OSI model. Data Link Control layer controls the transmission of messages across a single physical link. The stations which provided new horses for riders every 10-15 miles can be thought of as provid-ing the functionality of this layer. The network layer provides routprovid-ing information for messages between points which are not linked directly. For example, the maps which Pony Express riders used to navigate around, symbolize this layer. The next higher layer, Transport, controls dispatch and receipt of messages from sources to destinations. The closest resemblance to the functionality of this layer in the Pony Express network would be the dispatcher who decides when enough mail has arrived that a new horse be sent from one coast. Session layer is responsible for initiating and concluding individual correspondences; for example, it would be equivalent of a clerk who issues receipts for mailings. Presentation layer specifies format for a mailing such as a scroll, encrypted message etc. The highest layer, Application, governs essentially different types of available services that a communication network supports, e.g. let-ters, post cards, money orders etc. Table 1.1 summarizes examples of these layers in the Pony Express service and lists their loose equivalents in the modern day Internet.
--J-
--i
- nII n nn svnr m.. --IC---~--+ ~ ~-~----)i
OSI Layer Pony Express Internet Physical horses wires, radio
DLC checkposts Aloha, 802.11 Network maps Internet Protocol(IP)
Transport dispatcher Transport Control Protocol(TCP), User Datagram Protocol(UDP) Session clerk
Presentation scroll, encrypted message, cash HTML, JPEG
Application letter, money Internet Explorer, Windows Media Player Table 1.1: Examples of OSI model layers in Pony Express and the Internet
1.2
Optical Communications
Modern day communication systems can be classified into three main categories based on physical layer and therefore other higher layers, because of the trickling effect of physical layer on the design of higher layers. These are namely satellite, wireless and optical fibers. Electrical wires are sometimes also used in land-line networks but only to provide access at the end-user level. Optical fibers are by far the most widely used communication networks in terms of proportion of total network traffic. The popular-ity of optical fibers stems from their high capacpopular-ity (bandwidth), high speed (latency) and low costs. Transcontinental fiber-optic submarine cables support practically all of the world-wide digital traffic including Internet, corporate communication lines and digital telephony. Fig. 1-2 shows a world-wide map showing the distribution of
transcontinental fiber-optic cables. Thus optical communications play an important role in keeping the world connected.
Figure 1-3: Qwest fiber-optic back-bone [8]
Several optical fiber backbone networks support almost all the digital traffic in the continental United States. Fig. 1-3 and Fig. 1-4 show two commercial back-bone networks. Optical fibers also support almost all of the domestic digital traffic. Both military and commercial users subscribe heavily to optical networks. Apart from the Internet, the commercial applications include landline and cellular/mobile phones. Although mobile phones communicate with a cellular base station, the base stations use optical networks to connect to other base stations which in turn con-nect to the receiver's cellphone. Many economic services also rely heavily on optical communications. These include dedicated lines for banks, ATMs, stock exchanges, etc. Nowadays, cable companies dominate the industry for digital High-Definition
S
NM-a
AT&T
IP BACKBONE
NETWORK
202000
- NX 93 - NXOC3 -- NOG40 C=3 N X OC1aNote map is not to scale.
Figure 1-4: AT&T fiber-optic back-bone [8]
(HD) television channels and play-on-demand multi-media content delivery. Cable companies usually bundle television services with telephone and Internet. The traffic demand of average Internet user is increasing due to the popularity of video sharing websites, Internet radios, TV streams and other bandwidth-intensive applications. Furthermore, a cost-effective ubiquitous 4G service can only be possible if some of the celluar traffic is diverted to land-line networks. Electric cables (1 Gigabit/sec.Cable) are inferior to optical fibers (100 Terabit/sec.Fiber:one wavelength) in terms of theo-retical maximum achievable capacity. As a result, many experts believe that optical fibers supporting TV, land-line and cell phones, in addition to Internet traffic, is the only way forward to cope with the immense pressure on digital traffic bandwidth and latency.
a great deal from a robust optical network. Because of their low-costs, it is easier to provision extra capacity using optical fibers to survive failures and meet unusual surges in traffic demand. Such optical networks can withstand catastrophes and help various government departments co-ordinate rescue and relief operations, sparing costlier satellite and wireless networks for better uses. In emergency situations where communication networks are stressed both in terms of failures and higher loads, robust optical networks can mitigate mass communication cut-offs typical of September 11 and North-East blackout in August, 2003.
1.3
(Un)Robustness of Optical Networks
From a military perspective, optical communications have an edge over other means of communications such as satellite and wireless, in addition to their high bandwidth, low latency and economy. Satellite and wireless networks use airwaves as a medium for carrying signals. Hence they are very susceptible to eavesdropping by third par-ties and encryption techniques are used to keep sensitive information private. Optical fibers need to be tapped physically for a third-party to be able to intercept communi-cations. Moreover, there exist mechanisms to detect any physical tampering of optical fibers by examining the electromagnetic profile of received signal [19]. Satellite and Wireless networks are also prone to electronic jamming whereas optical networks are resilient to such measures. Optical fiber links are also less affected by Electromagnetic Pulse (EMP) attacks in comparison with other communication networks [23].
Optical networks, however, are at an extreme disadvantage in terms of their vul-nerability to physical damage- be it intentional, un-intentional or natural. A sig-nificant amount of wireless infrastructure is mobile and can be reconfigured and/or camouflaged to make it less susceptible to an attack. Similarly, targeting satellites requires high sophistication. Optical networks are however static in nature and at most times fibers are laid in obvious locations such as along rail-road tracks and major highways. To make matters worse, optical fibers take the longest to recover from a failure. 'Wireless units tend to be field replaceable and the notion of spare
satellites parked in orbits [61 can help mitigate a satellite failure. Optical fibers in a Wide Area Network (WAN) such as a national backbone typically span hundreds if not thousands of miles and thus a disruption takes days if not weeks to resolve. It took almost two weeks to repair the under-sea fiber cuts in Mediterranean which severely affected 75 million Internet users in Middle East and India [14] in early 2008. Thus, it is of prime importance to identify ways in which optical networks can be made robust to physical failures.
1.3.1
Single-Link Failures
Un-intentional fiber cuts are not rare in optical networks. Insufficient care while digging for maintenance or laying of utility networks such as electricity, roads, natural gas etc. causes fiber links to be cut. Resultantly, a lot of research [15], [26], [27],
[35], [39], [40], [10] and [31] has been done to make networks in general and optical networks in particular recover in the event of a single physical link failure. Nowadays, commercial network companies provide services which are guaranteed against single link failures, labelled as 1:1 or 1+1. In 1+1 protection, the primary traffic and its copy is simultaneously sent over two disjoint paths and the receiver can tune to the second path in case of a failure. For 1:1 protection, the network provider keeps a spare path which is used if the primary path fails. Nowadays, each optical cable or
trench carries many (typically tens of) optical fibers because it does not make sense
to justify digging hundreds of miles for just one optical fiber. Each optical fiber, in turn, transmits signals at many (usually 100-200) different wavelengths, a technique known as Wavelength Division Multiplexing (WDM). In this context, recovering from single link failures becomes significantly harder because a physical link failure might cause multiple transmissions to be disrupted.
1.3.2
Multiple Failures
Intentional or natural failures can cause yet greater damage to optical networks than isolated single link or node failures. An example of intentional failure is a Weapons of
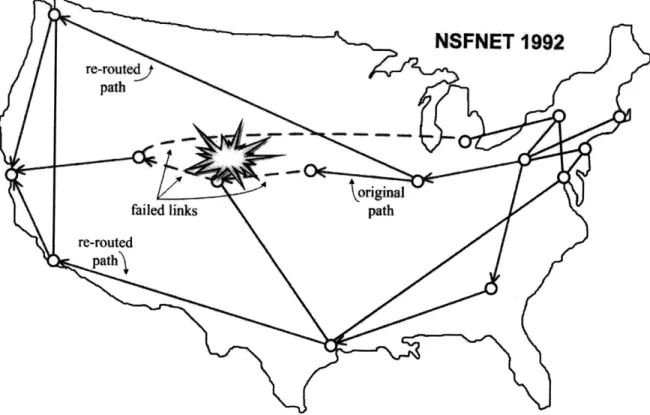
Mass Destruction (WMD) attack which can cause wide-spread node and link failures. Natural causes of failures include hurricanes such as Katrina in summer of 2005, earthquakes such as those that occur frequently in California and floods. Fig. 1-5 depicts NSFNET which was the primary Wide Area Network (WAN) backbone in the United States until mid-90s. It shows example of a mass-scale failure in Western U.S. resulting in several link failures. In the absence of recovery paths, these link failures would have serious consequences for communications between the East and West Coasts. One example is the original path between Pittsburgh, PA and Palo Alto, CA, which has been disrupted. However, as one might observe, there are sufficient unaffected links in the network to reconnect the two stations by re-routing the traffic between them. A single re-routed path might not have sufficient capacity to support all of the re-directed traffic so having multiple recovery paths to share the load of the primary failed path would prove more promising in dealing with large-scale failures. Examples of a couple of re-routed paths are also shown in Fig. 1-5. This example illustrates just one of the desirables of an optical network that is robust against large-scale failures. In general, recovering from multiple failures in context of WDM is expected to be much more complex than recovering from single failures.
1.4
Design of Optical Networks robust against
large-scale failures
We can break down the problem of robustness against multiple failures into four primary subparts.
1. Robust network architecture design
First, a robust network must have enough spare capacity to handle failures. If a node is connected to the network with just one link and that link fails, it would not be possible to restore communications with the affected node. Hence it is essential that a network remains physically connected after failures occur. [15] and [27] are concerned with the design of robust network architectures in the
Figure 1-5: Example of a network failure and re-routing along alternative paths event of a single link failure. The prevailing definition of survivability as the property of a network to recover from a single physical link failure needs to be generalized to k-survivability wherein a network can recover from k link failures. [40] analyzes connectivity of different graphs in terms of the probability of indi-vidual link failures but assumes that nodes are invulnerable. In general, a better framework for analyzing network robustness against multiple failures would be to characterize robustness in terms of the proportion of network component failures below which a network remains connected.
2. Topology inference
Designing a robust network architecture is an issue that needs to be dealt with before a network is operational. However, the first step in dealing with failure(s) in an operational network is to obtain an accurate picture of the extent of dam-age. For the Internet, this .is made possible through employing Open Shortest Path First (OSPF) algorithm which is also responsible for updating routes. In [17], Kleinberg et al. treated the problem of detecting (e, k)-failures, where upto
k network elements (either links or nodes) fail causing disconnectivity of two
sets, each atleast c by fraction of total number of nodes, by placement of D detectors. [5] presents a practical algorithm to infer the topology of a network.
3. (Re-)Routing
Once the up-to-date state of network is known, affected communications need to be re-routed over alternative paths in the network. For small networks, these backup paths can be pre-computed against all possible failures. However, for networks on the scale of a nation, possible failure scenarios become too many to be tractable. For example, the number of possible failures for a graph with just thirty links is more than a billion. [26] studies the problem of routing optical signals in a way which is tolerant of any single physical link failure. The paper also proves that finding these desired routes in a network topology is an NP-complete problem. Dealing with large-scale failures using the same approach can reasonably be expected to be yet harder. The second sub-problem of topol-ogy inference can be avoided or discounted a great deal depending upon the information needs of the routing algorithm. For example, if a routing algorithm requires knowledge of the complete topology of a network, recovery can take too long to start.
4. Quality of Service(QoS) support
It is impossible to design an invincible network regardless of the amount of spare capacity built into physical network architecture. From a commercial point of view, it is not always cost-effective to pay for spare capacity. Therefore, a network which can support Quality of Service (QoS) for different types of traffic in case of a large-scale failure is highly desirable. For example, government or military communications in a national crisis must take priority over commercial traffic. [10] talks about providing multiple degrees of reliability for different services in a network in a cost-effective manner. In [31], Ou and Mukherjee have approached the QoS problem from the perspective of differentiated quality of restoration times.
We have broken down the problem of robustness against large-scale failures, which formed the initial motivation for this research effort, into sizeable sub-parts. Herein, we will treat one of the important subparts which will have consequences on the design of other subparts as well.
1.5
Area of Focus
In this thesis, we will focus on the third subpart: the autonomous routing problem. The second and fourth sub-problems depend largely on routing because they are determined by the information needs and ability of the routing algorithm respectively. An effective routing problem can be likened to an experienced and alert traffic sergeant. Like a traffic sergeant, it should try to do the best job possible given road (lane closures) and traffic conditions (congestion) etc. including accommodating vehicles of varying priority levels (ambulances).
More specifically, we are concerned with scheduling the use of available resources, which are link capacities in a network, to transmit packets from a source node to a specified destination node. Our main interest lies in scenarios of wide-spread, large-scale and arbitrary failures in a network. Since a general approach is desired to accommodate arbitrary network topologies, failure rates and load patterns, we seek an algorithmic solution. The sought algorithm needs to be self-fulfilling for its in-formation needs and implementation; hence it must be autonomous. Ideally, the
autonomous algorithm must also be able to provide fully differentiated quality of
service (QoS), as specified earlier. The merits of an effective routing algorithm are: 1. restoration time in event of a failure
2. delay
3. throughput/achievable capacity
4. fairness according to a QoS specification 5. practicality
1.6
Thesis Outline
Section 2 provides academic context to the problem of autonomous routing by dis-cussing previous work, introduces Differential Backlog routing and describes our ap-proach for its analysis. In section 3 we present experimental results on the perfor-mance of Differential Backlog routing and its comparison with the existing paradigm of routing, namely Shortest Path routing. In section 4, we suggest and examine vari-ants of Differential Backlog routing which exhibit better performance. In section 5, we provide discussion of considerations for a realistic version of Differential Backlog routing. Section 6 talks about topics for future research and we finish with concluding remarks in Section 7.
Chapter 2
Previous Work
2.1
Routing Algorithms
Almost all realistic networks are incomplete graphs. Hence, typically messages need to travel through intermediate nodes to get to their destinations. A routing algo-rithm is responsible for directing messages from their origins all the way to their respective destinations. There are two sides to the problem of routing in general: first, how are the paths calculated; and second, how are they enforced. Obviously, the first distinction is broader and we use it to distinguish between different routing mechanisms.
2.1.1
Shortest Path Algorithms
Many different routing algorithms exist in practice. Shortest Path algorithms are by far the most popular class of algorithms employed in modern networks. As it might be implied from their name, Shortest Path algorithms consider all the possible paths between a source and destination and choose the one with minimum cost. The costs are typically a function of length, congestion, monetary costs etc. of a link. Bellman-Ford and Dijkstra [9] are two widely used shortest path algorithms. The best-known running times of these algorithms are 0(IVI log V + E) and 0(IV IEI) respectively, where V represents the number of nodes and E represents the numer of edges in a
network. As it can be seen, these algorithms grow quickly with network size.
Apart from their running time, Shortest Path algorithms also have many other issues:
* Distributed Implementation
The decentralized nature of most networks requires distributed implementation of these algorithms giving rise to a set of issues [2]. Propagation of network state information and synchronization among nodes are major issues which become worse in the event of a change of topology before a pass of algorithm is finished. Border Gateway Protocol (BGP) [32], [11], and Open Shortest Path First (OSPF) [12] are well-documented and well-studied routing protocols employed in modern networks such as the Internet.
* (In)Efficiency
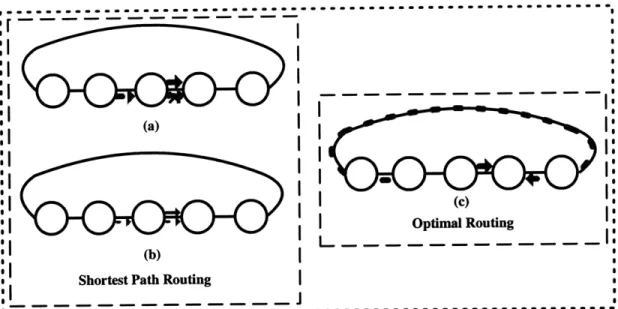
Shortest path algorithms come under the class of greedy algorithms and thus do not always achieve optimality. While each session is routed over its shortest path, network resources might not be utilized to their full potential as a whole. A link might become a bottle-neck while other links might be left unused at the same time. This means that either some sessions are blocked or that they get lower-than-achievable rates. For example consider the example presented in
Fig. 2-1.
In Fig. 2-1, 2-1(a) and 2-1(b) depict what happens when two sessions try to take place simultaneously in a network employing shortest path routing. In Fig. 2-1(a), the second session gets blocked while going over its second hop because all of the hop's capacity is dedicated for the first session. Another possibility is to share the limited capacity between the two sessions which would allow them to take place simultaneously but at half the rate that can be supported by a hop, as illustrated in Fig. 2-1(b). Ideally, the second transmission can also achieve full capacity if it is routed through a longer but unutilized path as shown in Fig. 2-1(c). This is an example of optimal routing for the given topology and traffic conditions.
---I
:1
J. (a) I ii() !:1
I
SI
SI
6SI
.- ~: 'S II I-I (c) '* I Optimal Routing Optimal RoutingI
(b)Shortest Path Routing
Figure 2-1: Sub-optimality of Shortest Path routing in terms of throughput * Network Congestion
Traffic demand in most networks is random and inconsistent. This means that various parts of a network are stressed at different times. Routing algorithms can be static or adaptive. A static routing algorithm only updates computed paths in response to a link or node failure. An adaptive algorithm also takes congestion on different parts of the network into account. Most major networks employ some sort of adaptive routing based on shortest path to respond well to a variety of traffic conditions. .The congestion information cannot be fully taken into account by all parts of the network because real-time updates of traffic situation will not only give rise to more congestion but probably will be useless by the time they reach all nodes in a network. In experience, a compromise is made between the transmission requirements of congestion information and its usefulness.
* Stability
Realistic networks tend to be dynamic in terms of traffic conditions and network resource availability. The time taken to respond to a network change is an important criterion for evaluating the performance of a routing protocol. A routing protocol which takes congestion information into account might divert
traffic from a busy link to an idle link. This will cause the idle link to become busy and the routing protocol might divert traffic back to the original link and so the cycle starts all over again. This leads to an oscillatory behavior and far worse kinds of oscillations are possible [2].
Although stability issues are made prominent by the need for distributed imple-mentation, they are specially exacerbated in incremental routing protocols. In an incremental protocol, only changes in network topology and routing policies are propagated through the network. The relative locale in time and place of these updates might make them outdated or redundant. Routers which act on outdated updates also send more updates to their neighbors triggering more outdated updates and giving rise to increased network congestion and rapid fluctuations in routing policies. For example, Border Gateway Protocol (BGP), the routing protocol used to route packets among Autonomous Systems (ASs) in Internet, has convergence issues and has been a subject of due monitoring and academic investigation [21], [22].
Survivability
Because of the reasons mentioned in Section 1.3, it is desirable for a network to be tolerant of failures. As mentioned in Section 1.5, the routing problem in context of large-scale failures is the main focus of this thesis. Distributed implementations of shortest path algorithms take significant time to re-route traffic for large networks using respond-on-the-fly approach. [20] shows that it could take upto 15 mins in some cases for BGP to converge in event of a single failure while packet loss and delay can increase manifold during recovery. One can reasonably expect the failure response to be worse yet for large-scale failures and [33], [34] explore some techniques for its improvement.
The response time to failures can be significantly improved by pre-planning against all the failure scenarios. For instance, [4] presents algorithms for finding shortest pairs of disjoint paths- both link and vertex- to accommodate single-link failures. However, preplanning against all possible failures becomes increasingly
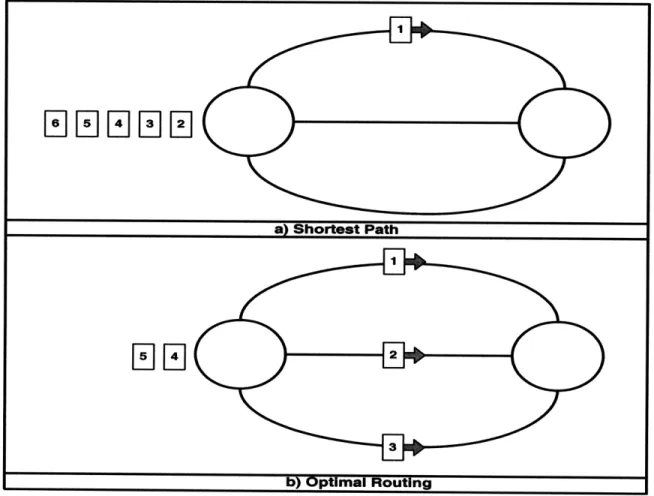
impractical with increasing size of networks and possibility of large scale failures. Inspite of all the above-mentioned issues, Shortest Path algorithms are very pop-ular because of their excellent delay performance. Since packets are routed directly to their destinations, they tend to take the shortest time. Shortest path can there-fore meet stringent Quality of Service(QoS) specifications of delay for time-sensitive services such as voice, video and tele-surgery. It is possible to achieve better delays than those of Shortest Path algorithms, however. The trick lies in realizing that a session typically consists of one or more file transfers whereas a file contains a number of packets. The file delay may be improved by using multiple paths to send packets from the same file. Figure 2-2 illustrates this phenomenon.
b) Optimal Routing
Figure 2-2: Sub-optimality of Shortest Path routing in terms of delay
We will now turn to a different paradigm of routing which is suitable for distributed implementation and tries to utilize the full capacity of a network.
F1EJEnWEn2
2.1.2
Differential Backlog Routing
Our goal is to develop novel approaches to the autonomous re-routing problem for rapid and efficient failure recovery. Tassiulas and Ephremides [38] proposed an algo-rithm that solves the problem of maximum flow for a static network with traffic of a single class of priority in the context of multi-hop wireless networks. They proved that the algorithm is optimal in achieving the capacity of a network with stochastic multi-class traffic. This is in comparison to the Ford-Fulkerson algorithm [9] which solves the problem of single commodity maximum flow in a static network. We refer to Tas-siulas's algorithm as the Diffusion Routing or Differential Backlog algorithm since it actively routes traffic to remove heterogeneity and keeps queue backlogs minimized in a network. Traffic is classified based on its destination(s) and kept in different queues. The algorithm tries to keep queue sizes for different classes of traffic balanced.
Making the algorithm of Tassiulas and Ephremides more specific to optical net-works, the network consists of N nodes and L links. Let s(i) and d(i) represent the source and destination respectively, of link i. Packets are distinguished by the desti-nation node
j
that they are headed to. Each node keeps a queue of packets awaiting service, except the packets destined to the node itself which are removed upon arrival at the node. Let Xn,(t) be the number of packets at node n destined for node j at the end of time slot t. At each slot t, the routing decision is made as follows: for linki, let
3i = arg max (Xs(i)j -
Xd(i)j)-jE{1,2,...,N}
If there are multiple classes of packets which happen to achieve the maximum, one is chosen arbitrarily. Assuming all links are of unit capacity, a packet of class ji is transferred over link i in slot t. To prevent a situation where there might not be enough packets at a node to be served by the links, if number of packets of any class at a node are less than or equal to the number of outgoing links at the node, the outgoing links are left unutilized.
Since the introduction of Tassiulas's algorithm, many further works have spe-cialized or generalized the notion of achieving increased throughput using
differen-tial backlog information in various settings. In [37], Tassiulas presented Differendifferen-tial Backlog algorithm in context of networks with varying topologies. Maximum weight matching in an input-queued switch to attain 100% throughput [24] is just a special case of the Differential Backlog algorithm. Neely et al. generalized the Differential Backlog algorithm taking into account transmitter power constraints in [30] and fair-ness in [29]. Tassiulas suggested the use of randomized algorithms for the implementa-tion of Differential Backlog algorithm in [36]. However, little practical work has been done to explore difficulties in practical implementation and measure other important metrics of performance beyond capacity of Differential Backlog algorithm. Increased requirements for computing at each node and expected worse delay performance have been the primary concern for practical circles concerned with routing.
As far as the information needs of Differential Backlog routing are concerned, it can be easily implemented in a distributed manner since each node only needs to know about the state of its neighbors. The theoretically proven performance and ease of implementation of Differential Backlog routing makes it an obvious candidate for autonomous re-routing in context of failures. The expected delay of Differential Backlog routing is higher than that of shortest path algorithms because packets can travel in loops. However, it still does not deter us to take a deeper look at some of the practical issues of Differential Backlog routing and compare its performance with Shortest Path routing.
2.2
Approach
Since a theoretical treatment of the delay of Differential Backlog routing algorithm appears unwieldy at first sight, we decide to take the route of computer simulations. Developing simulations will not only allow us to focus on issues that might arise in implementation of Differential Backlog routing but will provide us with very prac-tical metrics of performance such as end-to-end packet and file delays, queue-sizes and computational complexity. We can also evaluate the performance of Differen-tial Backlog routing under a variety of traffic conditions, failure situations and real
networks to find out how it compares with Shortest Path. Lastly, one can also try to tweak Differential Backlog routing algorithm to overcome any apparent flaws and improve its performance.
Chapter 3
Performance Evaluation of
Differential Backlog Routing
3.1
Methodology
3.1.1
Assumptions
We assume that time is slotted. All packet transmissions are completed by the end of a slot. In a slot, events take place in the following order: link statuses change, files arrive and packets get transmitted.
Arrivals
There has been a history of using Poisson traffic in network modeling and analysis [18]. Karagiannis et al. have observed similar trends in the traffic patterns experienced
by an Internet babckbone [16]. We choose Poisson arrivals in our simulations also for
their simplicity of analysis and implementation.
Files arrive at the beginning of each slot at each node according to a Poisson process with an average of A files per slot. A file is equally likely to be destined to any node in a network except the source node. The number of packets in each file is a geometric random variable with parameter p.
Failures
As we seek to investigate the problem of routing in context of wide-spread network failures, we need a framework for evaluating the performance of Differential Backlog routing under failures. Herein, we concentrate on studying the effect of link failures and ignore node failures which are less frequent. At the beginning of each slot, each live link has a probability pf of failing. Similarly each failed link becomes re-activated with probability p,. All links start in the live state. The steady state probability [3],
rf, of being in the failed state is given by P
3.1.2
Network Topologies
An important question that comes up during treatment of a concept based on sim-ulation is the choice of background scenarios. Our primary focus in making these decisions has been on practicality, suitability for Differential Backlog routing and computational complexity. We have considered two network topologies as we analyze the performance of Differential Backlog routing along with its different variants and Shortest Path routing.
10-node 4-connected symmetric topology
The first is a 10-node symmetric topology as shown in Fig. 3-1 where each node is connected to four other nodes.
Qwest OC-192 Backbone
Secondly, we use the network of high capacity OC-192 links from the Qwest backbone presented earlier in Fig. 1-3 to analyze the performance of Differential Backlog in a representative real setting. The topology of Qwest OC-192 backbone used in our simulations is shown in Fig. 3-2.
Figure 3-1: 10-node 4-connected symmetric topology
ftljkAr f h I f)% D4alkCA%0
3.1.3
Implementation Details
Since links have been implemented just as conduits for traffic flow and all the buffering is done at the nodes, no packets are lost when a link fails. Hence no packets are dropped or lost and assuming links will be re-activated eventually, there is no need for error correction or transport control.
3.1.4
Performance Metrics
There are several metrics for evaluating the performance of a routing algorithm as described in Section 1.5. Our simulations allow us to extract data on file and packet delays, computational complexity and buffer sizes. In our analysis, we present quan-titative results on end-to-end delays and use them as the primary criterion for com-paring the performance of different routing schemes. End-to-End delay is the time a file or packet takes to reach its destination after its arrival at the source node . End-to-End delay constraints play a vital role in smooth functioning of most real world applications such as email, internet browsing, voice and video conferencing etc. and thus can genuinely capture the utility of a routing algorithm. Nevertheless, we do oc-casionally make qualitative comparisons of buffer sizes and computational complexity in performance analysis of different routing schemes.
3.1.5
Simulation Execution
Simulations can complement theoretical analysis of a phenomenon but can rarely serve as a substitute. The limitations of simulations lies in the finiteness of their life times and specificity of their results. For instance, it is hard to conclude whether a particular traffic load is stable even if buffer sizes do not increase significantly over long intervals. Similarly, insights gained from simulation study of a few topologies cannot be generalized. We, however, take utmost care to make sure that simulations converge to a stable point by comparing results from repetitive runs. Also, buffer sizes must become relatively stable for a simulation to be deemed useful.
3.1.6
Results Presentation
End-to-End file and packet delay results are extracted for each possible session in a network. However, due to large number of these sessions and difficulty to differentiate between them in terms of their usefulness, we take their averages. The average end-to-end file and packet delays over all sessions, thus, convey a wholistic view of delays
experienced by a network.
As will become apparent, there are several parameters that govern a simulation: network topology, A, p, pf, ps, for instance. We present selected results that capture a general trend or convey an interesting point. The latter required careful adjustment
of parameters and do not convey trends that hold in general. These cases will be identified as such and the emphasis is placed on the existence of these regions of operation.
3.2
Differential Backlog Routing
3.2.1
Algorithm Description
The underlying idea behind Differential Backlog routing is to use all of the network resources to distribute data, differentiated by destination, evenly throughout the net-work. Since a destination acts as a traffic sink, the net flow of traffic is from all of the data sources to each of the destinations. In mathematical terms, borrowing Neely's notation [28], let Us(C)(t) be the number of packets waiting at node a destined for node c at time t. For each pair of directly connected nodes, let's say a and b, the
commodity cab(t) with the highest differential backlog, i.e.
Cb(t) = arg max {U( c) - Ub()(t) (3.1)
cE1,...,N
is transmitted over the link (a, b) at time t.
After all arrivals for a slot take place, each link is marked with the commodity that has the maximum differential backlog across that link, with ties broken randomly. For
links with a positive differential backlog, as many packets of the marked commodity as the capacity of the concerned link are transmitted across the link. To simplify preliminary analysis, we assign a capacity of one packet per slot to all links in our simulations. It is possible that there are not enough packets of a commodity for transmission over all the outgoing links marked with it at a node. In case of such a shortage, the outgoing links marked with the commodity are served in a random order as long as packets of the commodity remain at the node. The remaining links are left unutilized for the slot. All packet transmissions are completed by the end of the slot.
Like the approach used in [37] for applying Differential Backlog routing to networks with time-varying topologies, the links are further constrained under failures. A failed link cannot transmit any packets from its source to its destination in a slot.
3.2.2
Implementation Details
The queue at each node is implemented as n- 1 FIFO buffers to hold packets destined to each of the other nodes in the network. The computer memory held by these buffers is managed dynamically and hence there are virtually no limits (apart from hardware constraints on memory) to buffer sizes as long as the loading is experimentally stable. Consequently, no transport control or error-recovery mechanism is needed to ensure loss-less delivery of packets. Each link can transmit up to one packet in every slot from the link's source to its destination. In each slot links are processed in a random order to achieve random breaking of ties in the case of multiple links competing for a limited commodity at a node.
3.2.3
Results
Symmetry in 10-node 4-connected symmetric topology
Since each node can receive a file request for any other node in the network, there are a total of ninety different sessions, namely (1, 2), (1, 3), (1, 4), ..., (2, 1), (2, 3), 2, 4), ..., (10, 9).
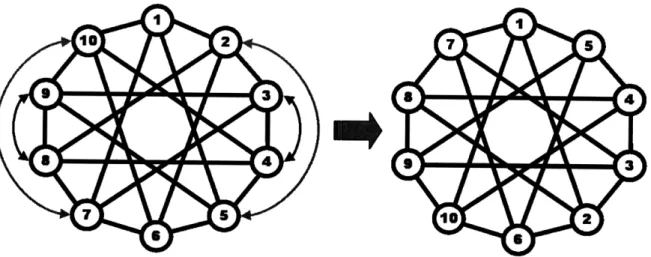
Figure 3-3: Reconfigurable symmetry in the 10-node 4-connected symmetric topology
are symmetric. Since the links are bi-directional, the reciprocal sessions such as {(1, 2), (2, 1)} and {(1, 3), (3, 1)} must be symmetric. Rotational symmetry leads to sessions such as {(1, 2), (2, 3), ..., (10, 1)} and {(1, 3), (2, 4), ..., (10, 2)} being identical. Also, due to the reflexive symmetry around any line joining two opposite nodes, ses-sions such as {(1,2), (1, 10)} and {(1,3), (1, 9)} are identical as well. Although, it might not be obvious from the topology, a closer examination of the topology reveals that sessions such as {(1,2), (1, 5)} and {(1,3), (1, 4)} are also symmetric. Fig. 3-3 helps to recognize this reconfigurable symmetry. The node pairs: {2, 5},{3, 4},{7, 10} and {8, 9}, can be graphically swapped all-at-once without changing the underlying graph. After the swap every node would still be connected to the same set of nodes as before the swap. The new graphical layout shown in Fig. 3-3 clearly demonstrates why the above-mentioned sessions must be symmetric. Hence, the number of essentially different sessions is three.
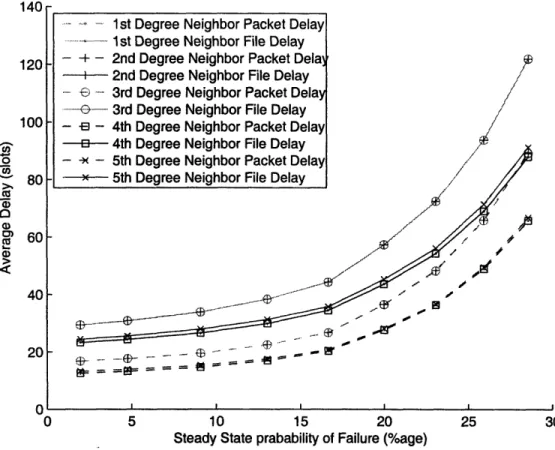
It is good practice to perform sanity checks for ensuring correctness of simulations. Simulation results for individual sessions were checked against the above-mentioned symmetries. Infact, the reconfigurable symmetry was discovered through simulation results shown in Fig. 3-4. Here, sessions have been grouped according to their degrees of separation along the rim of the decagon which takes into account the first three kinds of symmetries namely reciprocal, rotational and reflexive. The classification yields five groups of sesssions and the average file and packet delays of all sessions
14U, 120 100 80 y 60 40 20 n Efr - ---- "c,
/
/ //]
/
. -.+--K
-..
)-,
~ --.e
I .. I I Ii I 0 5 10 15 20 25 30Steady State prabability of Failure (%age)
Figure 3-4: Evidence of the reconfigurable symmetry in the 10-node 4-connected symmetric topology
in a class are plotted against increasing rate of failures. However, the results show existence of just three fundamentally different classes. The delays of first and fourth degree neighbors are equal; and the delays of second and third degree neighbors are equal. This observation confirms reconfigurable symmetry in 10-node 4-connected symmetric topology.
From now onwards, for sake of better presentation and in the interest of studying more useful delay trends, we just plot average end-end file and packet delays over all sessions. Results for mutliple values of a control variable are often plotted for better utilization of the graphing space.
- 1st Degree Neighbor Packet Delay
-... 1st Degree Neighbor File Delay
- + - 2nd Degree Neighbor Packet Delai
-- +-- 2nd Degree Neighbor File Delay
... --- 3rd Degree Neighbor Packet Delay
... ... - 3rd Degree Neighbor File Delay
- - - 4th Degree Neighbor Packet Delay
--e-- 4th Degree Neighbor File Delay
- -x - 5th Degree Neighbor Packet Delay
---x- 5th Degree NeiClhbor File Delay
,41 AI
-/R
I
Delay response to variations in Network Loading
We will study all the governing parameters of simulations one by one. First, we focus on variables in the loading model. The average loading at a node in terms of number of packets received per slot is given by:
E[number of packets arriving at each node]
= E[number of file arrivals] x E[number of packets in a file],
Since file arrivals and number of packet arrivals are assumed to be independent processes.
p
p
We obtain results for different levels of network loading. For each network load, we plot results for three {A, p} pairs which yield the same network load. The analysis allow us to study the behavior of increased network loading and average file sizes.
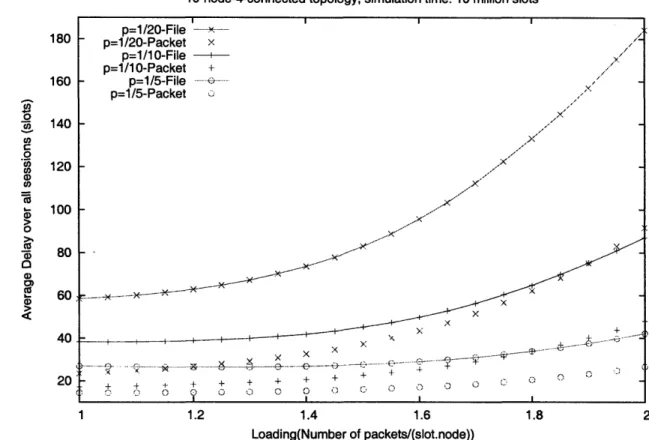
10-node 4-connected symmetric topology The average file and packet delays over all sessions in the 10-node 4-connected symmetric topology, are plotted against increasing network load in Fig. 3-5. Netwok loading is varied through increases in average file arrival rate values. As expected the delays increase with average file arrival rate A. The growth can be best described as exponential.
Fig. 3-5 also shows the variation of file delays with respect to the parameter p which governs the number of packets in a file. We see that as average number of packets in a file 1 decreases, the average end-to-end delays tend to improve. This is expected because, decreasing average number of packets per file and increasing file arrival rate A proportionately (to keep network loading constant) leads to a more uniform traffic arrival with respect to time. Hence sizes of input queues at nodes remain smaller and packets see less queueing delays at the source nodes.
Fig. 3-6 plots the average packet delays for better comparison. Average packet delays are typically less than average file delays but exhibit the same trend.
10-node-4-connected topology, simulation time: 10 million slots p=1/20File -p=1/20-Packet x p=1/10-File --p=1/10-Packet + p=1/5-File . ... p=1/5-Packet x x + ' . .;f-, ... .. . .. x x x .... ... .... ... ..... . ._ I ... .... ..+ ...-.- .... .. . .. ... . ,.. . .. . : . ... . ... ... ... 1 ,. ... ,. . . .... . .. . ..t : .... .... 4... -+ -" + ( ) o + 4- -l I D Loading(Number of packets/(slot.node))
Figure 3-5: File and packet delays under variation in network loading for different average file sizes in the 10-node 4-connected symmetric topology
180 160 140 120 100 80 60 r....-..w- -- x-(: I
10O-node-4-connected topology, simulation time: 10 million slots
1 1.2 1.4 1.6 1.8 2
Loading(Number of packets/(slot.node))
Figure 3-6: Packet delays under variation in network loading for different average file sizes in the 10-node 4-connected symmetric topology
10 O-node-4-connected topology, simulation time: 1 million slots 140 120 0 o .9 100 ca > 80' 0 g 60 40 2n 0.4 0.6 0.8 1 1.2 1.4 1.6 1.8 Loading(Number of packets/(slot.node))
Figure 3-7: File and packet delays under variation in network loading for different average file sizes in Qwest OC-192 Backbone
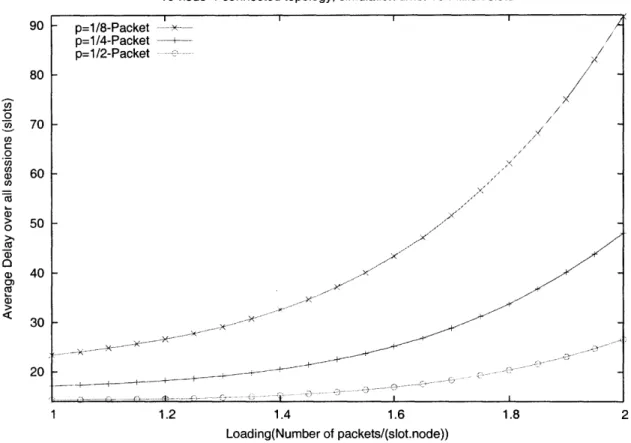
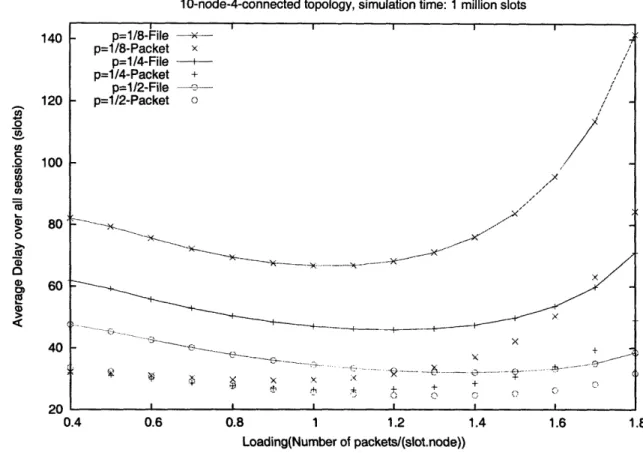
Qwest OC-192 Backbone The results for average file and packet delays for Qwest OC-192 backbone are presented in Fig. 3-7. The results confirm the trends observed for 10-node topology, namely higher delays for higher average file sizes and general increase in delays with increased loading. However, a notable difference is the observed increase in delays as loading decreases. This phenomenon has been predicted by Neely in his doctoral thesis [28]. If a network is lightly loaded, the absence of backlog pressures can contribute to packets taking random walks. The delays increase because of the increased time taken to reach a destination using a random walk approach.
In Fig. 3-8 we plot average packet delays which, as in the 10-node topology case, follow file delays but are smaller.
p=1/8-File -- ~--p=1/8-Packet x p=1/4-File ----p=1/4-Packet + p=1/2-File -p=1/2-Packet / - --w-X ...-X- --- ... -,x .- . ... ... .. . I .... ... .... ... ... .. .... .. .
Owest OC-192 Backbone, simulation time: 1 million slots
0.4 0.6 0.8 1 1.2 1.4 1.6 1.8 Loading(Number of packets/(slot.node))
Figure 3-8: Packet delays under variation in network loading for different average file sizes in Qwest OC-192 Backbone
80 9 70 .o 060 c o 50 C3 S40 30
![Figure 1-1: OSI layered reference model [13]](https://thumb-eu.123doks.com/thumbv2/123doknet/14137369.469861/18.918.153.783.115.442/figure-osi-layered-reference-model.webp)
![Figure 1-3: Qwest fiber-optic back-bone [8]](https://thumb-eu.123doks.com/thumbv2/123doknet/14137369.469861/20.918.142.797.200.702/figure-qwest-fiber-optic-bone.webp)