Publisher’s version / Version de l'éditeur:
Vous avez des questions? Nous pouvons vous aider. Pour communiquer directement avec un auteur, consultez la première page de la revue dans laquelle son article a été publié afin de trouver ses coordonnées. Si vous n’arrivez pas à les repérer, communiquez avec nous à PublicationsArchive-ArchivesPublications@nrc-cnrc.gc.ca.
Questions? Contact the NRC Publications Archive team at
PublicationsArchive-ArchivesPublications@nrc-cnrc.gc.ca. If you wish to email the authors directly, please see the first page of the publication for their contact information.
https://publications-cnrc.canada.ca/fra/droits
L’accès à ce site Web et l’utilisation de son contenu sont assujettis aux conditions présentées dans le site
LISEZ CES CONDITIONS ATTENTIVEMENT AVANT D’UTILISER CE SITE WEB.
Research Report (National Research Council of Canada. Construction),
2014-10-24
READ THESE TERMS AND CONDITIONS CAREFULLY BEFORE USING THIS WEBSITE.
https://nrc-publications.canada.ca/eng/copyright
NRC Publications Archive Record / Notice des Archives des publications du CNRC :
https://nrc-publications.canada.ca/eng/view/object/?id=e87fad2c-59af-4c65-acd8-c74e7cdec468 https://publications-cnrc.canada.ca/fra/voir/objet/?id=e87fad2c-59af-4c65-acd8-c74e7cdec468
NRC Publications Archive
Archives des publications du CNRC
For the publisher’s version, please access the DOI link below./ Pour consulter la version de l’éditeur, utilisez le lien DOI ci-dessous.
https://doi.org/10.4224/21275341
Access and use of this website and the material on it are subject to the Terms and Conditions set forth at
Characterization of fires in multi-suite residential dwellings: final
project report: part 2-Analysis of the results of post-flashover room fire
tests
Characterization of Fires in Multi-Suite Residential
Dwellings
Final Project Report
Part 2
– Analysis of the Results of Post-Flashover Room
Fire Tests
Project Title: Characterization of Fires in Multi-Suite Residential
Dwellings
Authors:
Alex Bwalya, Eric Gibbs, Gary Lougheed,
Ahmed Kashef
Date:
24
rdOctober, 2014
Construction Portfolio
Fire Safety
i
Preface
This report analyzes the results of 14 full-scale post-flashover room fire experiments that were conducted in Phase 2 of the Characterization of Fires in Multi-Suite Residential Dwellings (CFMRD) project. A compilation of the test results from Phase 2 is provided in Part 1 of the final project report.
The CFMRD project was a collaborative undertaking with industry, provincial governments and city authorities that was initiated by NRC-IRC in 2006 to study fires in low-rise multi-suite residential dwellings of light-frame construction. The project was undertaken due to the need to:
a) Address the lack of realistic design fires, which are required to aid the development of methods for achieving performance-based solutions to fire problems, and;
b) Further the understanding of how fires in residential buildings sometimes cause fatalities and substantial property losses, as revealed by fire statistics.
The CFMRD project focused on fires in dwellings, such as apartments, semi-detached houses, duplex houses, townhouses or row houses, secondary suites and residential care facilities as these fires have a potentially greater impact on adjacent suites. To this end, the fully-developed phase of a fire was of particular interest since there is a greater potential for the building assemblies
enclosing the room of fire origin to be damaged by high temperatures during this period. The main objectives of the project were:
1. To conduct fire experiments to characterize fires originating in various living spaces within multi-suite dwellings.
2. To conduct numerical simulations of various fire scenarios in order to interpolate and extend the data beyond that obtained in the experimental studies.
3. To produce a set of realistic design fires for multi-suite dwellings from the test data. 4. To develop an analytical method that can be used to calculate design fires for
multi-suite dwellings.
The research approach employed in the project utilized literature reviews, surveys to determine typical configurations and combustibles, computer simulations and fire experiments. In Phase 1 of the project, fire experiments were conducted in a room calorimeter to determine the combustion
characteristics of individual typical household furnishings found in living spaces that have a high incidence of fires. In Phase 2, fire experiments were conducted in fully-furnished rooms simulating
ii
residential bedrooms, a living room, a main floor, a secondary suite and a residential care bedroom. Numerical modelling of fire development, using suitable fire models, was conducted in Phase 1 to assist in the design and instrumentation of the full-scale fire experiments as well as to study the effect of various parameters, such as the ventilation conditions and geometry on the development of the fire.
NRC gratefully acknowledges the financial and technical support of the Project Consortium, which consisted of representatives from the following participating organizations:
Canadian Automatic Sprinkler Association
Canadian Concrete Masonry Producers Association Canadian Furniture Manufacturers Associations The Canadian Wood Council
City of Calgary - Development and Building Approvals City of Calgary - Fire Department
FPInnovations Gypsum Association Masonry Worx
Ontario Ministry of Municipal Affairs and Housing
Ontario Ministry of Community Safety and Correctional Services (Office of the Fire Marshal) Régie du Bâtiment du Québec
iii
Abstract
This report presents the analysis of results for 14 full-scale fire experiments that were conducted in a specially constructed full-scale test facility. The facility was instrumented to measure the heat release rate (HRR), heat flux, temperatures, gas velocities, smoke optical density and composition of fire gases at various locations. The test program involved an array of configurations to simulate key areas in a dwelling such as a bedroom, a living room and a main floor (consisting of a kitchen and a living room). Experiments were conducted for different floor areas and under various ventilation conditions. The fuel load consisted of typical residential furnishings. In all of the test scenarios, the first-ignited-item was a primary combustible furnishing, such as a bed assembly or an upholstered seat (sofa). The tests were designed to last for a period of 1 hr in order to capture the key phases of fire development: growth, flashover, fully-developed (post-flashover) and decay phases. In order to achieve one of the main objectives of the research, which was to produce a set of realistic design fires, it was decided that high intensity fires that have the potential to pose a risk to adjacent suites would be the focus of the research.
Flashover typically occurred in less than five minutes. It occurred in as little as 140 seconds in fires started with a strong flame in highly combustible furnishings, such as sofas and beds. The results showed that there were considerable differences in HRR profiles, and peak values varied widely for the resulting post-flashover fires since the HRR is a strong function of ventilation, among other variables such as fuel load composition. For instance, peak HRR values varied from 2,793 kW to 9,230 kW (mean of 5,847 kW and standard deviation of 2,122 kW), whereas the mean maximum temperatures (during the fully-developed phase) only varied from about 1,036°C to 1,203°C (mean of 1,110oC and standard deviation of 54°C). The mean duration of the fully-develop phase was 17 min with a standard deviation of 4 min.
One of the main conclusions was that, in rooms lined primarily with gypsum board, regardless of other variables (such as, ventilation, fuel load, ignition method and room size), the mean maximum temperatures fell within a narrow range of approximately 1,050°C to 1,200°C. However, test variables and particularly ventilation, first-ignited-item and composition of the fuel load had a significant effect on the time of attainment and duration of the fully-developed phase (defined in this work as stage R4), during which the mean
maximum temperature occurs. The mean maximum temperature during the fully-developed phase and the duration of stage R4 (over which it is calculated) are considered to be the appropriate measure of fire severity since temperature is the thermodynamic result of the HRR in a given room fire, while the duration defines the exposure time. Another main conclusion was that the primary bedroom scenarios within this research
resulted in the most severe fire conditions of the scenarios tested since they had a large floor area and therefore contained the greatest amount of combustible materials.
The one test incorporating a residential sprinkler system had a rapid extinguishment of the fire. The sprinkler activated within 50 seconds and the maximum temperature recorded at a single point in the room was 117°C.
iv
A fire starting in a oil-filled pot on the stove, in a layout simulating a main floor with a kitchen, and living room, developed much more slowly (9 minutes to flashover) than one where the fire originated in a sofa in the same main floor configuration (3 minutes to flashover).
A detailed analysis of the results was carried out to attempt to identify and explain features of the fires that could form the basis of a computation model to calculate the mean maximum temperature and the duration of the fully-developed phase of a room fire. The results of this research provided valuable knowledge about the effect of key parameters such as window size and first-ignited-items on the outcome of the fire. The test results revealed that there was a significant variation in fire severity within a single room due to the
complexity of the fire dynamics, which makes it difficult to describe the fires using average values of key fire properties.
v
Contents
NOMENCLATURE ... viii
1 Introduction ... 1
2 Literature Review ... 3
2.1 Stages of Room Fire Development ... 3
2.2 Flashover Stage ... 6
2.3 Flashover Correlations ... 7
2.3.1 Babrauskas’ Correlation ... 7
2.3.2 Thomas ... 7
2.3.3 McCaffrey, Quintiere and Harkleroad (MQH) ... 7
2.4 Calculating Temperatures in Post-Flashover Room Fires ... 8
2.4.1 Law’s Correlation ... 9
2.4.2 Ma and Makelainen’s Correlation ... 10
2.4.3 Tanaka’s Correlation ... 10
2.4.4 Eurocode Parametric Curves ... 11
3 Experimental Program ... 13
4 Results and Analysis ... 18
4.1 Summary of Quantitative Results ... 18
4.2 Qualitative Results (Dynamics of Fire Development) ... 20
4.2.1 Novel Understanding ... 20
4.2.2 Characteristics of Fire Development... 22
4.3 Quantitative Results and Analysis ... 27
4.3.1 Primary Bedrooms (Configuration B1) ... 27
4.3.2 Flashover ... 38
vi
4.3.4 Living Room (Configuration B4) ... 60
4.3.5 Secondary Suite (Configuration B5) ... 69
4.3.6 Main Floor (Configuration B6) ... 76
4.4 External Burning and Heat Radiation ... 83
4.5 Tenability ... 85
4.5.1 Room of Fire Origin ... 85
4.5.2 Adjacent Spaces ... 87
4.6 Overall Conclusions on Fire Room Fire Behaviour ... 88
4.6.1 Fire Growth ... 89
4.6.2 Time to Flashover ... 90
4.6.3 Multiple Flashovers: ... 91
4.6.4 Post-Flashover to Fully-Developed Phases ... 91
4.6.5 External Combustion ... 93
4.6.6 Decay Phase ... 94
4.6.7 Zonal Burning Behaviour ... 94
5 Realistic Design Fires ... 94
5.1 Correlation of Results... 97
5.1.1 Growth Phase (Stage R2) ... 97
5.1.2 Fully-Developed Phase (Stage R3) ... 97
5.1.3 Fully-Developed Phase (Stage R4) ... 99
5.1.4 Decay Phase (Stage R5) ... 100
6 Analytical Results ... 102
6.1 Evaluation of Existing Methods ... 103
6.2 The CFMRD Calculation Method ... 106
vii
6.2.2 Duration of Stage R3 ... 111
6.2.3 Maximum temperature in Stage R4 ... 115
6.3 Comparison with Published Test Data ... 119
6.3.1 Comparison with calculated results using the CFMRD method ... 120
7 Conclusion ... 121
7.1 Realistic Design Fires for Multi-Suite Dwellings... 123
8 Acknowledgments ... 125
9 References ... 125
A.1 Base Configuration B1 – Primary Bedroom ... 129
A.2 Base Configuration B2 – Secondary Bedroom with Window # V2 ... 131
A.4 Base Configuration B2 – Secondary Bedroom #2 with Window # V5 ... 132
A.3 Base Configuration B4 – Living Room ... 133
A.6 Base Configuration B5 – Secondary Suite ... 134
NOMENCLATURE
A Area (m2)
Af Surface area of fuel element (m
2 )
Ao Area of a ventilation opening (m2)
As Exposed surface area of the fuel load (m2)
AT Total internal area of bounding surfaces of an enclosure (
2
m
)b A parameter in Equation (2.27), =
k c
p (W.s0.5/m2K)bref Reference value of b (W.s
0.5 /m2K)
Cd Orifice constriction coefficient (-)
Cp Specific heat capacity (kJ/kg.K)
Fo Opening factor (
1 2
m
)Fref Reference value of the opening factor (
1 2
m
)Fv Ventilation factor (
5 2
m
)g Acceleration due to gravity (m/s2)
h Heat transfer coefficient (kW/m2.K)
H Height (m)
Ho Height of ventilation opening (
m
)4
R
HRR
Mean HRR in Stage R4 (kW)HRRpa Average peak HRR per m2 for the fuel load (kW/m2)
IFo Inverse opening factor (
1 2
m
)k Thermal conductivity (kW/m.K)
L Fuel load (kg)
M mass of combustible material (kg)
Mc Mass of single combustible item (kg)
Mf Total mass of fuel (kg)
m
Rate of mass flow (kg/s)
f
M Fuel load per unit area (kg/m2)
f
M
Mean fuel load (kg/m2),
q Q
Bench-scale heat release rate or Heat flux (kW/m2)
mf
q
Heat flux at floor level (kW/m2)
mwc
q
Maximum heat flux on the walls and ceiling (kW/m2)o
Q Reference heat release rate (Equation(2.1)) (kW)
Q Heat release rate (kW)
FO
Qt Total fuel load density (MJ/m 2 ) RD Room depth (m) RW Room width (m) T Temperature (oC or K)
Tgm Time variable used in Equation (2.19) (
o C)
g,max
T
Variable used in Equations (2.29) (oC)̅ Mean maximum hot layer temperature (oC)
t Time (s or min)
t* Fictitious time used in Equation (2.26) (hrs)
tb Duration of burning (s)
tHRRv Time to reach HRRv (s)
d
t
Duration of heating phase, given by Equation (2.31) (hrs)* d
t
Modified duration time; given by Equation (2.32) (hrs)FD
t
Duration of the fully-developed phase, given by Equation (6.3) (min)THR Total heat released (MJ)
tm Time at which maximum temperature occurs (min)
To Reference temperature (
o C)
to Time to reach a reference heat release rate (s)
XHT Value of either temperature or HRR at the start of the decay phase X1 Fraction of FL consumed at decay (during the fully-developed phase)
Wo Width of ventilation opening (m)
GREEK LETTERS
A constant used in Equations (2.22) and (2.23) (K s-1 6)
g
T
Upper gas temperature rise above ambient (T
g-T
) (K)ΔtRX Duration of fire development stage RX, where X = 1 to 5 (s)
Density (kg/m3)
Emissivity
is a correlation coefficient used in Equation (5.1) (W/s) Opening factor parameter in Equation (2.13)
Parameter in Equation 2.14 (defined by Equation (2.15))
Shape constant (-)
Stefan Boltzmann constant = 5.67 x 10⁻⁸ (W m K2 4)
thermal diffusivity (s-1)
X Standard deviation
4
X
HRRR Standard deviation of HRR at Stage R4δw Wall thickness (m)
Parameter defined by Equation (2.18)
b Burnt out time, used in Equation (2.25) (s)
cr Variable used in Equation (2.21) SUBSCRIPTS Ambient condition a Air air Air avg Average f Fuelg Pertains to hot gas
max Maximum value
n Number of openings
R Room condition
ABBREVIATIONS
CFMRD Characterization of Fires in Multi-Suite Residential Dwellings
CO Carbon monoxide
CO2 Carbon dioxide
FL Fuel load (MJ)
FLED Fuel load density (MJ/m2)
GWB Gypsum board
HC Heat of combustion (calorific value) (MJ/kg)
HRR Heat Release Rate (kW/m2)
HRRv Ventilation controlled HRR (kW/m2)
NE North East
NW North West
NFPA National Fire Protection Association
O.C. On center
OD/m Optical density per meter (m-1)
OSB Oriented strand board
O2 Oxygen
PCF Primary combustible furnishing
PRF Post-flashover Room Fire
PUF Polyurethane foam
RGWB Regular Gypsum board
SCF Secondary combustible furnishing
SD Standard deviation
SE South East
SW South West
TC Thermocouple
Characterization of Fires in Multi-Suite Residential Dwellings Project
Final Project Report
Part 2
– Analysis of the Results of Post-Flashover Room Fire Tests
by
Alex Bwalya, Eric Gibbs, Gary Lougheed, Ahmed Kashef
1
Introduction
This second part of the project report analyzes the results of a series of 14 full-scale post-flashover room fire experiments that were conducted in Phase 2 of the Characterization of Fires in Multi-Suite Residential Dwellings (CFMRD) project. The CFMRD project was a collaborative undertaking with industry, provincial governments and city authorities that was initiated by NRC-Construction in 2006 to study fires in low-rise multi-suite residential dwellings of light-frame construction. The project was undertaken due to the need to: a) address the lack of realistic design fires, which are required to aid the development of methods for achieving performance-based solutions to fire problems, and b) further the understanding of how fires in residential buildings sometimes cause fatalities and substantial property losses, as revealed by fire statistics.
A description of all the tests, including the raw data, is presented in Part 1 of this report [1]. The CFMRD project focused on fires in dwellings, such as apartments, semi-detached houses, duplex houses, townhouses or row houses, secondary suites and residential care facilities as these fires have the potential to spread to adjacent suites.
In Phase 1 of the project [2], 36 fire experiments were conducted with various individual residential furnishings in a well-instrumented 16 m2 room (with dimensions 3.8 m wide x 4.2 m long x 2.4 m high) to capture the effect of radiation feedback and other room effects on fire behaviour. The furnishings tested included mattresses, bed clothes, bed assemblies, upholstered seating furniture, clothing arrangements, books, plastic audio/video media and storage cases, toys and a computer workstation setup.
In Phase 2, the fire experiments were conducted in a specially constructed one-storey test facility, which was designed to represent a single storey of a multi-family dwelling, such as a main floor or second storey, having a floor area of approximately 48 m2. The fire experiments will hereafter be referred to as “tests”, which is typical terminology in the field of fire research. The experimental (or test) facility permitted a flexible array of test configurations to be constructed, such as: single rooms with floor dimensions of 3.8 m x 4.2 m (area: 16 m2) or 3.2 m x 3.5 m (area: 11.2 m2), multiple
rooms or a single large room covering the entire 48 m2 floor area to simulate a main floor in a multi-family dwelling, for example. The fuel load in the tests consisted of real residential furnishings and all of the fires were initiated with a flaming ignition source resulting in rapidly developing fires in all of the 13 tests where the first-ignited item was a primary combustible furnishing (PCF). In order to study a kitchen fire, rather than using direct impingement on a PCF, a more realistic ignition source, a stove-top oil fire, was used. Without direct impingement on a PCF, the growth of the fire was less rapid.
The test variables to develop the complete matrix of 14 tests were derived, in consultation with the project consortium, from six main layouts to explicitly evaluate the effect of ventilation, fuel load density and composition, ignition location, and sprinklers on the room fire. Tenability was studied by conducting a multi-room experiment in which fire effluent from the room of origin was allowed to flow into an adjacent room, where smoke density and the concentration of O2, CO2 and CO gases
was measured. Two tests were devoted to studying fires in residential care dwellings (bedrooms) and secondary suites, which were considered to have a similar composition of furnishings to those in regular dwellings.
The tests were well-instrumented, with approximately 130 to 150 data measurement points (channels of data) used per test, in order to obtain the following measurements:
a) Heat release rate (HRR); b) Temperatures;
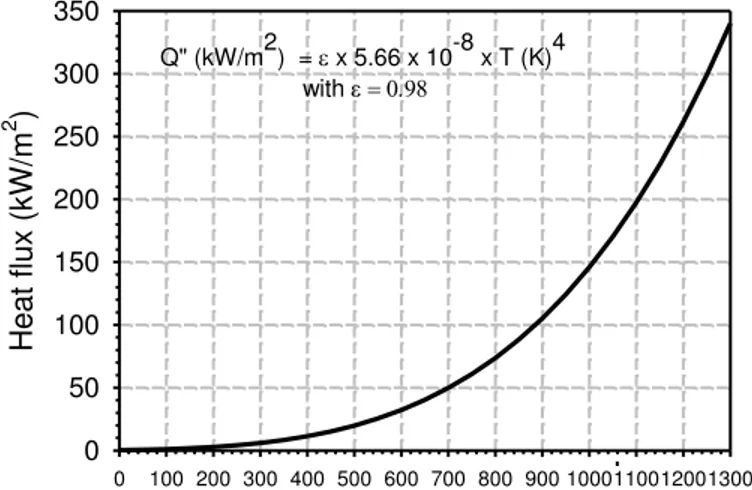
c) Thermal radiation flux (heat flux)1;
d) Concentrations of O2, CO2 and CO gases at various locations, and;
e) Gas flow velocities in the window openings and the exhaust duct, and; f) Static pressure.
The HRR and room temperatures (measured using thermocouple trees) were two of the most important measurement quantities given their role in defining the potential of a fire to cause damage to the surrounding building elements by thermal-induced degradation.
1
2
Literature Review
2.1 Stages of Room Fire Development
The different stages of fire development in a room have been studied intensely for many years and excellent treatises can be found in the widely available literature [3 - 6]. Post-flashover room fires are conventionally understood to undergo four distinct stages of fire development2, as shown in Figure 1 [7, 8], from ignition to extinction: incipient, growth, ventilation-controlled or
fully-developed3, and decay.
Following ignition, the course of a fire is generally described by [9]:
a) the incipient and growth period (also referred to as the pre-flashover period); b) whether flashover occurs or not;
c) time to reach a peak HRR;
d) fully-developed or post-flashover period, and; e) decay period.
Time
Ignition
Incipient Growth Fully-developed (ventilation-controlled) Decay (fuel-surface controlled) Flashover H e a t re le a s e r a te Extinction Fuel-surface controlled HRR curve
Figure 1. Stages of fire development in a room in the absence of an active suppression system [8].
The duration of the incipient phase depends on the strength and location of the source of ignition, ventilation conditions and the thermal properties of the combustible materials. In addition to these factors, fire development in a room is also understood to be influenced by the amount, type,
2
Fire development is here defined as the progression of a fire from ignition to extinction. 3
Full-room involvement is characterized by the burning of all exposed combustible surfaces and the burning rate (HRR) is limited by the size of the ventilation (window) opening.
position, spacing, orientation, and surface area of the fuel package, and the thermal inertia of the materials constituting the boundaries of the room [4].
The heat release rate during the growth stage is commonly approximated by the parabolic curves known as t-squared fires [8]. In a t-squared fire, the burning rate is assumed to vary proportionally to time squared. The NFPA t-squared design fires [10], given by Equation (2.1), are widely used and referenced in the literature: EQUATION SECTION (NEXT)EQUATION SECTION (NEXT)
2 o o t Q = Q t (2.1) where:
Q = rate of heat release (kW);
o
Q
= reference heat release rate (kW), usually taken to be 1,055 kW.o
t
= time to reach reference heat release rate (s)t
= time after effective ignition (s)The various categories of fire growth, which are commonly used, are given in Table 1 and illustrated graphically in Figure 2.
Table 1. Categories of t-squared Fires
[7].
Growth Rate
Design Fire Scenario Characteristic time, to (s)
Slow Floor coverings 600
Medium Shop counters, office furniture 300 Fast Bedding, displays and padded work-station
partitioning
150
Ultra-fast Upholstered furniture, lightweight furnishings, non-fire-retarded plastic foam storage,
cardboard, and plastic boxes in vertical storage arrangement.
Figure 2. t-squared fires, rates of energy release [8].
Many studies have observed that the burning rate of fuel elements depends on the rate of flow of outside air into the enclosure. The flow of air through ventilation openings, such as windows and doors into a room, has been shown [6] to be proportional to the ventilation factor, Fv (
5 2
m
), which is given by:v o o
F =A H (2.2)
where Ao is the area of the opening and Ho is the height of the opening. For a room containing more
than one opening, Ao and Ho are the total area of the openings and weighted height of the
openings, respectively [4]. For n openings, Ho is given by Equation (2.3):
1 n n n o o
A H
H
A
(2.3) where: n = number of openings Ao = 1 n n A
The maximum air flow through a given room opening is given as [11]:
0.5
Vair
m
F (2.4)The dependence of the rate of burning on FV is often expressed in terms of an opening factor,
Fo (
m
1 2), given by:Time from Ignition (s)
0 200 400 600 Hea t Re lea se Rat e ( kW ) 0 1000 2000 3000 4000 5000 6000 Ultra-fast Slow Medium Fast
o V T
F
F
A
(2.5)where AT (m2) is the total internal surface area of the enclosing surfaces. FV and Fo are used in
many empirical fire correlations.
The maximum HRR is the value at which any one of the following events occurs [8]: a) the fire becomes ventilation-controlled and combustion proceeds at a relatively steady rate; b) a fire suppression system activates; c) the decay phase begins (in a fuel-controlled fire). Fires involving multiple combustibles, which become involved in the fire at different times, may exhibit a different behaviour such as having multiple HRR peaks.
The ventilation-controlled HRR (HRRv) is calculated by using Equation (2.6). For most fuels, the heat released per unit mass of air consumed is approximately equal to 3,000 kJ/kg [11]; therefore, the HRRv can be determined from:
1500
vHRRv
F
(2.6)2.2 Flashover
Flashover is a stage in the course of a fire during which exposed surfaces of most of the combustibles within the room suddenly ignite and the fire is no longer restricted to the first item ignited. At this stage, the HRR, temperature, smoke production and smoke toxicity increase rapidly until a further increase is restricted by the rate at which air flows through the available room
openings [11]. The occurrence of flashover is generally believed to be promoted by hot-gas temperatures between 500°C and 600°C, and radiation heat flux levels of about 15 to 20 kW/m2 at the floor level of the room [4]. The appearance of flames from an enclosure’s openings is also said to indicate imminent flashover [4]. A more detailed discussion of flashover is provided by Poulsen et al. [12]
Simple correlations and more elaborate expressions are available in the literature [6, 11, 13, 14], which can be used to determine the likelihood of flashover and whether or not a fire will be ventilation-controlled or fuel-controlled, based on the knowledge of the HRR, size of the room, thermal properties of the materials forming the boundaries of the room, and the size and number of ventilation openings. Following flashover, fires usually progress rapidly to the fully-developed stage, where the rate of combustion is characterized by high HRRs and temperatures under ventilation-controlled conditions. Depending on the composition of the fuel load and room configuration, external combustion (and a degree of combustion inefficiency) is known to occur during the fully-developed stage, in which case the peak HRR measured outside the fire
compartment can exceed the ventilation-controlled value. When most of the combustible materials are expended, the HRR diminishes and the decay phase ensues.
2.3 Flashover Correlations
The following are three commonly used correlations for predicting flashover [11]. A more detailed discussion of these methods is provided by Poulsen et al. [12]:
2.3.1 Babrauskas’ Correlation Babrauskas’ correlation [15] is given as:
750
FO o o
Q A H (2.7)
Where
Q
FO (kW) is the heat release rate that will cause flashover to occur. 2.3.2 ThomasThe correlation by Thomas [16] is given as:
7.8 378
FO T o o
Q A A H (2.8)
2.3.3 McCaffrey, Quintiere and Harkleroad (MQH)
McCaffrey, Quintiere and Harkleroad [17] used a simple energy balance to develop the correlation given by the following equation:
1 3 2 1 2 2480
T g FO p k o oT
Q
g c
T
h A A
H
(2.9) where: gT
Upper gas temperature rise above ambient (T
g-T
)hk is a heat transfer coefficient for the boundaries given by Equations (2.10) and (2.11)
: 2
4
p
w kk c
h
for t
t
(2.10) 2 4 w k w k h for t (2.11) where:AT total internal surface area of a room (m2)
δw is the wall thickness (m)
α is the thermal diffusivity ⁄ of the wall material (s-1) is the thermal conductivity of the boundary and (kW/m.k) t is the time from fire start (s)
2.4 Calculating Temperatures in Post-Flashover Room Fires
The calculation of temperatures in post-flashover room fires has been studied for many decades and the thermal and fluid dynamics of the fires are well known [18] and documented in the
published literature. Based on the existing theory [18], the following factors are known to determine the fire-induced temperature:
a) Fuel pyrolysis rate;
b) Size of ventilation openings (governs oxygen supply, radiation and convection losses); c) Thermal properties of the room’s wall and ceiling materials (governs conduction losses); d) Calorific value of the combustibles (governs the heat release potential);
e) Combustion efficiency (governs amount of potential heat released in the room); and; f) Effective emissivity of the fire gases (governs radiation heat transfer).
Many models for calculating temperatures in post-flashover fires are available in the published literature [11, 19]. The fundamental mathematical modelling approach that is employed to calculate the fire temperature involves conducting an energy balance on the room. Under ideal combustion conditions, achieved at 100% combustion efficiency with no heat losses, the absolute maximum theoretical temperature (also known as the adiabatic flame temperature) achieved by the
combustion of most common materials in normal air is reported to be in the narrow range of 1,970°C – 2,070°C [18]. Each of the factors listed contribute to cause a reduction of the adiabatic flame temperature to its actual value in a room fire.
A common simplification (the so-called “well-stirred-reactor” model) in modelling post-flashover room fires is to assume that the combustion gases in the room behave as if they were well-mixed, i.e., their properties are uniform throughout the volume [6, 20]. Therefore, in the well-stirred-reactor model, the temperature during the post-flashover fully-developed phase is assumed to be uniform throughout the room, allowing it be modelled as a single control volume. The validity of the well-stirred-reactor model has been questioned before and found not to be accurate [21, 22]. The CFMRD research project presented an opportunity to further evaluate the accuracy of the well-stirred-reactor approximation using a more extensive set of realistic room fire tests.
The available correlations were reviewed and the following four methods were selected for use in this study for calculating room temperature and fire duration (fire severity) during the post-flashover phase.
2.4.1 Law’s Correlation
Law’s correlation [11] is given as:
0.1
(max)1
6000
ge
T
(2.12)where
T
g(max) is the maximum gas (fire) temperature and (the opening factor) is determined from:
T o
o oA
A
A
H
(2.13)and (AT – AO) is the surface area of the room, which is exposed to heat. Equation (2.12) represents
the upper limit of the temperature rise for a given [11]. If the fuel load is low, this value may not be reached. The average fire temperature, Tg, is given by:
0.05
(max)1
g gT
T
e
(2.14) where
0.5 o T oL
A A
A
(2.15) whereL is the fuel load in (kg of wood) and the effective duration of the fire is given by:
f
L m
(2.16)where
m
fis the rate of burning in kg/s. This is obtained from the empirical correlation for wood:
0.036
0.18 ( ) 1 60
f o o
m A H RW RD e (2.17)
where RW and RD are the width and depth of the room, respectively, and:
0.5 f V
m
RD
F
RW
(2.18)2.4.2 Ma and Makelainen’s Correlation
Ma and Makelainen [23] developed a parametric temperature-time curve for structural fire design for small and medium room fires. The method was said to predict temperature history of fully-developed room fire with reasonable precision and applies to predominantly cellulosic fuels. The correlation is given as follows:
0 0
exp 1
g gm m mT
T
t
t
T
T
t
t
(2.19)1240 11
T gm o oA
T
A
H
(2.20)For fuel surface controlled fire, the maximum gas temperature would be:
14.34 T gm cr o o A T knq
A H (2.21) where:k = ratio of floor area to the total surface area of the room n = ration of fuel surface area to its mass.
q = fire load density per unit floor area (kg of wood / m2)
t = time (min)
Tg = hot gas temperature (°C)
Tgm = maximum hot gas temperature (°C)
0
T
= reference temperature, taken to be 20°C.tm = time at which maximum hot gas temperature occurs (min)
= shape constant for the curve.
cr
= To o
A
A
H
(differentiates between fuel and ventilation controlled burning)2.4.3 Tanaka’s Correlation
According to Tanaka’s correlation [24], the absolute temperature (K) is given as:
,12.50
,1 ,11.00
F F FT
T
T
for
(2.22)
,14.50
,1 ,11.00
F F FT
T
T
for
(2.23)where: 1/3 1/6 ,1
O O F t pA
H
t
A
k C
T
= ambient temperature = 300 K t = time (s)k = thermal conductivity of the enclosure lining (kW/m K)
= density of the enclosure lining (kg/m3)
p
C
= specific heat capacity of the enclosure lining material (kJ/Kg K) Calculation of burning rate using Sekine’s [25] method:0.1 O O ( / )
m A H kg s (2.24)
Therefore, the burnout time,
b( )
s
, is computed as:b
M
m
(2.25)where:
M= total mass of combustible material available for combustion (kg)
m
= mass burning rate (kg/s)2.4.4 Eurocode Parametric Curves
In the EUROCODE [26] parametric fire temperature equations for representing post-flashover temperatures, a time-temperature relationship is produced for any combination of fuel load, ventilation openings and wall lining materials. The time-temperature curves from which the
equations were derived were produced by Magnusson and Thelandersson [27], and are shown in Figure 3.
Buchanan [3] and Karlsson and Quintiere [4] discuss the methodology employed by Magnusson and Thelandersson to produce the curves in greater detail. The effect of ventilation on the
maximum temperature and duration of burning is apparent from Figure 3, and it can also be seen that the peak fire temperature increases with ventilation for any given fuel load.
Time (hr) 0 1 2 3 4 5 6 T em p erat u re ( oC) 0 200 400 600 800 1000 1200 1 -o 2 o 0 t H F = A 0.04 m A 2550 75 126 188251 377 Qt = 502 MJ/m2 Time (hr) 0 1 2 3 4 5 6 T em p erat u re ( oC) 0 200 400 600 800 1000 1200 1400 1 -o 2 o 0 t H F = A 0.12 m A 75 151 226377 565 754 1130 Qt = 1507 MJ/m2 Time (hr) 0 1 2 3 4 5 6 T em p erat u re ( oC) 0 200 400 600 800 1000 1200 1 -o 2 o 0 t H F = A 0.06 m A 3875 113188 283 377 565 Qt = 753 MJ/m2 Time (hr) 0 1 2 3 4 5 6 T em p erat u re ( oC) 0 200 400 600 800 1000 1200 1 -o 2 o 0 t H F = A 0.01 m A 6.3 12.6 18.8 31.4 47.162.8 94.2 Qt = 126 MJ/m2
Figure 3. Time-Temperature Curves for Different Ventilation Factors and Fuel loads [27]. The EUROCODE method divides the fire development into two phases: the heating phase (full-developed phase) and the decay phase. The equation for the heating phase is:
-0.2t* -1.7t* -19t*
T = 1325 1-0.324e
-0.204e
-0.472e
(2.26)where T is the temperature (°C) and t*is a time parameter (in hours) that is given by:
2 o ref ref * t = t F F b b (2.27)where b is
k C
p (Ws0.5/m2K), Fo is the opening factor given by Equation (2.5), Fref is thereference value of the opening factor, taken to be 0.04,
k C
p is the thermal inertia, and bref is thereference value of
k C
p , given the value of 1160. Therefore, Equation (2.27) can be rewritten as:P
k C
2 2 *F
o1160
t = t
0.04
(2.28)where t is the time (in hours).
The EUROCODE temperature-time curve in the decay phase is given by:
625(
)
0.5
250(3
)
2.0
250(
)
2.0
* * g g,max d d * * * * g g,max d d d * * * g g,max d dT
T
t - t
for t
T
T
t )(t - t
for 0.5
t
T
T
t - t
for t
(2.29) where:Tg,maxis the maximum temperature in the heating phase for * * d
t = t
and:
2 2 -3 * t o d o p0.13×10 Q
F
1160
t =
F
k c
0.04
(2.30)The duration of the heating phase is given in terms of real time, by:
-3 t d o
0.13×10 Q
t =
F
(2.31)therefore, the modified duration time can be rewritten as [4]:
2 2 * o d d p
F
1160
t = t
0.04
k C
(2.32)3
Experimental Program
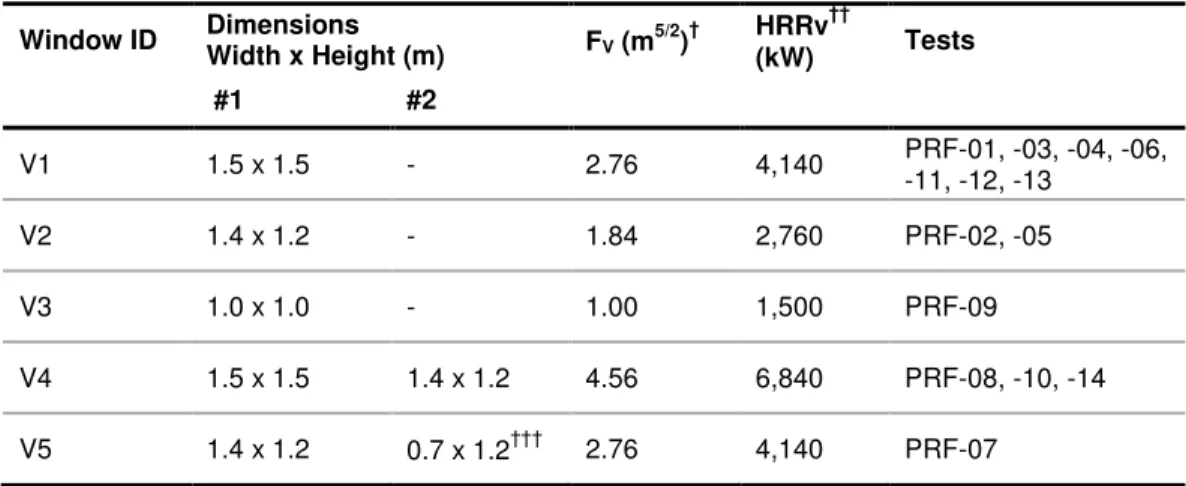
Fourteen room fire tests were conducted in a one-storey test facility, which was designed to represent a single storey of a multi-family dwelling, such as a main floor or second storey, having a floor area of approximately 48 m2 (obtained from survey results [28]). The tests were based on the six base configurations, which are given in Table 2. Table 3 lists the window sizes and their
corresponding theoretical ventilation-controlled HRRs, which varied from approximately 1,500 kW to 6,900 kW (ventilation factors ranging from 1 to 2.76). A detailed description of the following aspects of the experimental setup is provided in Part 1 of the report [1]:
1. One-storey test facility: Construction details of the facility, roof and ceiling assemblies, floor assemblies and test wall sections.
2. Design of room fire tests: Test matrix and related terminology, design fuel loads and test layouts.
3. Instrumentation: Data acquisition system and instrumentation plans. 4. Test procedures: Ignition, test duration and termination.
5. Data Processing: HRRs, temperatures, gas concentrations, smoke optical density, gas velocities and radiation heat flux.
The test matrix was formulated to address the following objectives:
1) Objective #1: Characterize fire behaviour for each of the six base configurations. 2) Objective #2: Evaluate the effect of the following parameters on fire characteristics:
ventilation, fuel load composition and fuel load density (FLED). 3) Objective #3: Evaluate the effect of using a residential sprinkler.
4) Objective #4: Determine the repeatability of the measurements. (Repeatability is an
assessment of the measurement variability found when the same test is repeated using the same apparatus under identical conditions. In many experimental studies, it is desirable to have less variability, i.e. good repeatability in the measurements is an indication of a good level of confidence in the results).
5) Objective #5: Determine the progressive mass loss during a test.
Table 4 provides the complete list of the tests conducted, indicating some of the key variables and details. Only one test (PRF-13) was conducted with load cells installed to measure the rate of mass loss during the test. Table 5 shows the status of Test Wall Section (TWS) installations in the tests.
Table 2. Base configurations of PRF Tests. No. Base configuration Floor dimensions (floor area) Tests
B1 Primary bedroom 3.8 x 4.2 m (16.0 m2) PRF-01, -02, -03, -04 B2 Secondary bedroom #1 3.2 x 3.5 m (11.2 m2) PRF-05, -07
B3 Secondary bedroom #2 3.2 x 3.5 m (11.2 m2) PRF-09
B4 Living room 3.8 x 4.2 m (16.0 m2) PRF-06, -11, -12, -13
B5 Secondary suite Bedroom: 3.8 x 4.2 m (16.0 m
2) Living room: 3.4 x 6.3 m (21.4 m2) PRF-08 B6 Main floor (living/dining/kitchen) 7.3 x 6.3 m (46.0 m 2 ) PRF-10, -14
Table 3. Window sizes used in the Tests. Window ID Dimensions Width x Height (m) FV (m5/2)† HRRv
†† (kW) Tests #1 #2 V1 1.5 x 1.5 - 2.76 4,140 PRF-01, -03, -04, -06, -11, -12, -13 V2 1.4 x 1.2 - 1.84 2,760 PRF-02, -05 V3 1.0 x 1.0 - 1.00 1,500 PRF-09 V4 1.5 x 1.5 1.4 x 1.2 4.56 6,840 PRF-08, -10, -14 V5 1.4 x 1.2 0.7 x 1.2††† 2.76 4,140 PRF-07 †
Ventilation factor (F =Av o Ho ) where Ao = sum of openings and Ho = average of heights;
††
Ventilation-controlled HRR calculated assuming a combustion efficiency of 100%: HRRv (kW) = 1,500 x Fv
†††
Window in Room #2 was taken to be the governing opening size since it was smaller than the doorway in Room #2, which measured 0.9 m wide x 1.9 m height.
Table 4. Summary of the setup and variables for the tests.
Test ID Config.† Objective Variables
Window Floor finish Additional details
PRF-01 B1 1 V1 Carpet Base configuration
PRF-02 B1 2 V2 Carpet Evaluated the effect of a reduced window
size (compared to PRF-04).
PRF-03 B1 2 V1 Hardwood
Evaluated the effect of increased wood composition on fire behaviour
Achieved by replacing the carpet and under pad with hardwood flooring.
PRF-04 B1 1 V1 Carpet Base configuration: Repeat of PRF-01, which was terminated prematurely.
PRF-05 B2 1 and 2 V2 Carpet Base configuration and also evaluated effect of high FLED.
PRF-06 B4 1 V1 Carpet Base configuration.
PRF-07 B2 2 V5 Carpet
Multi-room with door open to adjacent room (PRF-05 fuel load), studied:
1. Smoke flow and tenability conditions in Room #2. 2. Effect of increased ventilation
(compared to Test PRF-05).
Test ID Config.† Objective Variables
Window Floor finish Additional details
PRF-09 B3 2 V3 Hardwood Base configuration
PRF-10 B6 1 V4 Hardwood and
vinyl Base configuration
PRF-11 B4 3 V1 Carpet
Evaluated the effect of a residential sprinkler. Most of the SCFs were excluded since it was anticipated that the sprinkler would extinguish the fire before they ignited.
PRF-12 B4 4 V1 Carpet Repeat of Test PRF-06.
PRF-13 B4 5 V1 Carpet
Based on configuration B4 with: 1. Load cells installed to measure
mass loss.
2. Room surfaces lined with cement board to prevent corruption of mass loss measurements.
PRF-14 B6 2 V4 Hardwood and
vinyl
Evaluated the effect of a kitchen fire started by a stove-top fire source.
† Base configuration.
Table 5. Status of TWS installations in the tests. Specimen GWB
(single layer on each side)
Location
Installation status in PRF Tests (“X” denotes presence of a particular TWS) 1 2 3 4 5 6 7 8 9 10 11 12 13 14 TWS 01 12.7 mm Regular East X X X X X X - X - X - X - X TWS 02 15.9 mm Type X East X X X X X X - X - X - X - X TWS 03 12.7 mm Regular West - - X X X - X - X - - - - -
TWS 04 15.9 mm Type X West - - X X X - X - X - - - - -
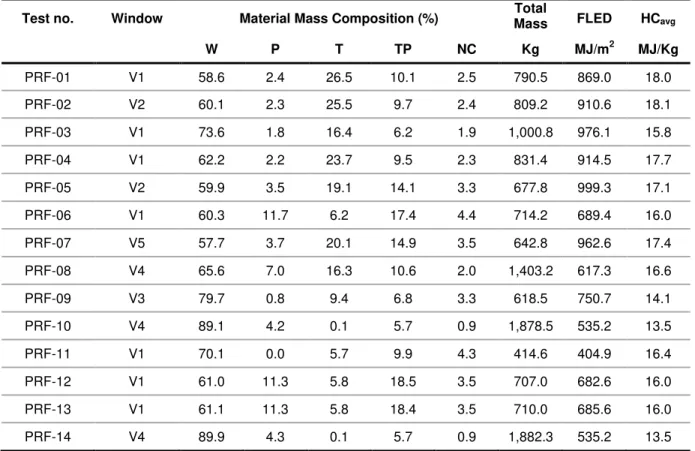
Details of the fuel load, such as total mass, estimated FLED and material composition, are given in Table 6. Where applicable, calorific values measured in Phase 1 of the project [2] were used to calculate the FLED. Fuel load quantities included combustible structural elements (such as, OSB sub-floor and wood framing for test wall sections) that were expected to be involved in the fire.
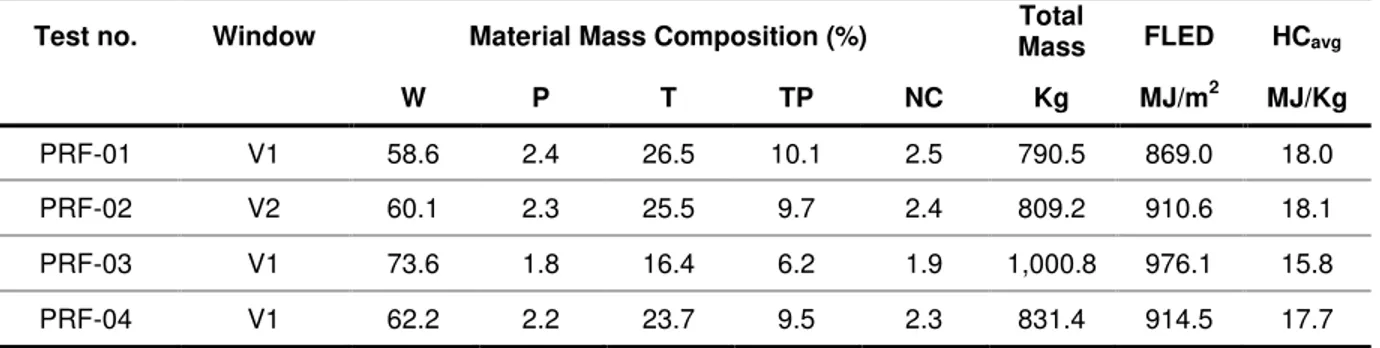
Table 6. Quantity and composition of the design fuel load used in the tests.
Test no. Window Material Mass Composition (%) Total Mass FLED HCavg
W P T TP NC Kg MJ/m2 MJ/Kg PRF-01 V1 58.6 2.4 26.5 10.1 2.5 790.5 869.0 18.0 PRF-02 V2 60.1 2.3 25.5 9.7 2.4 809.2 910.6 18.1 PRF-03 V1 73.6 1.8 16.4 6.2 1.9 1,000.8 976.1 15.8 PRF-04 V1 62.2 2.2 23.7 9.5 2.3 831.4 914.5 17.7 PRF-05 V2 59.9 3.5 19.1 14.1 3.3 677.8 999.3 17.1 PRF-06 V1 60.3 11.7 6.2 17.4 4.4 714.2 689.4 16.0 PRF-07 V5 57.7 3.7 20.1 14.9 3.5 642.8 962.6 17.4 PRF-08 V4 65.6 7.0 16.3 10.6 2.0 1,403.2 617.3 16.6 PRF-09 V3 79.7 0.8 9.4 6.8 3.3 618.5 750.7 14.1 PRF-10 V4 89.1 4.2 0.1 5.7 0.9 1,878.5 535.2 13.5 PRF-11 V1 70.1 0.0 5.7 9.9 4.3 414.6 404.9 16.4 PRF-12 V1 61.0 11.3 5.8 18.5 3.5 707.0 682.6 16.0 PRF-13 V1 61.1 11.3 5.8 18.4 3.5 710.0 685.6 16.0 PRF-14 V4 89.9 4.3 0.1 5.7 0.9 1,882.3 535.2 13.5
FLED: Fuel load density; W: Wood P: Paper; T: Textiles; TP: Thermo-plastics; NC: Non-combustible, e.g. Metal; HCavg: Mean theoretical heat of combustion.
The fire was initiated on the first-ignited-item using the appropriate ignition method given in Table 7. The first-ignited-item and ignition sources were selected in Phase 1 of the project [2].The planned duration of each test was 1 hour.
Table 7. Ignition sources used in the tests. First ignited
item
Tests (PRF no.)
Ignition source Strength Reference Standard
Bed assembly 01, 02, 03, 04, 05, 07, 09, 08
T-burner 9 kW (6.6 L/min) for 50s positioned 0.47 m from the head-side
Developed in Phase 1 [2].
Two-seat sofa (loveseat)
06, 11, 12, 13 Square-burner 19 kW (13.0 L/min) for 80s ASTM 1537 [29] Oil pan simulating
stove-top fire
14 Heated
cooking oil in oval roaster
Approximately 60 kW Ad hoc
It is acknowledged that the ignition sources listed in Table 7 are severe in comparison to realistic igniters such as matches, cigarette lighters and candles, which are often mentioned in many fire
statistics as the major causes of residential fires. However, it is common practice in the fire research community to use ignition sources similar to those listed in Table 7 for the benefit of standardization and repeatability. Weaker ignition sources may affect the time to ignition; however, it is believed that the post-ignition phase, during which the fire becomes self-sustaining, is the most important period in studying fire behavior and hence the reason for selecting stronger ignition sources that ensure ignition. A study on the influence of ignition sources on HRR in a furniture calorimeter [30] compared propane burners with ignition strengths ranging from 1.7 kW to 30 kW and found that the burning behavior of the burning items was similar regardless of the type of burner used. As well, the repeatability was better when a stronger ignition source was used. In that study they considered a HRR of 50 kW to be the fire size that can be detected by persons who are not fully alert or those who are further away from the burning item or a fire detector. Therefore, the period before sustained ignition occurs is considered to be relatively unimportant to the assessment of burning behavior and can be accounted for by appropriately modifying the time to ignition or attainment of the experimental HRR at ignition. The above methods have also been supported by Babrauskas and Peacock [31] who stated that although fire deaths are mainly caused by the inhalation of toxic gases, HRR was still the best indicator of fire hazard and that the relative toxicity of combustion gases, and delays in the ignition time as measured by small flame tests, had been shown to have a minor effect on the fire severity.
4
Results and Analysis
Apart from the HRR vs. time graphs that are provided in Appendix A, none of the data discussed in this report were smoothed. The use of smoothing techniques, such as running time averages was considered, but was not pursued since there is a possibility of damping out some real features.
4.1 Summary of Quantitative Results
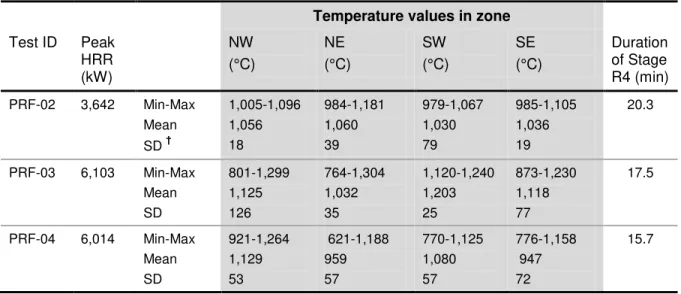
Table 8 summarizes the test results: HRR, total heat released, mean maximum hot layer
temperatures and peak heat flux. Five tests (PRF-01, -05, -10, -13 and -14) were terminated early due to safety concerns caused by temperatures in the roof joist space exceeding 300°C. The graphical results for all of the measurement points in each test are given in Appendix C
(Figures C-1 to C-334) in Part 1 of the report [1]. In Table 8, the mean maximum temperature ( ̅ ) is defined as the mean of the temperatures measured at a location in the hot layer that is calculated over the duration of the post flashover phase (stage R4, which is defined later in the report). The mean maximum temperature is calculated either for a zone in a single quadrant of the room or for the entire room (four zones associated with the four quadrants of the room).
In 12 of the tests (excluding Test PRF-11, which had an active sprinkler system installed), where the first-ignited-item was a PCF (either a bed assembly or a sofa), the fires developed rapidly and flashover (full room involvement) occurred within five minutes of ignition.
Table 8. Summary of the test results.
Test ID Peak HRR
THR ̅
q
mfq
mwc Test Date TestDuration (kW) (MJ) (°C) (kW/m2) (kW/m2) (°C) (min) PRF-01 6,752 (232)† 9,912 1,061 288 315 25.0 24-Jun-2009 42 PRF-02 3,642 (262) 8,650 1,060 89 279 6.6 27-Oct-2009 64 PRF-03 6,103 (303) 9,821 1,202 251 285 -15.0 4-Feb-2010 63 PRF-04 6,014 (239) 10,225 1,129 189 298 -1.0 3-Mar-2010 61 PRF-05 3,782 (928) 7,136 1,140 262 239 19.1 31-May-2010 56 PRF-06 5,133 (255) 8,214 1,119 239 276 20.0 20-Jul-2010 60 PRF-07 4,134 (636) 7,219 1,142 X ††† 293 12.5 13-Oct-2010 64 PRF-08 9,230 (1,212) 14,460 1,118 203 276 -14.0 14-Dec-2010 61 PRF-09 2,793 (841) 5,911 1,039 200 295 -6.0 23-Feb-2011 60 PRF-10 8,776 (1,241) 16,660 1,163 236 270 20.0 11-May-2011 45 PRF-11 110 (47) 28 117 †† X 4.4 21.0 22-June-2011 30 PRF-12 5,084 (515) 8,402 1,066 179 261 24.0 13-Sept-2011 64 PRF-13 5,474 (546) 7,750 1,084 X 280 13.0 9-Nov-2011 44 PRF-14 9,090 (1,337) 12,725 1,036 224. 266 -3.0 14-Feb-2012 40
̅ – Mean maximum hot layer temperature (of four zones) in stage R4 of the fully-developed phase;
q
mf – Maximumheat flux at floor level;
q
mwc – Maximum heat flux on the walls and ceiling; THR – Total heat release.†Time to reach the peak HRR (s); †† Measured at a single point; ††† Data acquisition or instrument failure.
In one other test, PRF-14, the first-ignited-item was a kitchen cabinet that was ignited by a simulated stove-top ignition source (an oval roaster containing two litres of cooking oil). This resulted in a slower rate of fire growth (since the wooden cabinets did not ignite and spread flames
readily, which is typical of wood-based furnishings). In Test PRF-14, flashover of the entire space was not observed until about 13 minutes after ignition.
In Test PRF-11, the ceiling-mounted sprinkler activated at 45 s after ignition and was very effective in preventing further fire growth; the HRR did not exceed 110 kW and the maximum temperature recorded at a single point in the room was only 117°C.
4.2 Qualitative Results (Dynamics of Fire Development)
The pictorial sequences of fire progression (from ignition to extinguishment) for each test are provided in Appendix D in Part 1 of the report [1]. Photographs are given at one-minute intervals for the first 14 min of each test and at three-minute intervals for the remaining duration. Photographs showing the aftermath of the tests are given in Appendix D in Part 1 of the report [1].
Due to the complexity of the test series and the voluminous data generated, analysis of the data and formulation of technical opinions of fire development was an ongoing process. In this report, the opinions are presented as a new understanding of fire development ahead of the discussion of test data since it is considered important in the overall analysis of the quantitative results presented in Section 4.3: “Quantitative Results and Analysis”.
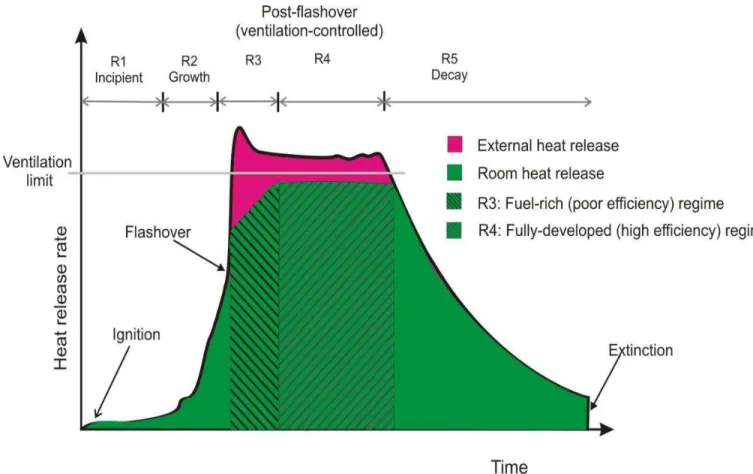
4.2.1 Novel Understanding
While the conventional portrayal of fire development (Figure 1; discussed in Section 2.1) is true to a certain extent, the opinion (from observations, data analysis and literature reviews) developed in this research is that the ventilation-controlled phase was actually composed of two distinct phases: a transitional “unsteady” phase (R3) and a conventional “steady” phase (R4), which are depicted in Figure 4. The unsteady phase occurs immediately after the flashover. The duration of Stage R3 was determined based on a combination of:
1. The magnitude of the HRR with respect to the theoretical ventilation-controlled HRR value (HRRv): The measured HRR significantly exceeded the HRRv during Stage R3. 2. Visual observations from test videos: In Stage R3, the room environment appeared to be a sporadic mosaic of bright orange and dark turbulent flames and dense smoke that extended out into the exhaust duct.
3. Temperature gradient: During Stage R3, the measured hot layer temperatures typically increases from the values in the range of 500 – 700°C at flashover to values above 1,000°C, which results in a steep temperature gradient during this period. The end of Stage R3 was determined by a qualitative examination of temperature gradient of the temperature vs. time graphs, i.e. there was a discernible change in the temperature
gradient (from steep to gradual or flat) that was collaborated with features of the HRR profile and video observations.
The end of Stage R4 (beginning of the decay phase) was taken to be the time when the HRR begun to consistently decline below the HRRv value. Based on this approach, the results show that the standard deviation of the mean hot layer temperature (measured with TCs located at either 1.4 m or 2.4 m height) in Stage R4 was generally less than 100°C.
Theoretically, combustion efficiency could be another distinguishing feature for Stage R3 since it is assumed that poor combustion inefficiency due to excessive supply of fuel volatiles contributes to a decrease in the fire temperature. However, since there was no means if measuring combustion efficiency directly, it was inferred from a visual assessment of the colour of the flames, i.e. dark flames are indicative of poor combustion efficiency in the tests. An additional reason for the lower temperatures in Stage R3, than those in Stage R4, is likely due to heat losses from the fire gases to the room boundaries (walls and ceiling), which are at a lower temperature. Therefore, this research identifies five distinct stages of fire development, which are depicted in Figure 4 as R1 to R5, and the conventional portrayal (shown in Figure 1) becomes a special case of the new portrayal (Figure 4), in which there is no unsteady phase. All of the discussion of fire development in this report will be referenced to this new understanding of fire development.
For the fuel loads used in the tests, this research hypothesises that following the flashover there was an excessive liberation of fuel volatiles (likely due to the pyrolysis of thermoplastic fuels) from the surfaces of exposed combustibles upon their exposure to sufficiently high radiant heat flux (caused by hot layer temperatures higher than 500°C). This resulted in a fuel-rich combustion atmosphere, since there was insufficient oxygen (i.e. less than the stoichiometric requirement) for efficient combustion to occur. Hence, Stage R3 is thought to undergo inefficient (unsteady) combustion and a large amount of un-burnt fuel volatiles left the fire room and ignited (completed burning) outside where fresh air with sufficient oxygen was entrained into the exhaust stream. Increased production of fuel volatiles and external combustion resulted in the peak HRR occurring immediately after the flashover and its magnitude was significantly greater than the ventilation-controlled HRR value. The duration of Stage R3 is considered to depend on factors such as window size, heat losses to the room boundaries (room size) and the quantity and composition of the fuel load (particularly the thermoplastic content), as will be shown later in this report.
Stage R4 was considered to have occurred when most of the excess fuel volatiles from
thermoplastic combustibles had been consumed and the ventilation-regulated pyrolysis of wood-based combustibles (the majority of the fuel load) predominated. At this stage, the fuel/air ratio likely approached stoichiometric conditions and the flames inside the room and those flowing out of the window opening were characterized by an increasingly orange colour punctuated by sporadic
streaks of dark smoke. External combustion is also believed to occur in Stage R4, to a lesser extent, and it is known that actual heat release in the room can be less than the theoretical
maximum (ventilation-controlled) value supported by the available window [20], i.e. less than 100% combustion efficiency.
The combustion behaviour described in Stage R3 has long been known and documented in the literature; however, the novelty alluded to here lies in this research’s emphasis on the importance of Stage R3 as a distinct phase that has a significant effect on initial post-flashover temperatures and, consequently, the destructive impact of a fire, as will be shown when room temperature data are discussed.
Figure 4. Novel division of stages of fire development based on CFMRD test results.
4.2.2 Characteristics of Fire Development
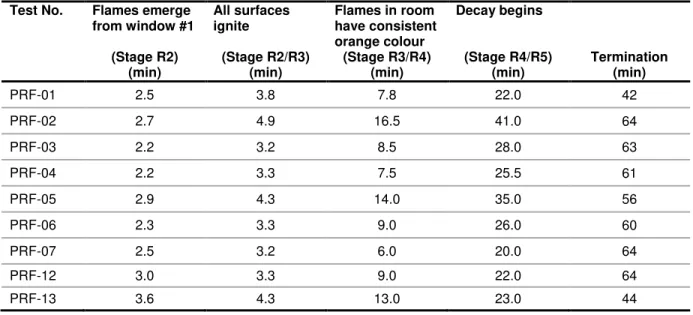
Except for Test PRF-14 (stove-top ignition source), all tests in this research had practically no incipient phase; fire growth (stage R2) began immediately since, by design, the strong ignition sources guaranteed rapid ignition of the first-ignited-item.
4.2.2.1 Observations of Key Features of Fire Behaviour
All of the observations presented here describe features of the fires that could be seen from outside the fire room through the windows and, therefore, may not be true for areas located further inside the room that were not visible from that vantage point due to smoke obscuration. Two important observations were made:
1. Transition to flashover: There were two patterns of fire development depending on the size of the fire room, whether small- to medium-sized (floor area not more than 16 m2, with a single window) or large-sized (floor area greater than 16 m2 with two windows). These were characterized by the type of transition to flashover, whether it was complete or partial, as observed from outside the fire room:
a) Single flashover:
Occurred in tests conducted in small- and medium-sized rooms (configurations B1, B2, B3 and B4);
Conformed to the norm that radiant heat from a hot upper layer causes flashover to occur in the entire room when hot layer temperatures and floor-level heat flux thresholds of about 600°C and 20 kW/m2 [3, 17], respectively, are attained. b) Multiple flashovers:
Occurred in large rooms (configurations B5 and B6);
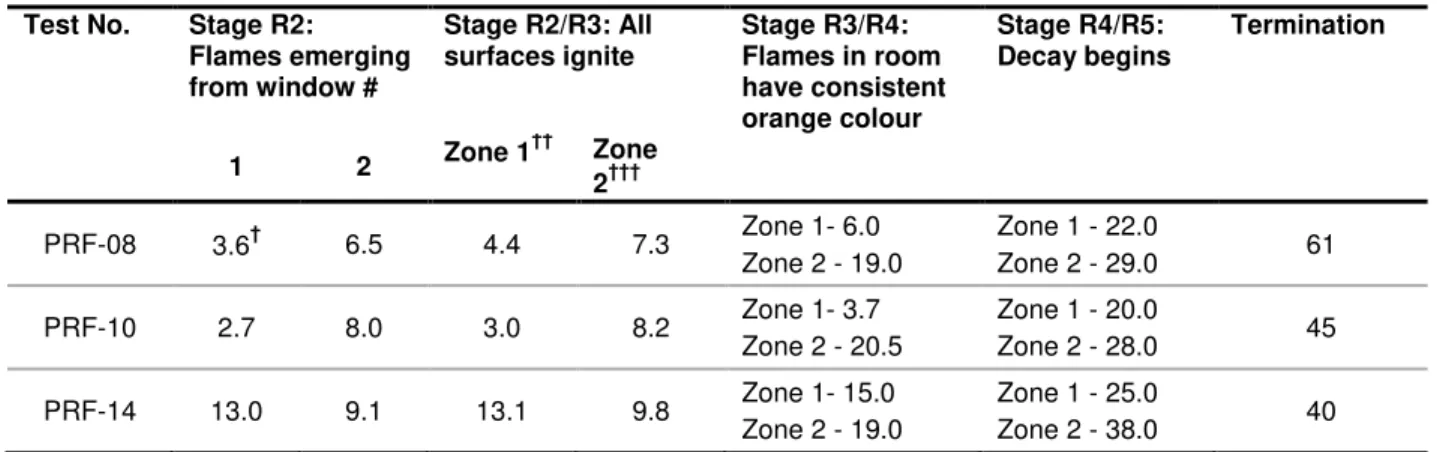
Did not conform to the pattern of single flashover; the room appeared to be split in two halves (zones), with flashover first occurring in the zone containing the first-ignited item (Zone 1 in Figure 5) followed by the distant zone (Zone 2 in Figure 6), after a noticeable time delay.
Figure 5. Multiple flashover case (Test PRF-10): Flashover in Zone 1.
Figure 6. Multiple flashover case (Test PRF-10): Flashover in Zone 2.
2. Zonal burning phenomenon: Tests that experienced multiple flashovers showed complex
![Figure 3. Time-Temperature Curves for Different Ventilation Factors and Fuel loads [27]](https://thumb-eu.123doks.com/thumbv2/123doknet/14097270.465232/24.918.145.804.116.630/figure-time-temperature-curves-different-ventilation-factors-fuel.webp)
![Figure 43 shows the average heat flux and temperature measured in a full-scale wall furnace [33]](https://thumb-eu.123doks.com/thumbv2/123doknet/14097270.465232/55.918.181.769.604.984/figure-shows-average-heat-temperature-measured-scale-furnace.webp)
