HAL Id: hal-01609115
https://hal.archives-ouvertes.fr/hal-01609115
Submitted on 25 Oct 2018
HAL is a multi-disciplinary open access
archive for the deposit and dissemination of
sci-entific research documents, whether they are
pub-lished or not. The documents may come from
teaching and research institutions in France or
abroad, or from public or private research centers.
L’archive ouverte pluridisciplinaire HAL, est
destinée au dépôt et à la diffusion de documents
scientifiques de niveau recherche, publiés ou non,
émanant des établissements d’enseignement et de
recherche français ou étrangers, des laboratoires
publics ou privés.
Cure kinetics of a polysilazane system: Experimental
characterization and numerical modelling
Raffaele d’Elia, Gilles Dusserre, Sylvie del Confetto, Nicolas Eberling-Fux,
Cedric Descarnps, Thierry Cutard
To cite this version:
Raffaele d’Elia, Gilles Dusserre, Sylvie del Confetto, Nicolas Eberling-Fux, Cedric Descarnps, et al..
Cure kinetics of a polysilazane system: Experimental characterization and numerical modelling.
Euro-pean Polymer Journal, Elsevier, 2016, 76, p. 40-52. �10.1016/j.eurpolymj.2016.01.025�. �hal-01609115�
Cure kinetics of a polysilazane system: Experimental
characterization and numerical modelling
Raffaele D’Elia
a, Gilles Dusserre
a,⇑, Sylvie Del Confetto
b, Nicolas Eberling-Fux
c,
Cédric Descamps
c, Thierry Cutard
aaUniversité de Toulouse, CNRS, Mines Albi, INSA, UPS, ISAE-SUPAERO, ICA (Institut Clément Ader), Campus Jarlard, F-81013 Albi, France bUniversité de Toulouse, CNRS, Mines Albi, Centre RAPSODEE – UMR CNRS 5302;Campus Jarlard, F-81013 Albi, France
cSAFRAN-Herakles, Matériaux et Procédés CMC, CMB, France
Keywords: Polysilazane Ceramic precursor Gel point analysis Cure kinetics
Phenomenological model TTT diagrams
a b s t r a c t
The Time–Temperature–Transformation (TTT) isothermal diagram is plotted for a polysilazane system, composed of the KiON!Ceraset!Polysilazane 20 resin, with
addi-tion of 1 wt% of dicumyl peroxide acting as cross-linking catalyst. This diagram is useful to control the resin transfer moulding (RTM) process involved to obtain a composite material from a ceramic fibrous preform. The system under study is a precursor for the ceramic matrix, obtained after pyrolysis of the polymerized resin. The knowledge of the composite properties at the polymerized state is necessary to fully control this process. The cure kinetics of this system is investigated under both isothermal and dynamic curing conditions by Differential Scanning Calorimetry (DSC). The kinetics of the reaction is satisfactorily described by a Kamal and Sourour (K–S) phenomenological model. The K–S parameters are identified from isothermal data, taking into account an initial degree of cure, assuming a fully cured system at the end of the isothermal idle time. The model is in good agreement with both dynamic and isothermal experimental data. The glass transition temperature (Tg) is determined by DSC analyses as a function
of the degree of polymerization and confirmed by Dynamic Mechanical Analysis (DMA), and the results are modelled by Di Benedetto’s formula. The change of visco-elastic properties is investigated using oscillatory rheology under isothermal conditions. The cure kinetics model allows a gelation criterion to be identified by plotting the shear loss modulus G00vs. the degree of cure.
1. Introduction
In the last decades, the need of increasing operating temperatures and combustion efficiency of turbofan engines has led to study new ceramic materials for high-pressure turbine blades or combustor components, to improve thermo-mechanical and thermo-chemical properties. Ceramic Matrix Composites (CMC’s) constitute a family of ceramic materials which com-bines high specific strength, high temperature resistance as well as damage tolerant behaviour. Several techniques are used to process CMC’s, such as gas phase processing routes, ceramic processing routes and liquid phase processing routes. Among
⇑Corresponding author.
the latters, Polymer Impregnation and Pyrolysis (PIP) is a standard method to obtain carbon–carbon ceramic materials, but it is also applicable to SiC-based ceramics, with a dense and high purity b-SiC. This technique is composed of two steps: the injection of a polymer precursor in a fibrous preform and the ceramization of the composite through the pyrolysis of the precursors. Both phases are very important to optimize the process and obtain a final product with the highest density, together with avoiding process induced cracks.
Polyorganosilazanes are a family of precursors, used to prepare silicon carbo-nitrides (SixCyNz) and related materials. They
were introduced for the first time in 1885[1], but were proposed only in the 1950s and 1960s as possible precursors for ceramic materials[2,3]. The growing interest in this class of materials arises from their application as silylating agents in synthetic chemistry and as single-source precursor for the preparation of ceramic materials[4]. The ceramic yield strongly depends on the molecular weight of the precursor. For this reason several authors at the turn of the 1980s and 1990s[5–10]
worked on the modification of the silazane oligomers into non-volatile precursors, in order to increase the molecular weight of the polymer and to enhance the degree of cross-linking.
An interesting advantage of polysilazanes (and of all polymer precursors) is the possibility of using several forming methods, including polymer processing techniques, often more efficient than ceramic powders or pastes processing techniques. It is then possible to machine the polymer before ceramization, reducing the risk of a brittle fracture of the component. All plastic forming technologies are applicable to these precursors, like RTM, extrusion, injection moulding, etc.
Although several authors worked on the mechanical and physical characterization of polysilazane-derived ceramics
[11–14], a significant lack of studies on the injection process of the precursor is observed. Viscosity evolution is directly driven by the polymerization of the system, influencing the choice of pressure, temperature and controlling the pot-life of the precursor. For this reason the characterization of polysilazane cross-linking is extremely important to improve material processing. This class of precursors is generally cured to solid at 100–250"C[15,16]by simple heating, although cross-linking is also possible via UV curing method[17,18]. Lower curing temperatures are possible after addition of a radical initiator, which could be organic peroxide. Several authors used in particular dicumyl peroxide (DCPO)[16,19– 22], with concentration ranging from 0.01 to 5 wt% of the polymer [23–25].
The ceramic precursor used in this study is the KiON! Ceraset! Polysilazane 20 (PSZ20), produced by Clariant!. The
shelf-life for this polymer, stored in a dark, cool (4"C) and dry place is 6 months[15]. The polymer is a pale yellow liquid. The density is 1–1.1 g/cm3, with a viscosity of 180–750 mPa ! s (20 "C). It can be converted into an amorphous Si/C/N
mate-rial by pyrolysis at around 1000"C. At higher temperatures (>1400 "C) the material crystallizes to form a nanocomposite of SiC/Si3N4/C, which can be stable up to 1800"C[15]. The molecular structure of this polymer is characterized by an
alter-nated SiAN backbone with methyl CH3("80%) and vinyl CH@CH2 ("20%) side groups (Fig. 1). Given this network the
PSZ20 is also referred to as polymethylvinylsilazane.
Polysilazane cross-linking involves several chemical reactions, which are generally started by heating, because of a better control of the material curing and ceramic microstructure after pyrolysis. Reaction efficiency depends upon the reactive groups concentration: vinyl groups (ACH@CH2), SiAH, NAH are the principal groups that participate to the cross-linking
of PSZ20. The possible reactions involved in the reticulation of this system are: 1. Vinyl group polyaddition:
2. Methyl/Vinyl radical reaction:
3. Hydrosilylation:
5. Dehydrogenation (SiAH with NAH):
6. Transamination:
ðAÞ
ðBÞ
Lavedrine et al.[26]identified the reaction sequence at 120"C for this system as follows: hydrosilylation > dehydrogena-tion (SiAH/NAH) " transaminadehydrogena-tion > vinyl group polyaddidehydrogena-tion " dehydrogenadehydrogena-tion (SiAH).
Methyl/vinyl radical reactions take place between 200 and 300"C [27] and will not be considered in this work. The polyaddition of vinyl groups can be activated at lower temperature by the addition of a free radical generator as the DCPO. According to the literature[12,28], this reaction takes place at temperatures between 90 and 130"C for a polymethylvinyl-silazane resin with addition of 0.1 wt% of DCPO. After addition of 1 wt% of DCPO, vinyl polyaddition is promoted to the detri-ment of dehydrogenation.
Several authors have studied ceramic materials obtained using this family of polymers, characterizing their microstruc-tures and mechanical and physical properties[11–13,29]. However, before the pyrolysis, a preform of SiC-based ceramic fibers is impregnated by the polymer precursor, using RTM (Resin Transfer Moulding). During this phase, cure kinetics of precursor is fundamental, because of the need to completely fill the preform to obtain the highest material density and best mechanical properties. Time–Temperature–Transformation (TTT) isothermal diagram is a widely used tool to compute RTM parameters as temperature and pressure of injection. This paper will focus on the cure kinetics of PSZ20 precursor, to finally plot the TTT diagram of the system.
2. Experimental
The polysilazane precursor (PSZ20 – Clariant!) and the dicumyl peroxide (C
18H22O2, 270.37 g/mol - Sigma Aldrich!) are
stored in a dry, dark and cool (4"C) place before use. Samples are prepared by mixing PSZ20 with 1 wt% of dicumyl peroxide using a magnetic stirrer up to the complete dissolution of the peroxide. This operation takes 1 h at 293 K (20"C). At the end of this process, the compound presents a great amount of bubbles, generated by the mixing. Bubbles could affect DSC or rhe-ology test results: for this reason the compound is kept at 277 K (4"C) during 12 h at least before the test. At the end of this procedure, the material is ready to be studied using different techniques. The study of the cure kinetics of the system is per-formed using a Differential Scanning Calorimetry. A DSC-Q200 of TA Instruments is used to measure the total heat of poly-merization (DHtot) for different heating rates, the glass transition temperature (Tg) after several interrupted isothermal cures,
and the residual heat of reaction (DHres).
The initial heating rate (from 293 K to Tcuring) of isothermal cure is chosen to reduce temperature overshoot of the sample.
The initial mass of the samples, placed in a non-hermetic crucible, ranges between 10 and 20 mg and the tests are performed under continuous N2flow (50 ml/min). Isothermal curing is carried out at four different temperatures ranging from 363 K
(90"C) to 393 K (120 "C) and with a curing time ranging from 5 min to 48 h. After isothermal curing, the samples are quenched from Tcuringto 183 K (%90 "C) at a rate of 200 K/min. After 20 min at 183 K, necessary to stabilize the modulation
conditions, a modulated DSC scan is performed at 2 K/min, with period of 40 s and amplitude of 0.8 K, from 183 K (%90 "C) to
CH3 Si N H 0.20 CH3 Si N H S 0.80 H CH=CH2
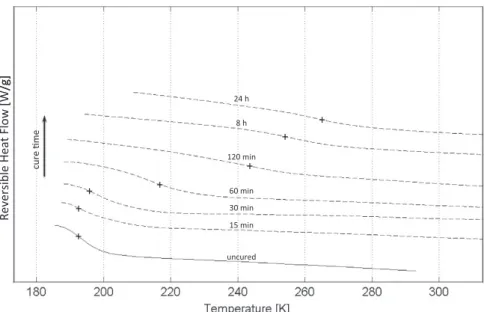
573 K (300"C). These conditions are chosen in order to obtain the glass transition temperature of the system (Fig. 2), defined as the midpoint of the step transition on the reversible signal of heat flow. Modulation was necessary due to the low ampli-tude of these step transitions. The residual heat of reaction (Fig. 3) is calculated as the time integral of the residual peak of the overall heat flow.
Isothermal cure kinetics is necessary to identify two important transformations of the material: the vitrification point and the gelation point. Vitrification takes place when the glass transition temperature attains the test temperature, with the material that passes from a rubbery state to a vitreous state. Gelation occurs when the network built by cross-linking becomes continuous and occupies all the volume. At this point a lot of chains are still free of bonding, and the material is considered in a gel state[30]. Gelation will be characterized using a rheometer HAAKE MARS of ThermoScientific, under oscillatory rheology conditions and using a plane/plane configuration. These tests were performed under isothermal condi-tions at four different temperatures (363 K, 373 K, 383 K, 393 K) with a frequency of 1 Hz.
3. Results and discussion 3.1. Heat of polymerization
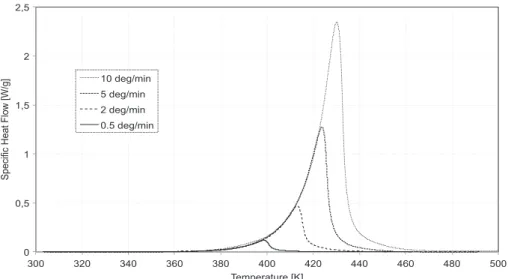
The total heat of polymerization (DHtot) was measured during several anisothermal scans, performed at 0.5 K/min,
2 K/min, 5 K/min and 10 K/min from 293 K to 473 K. The results of these tests are shown inFig. 4.
Fig. 2. DSC scans between 183 K (%90 "C) and 293 K (20 "C) after different isothermal cure at 383 K (110 "C): glass transition temperature of the system (Reversible Heat Flow). The symbol + shows the Tglocation at each cure time.
DHtotrepresents the specific heat generated during the exothermal reaction of polymerization per one gram of solution. It
is calculated as the integral of the specific heat flow ( _H) with respect to the time of reaction (Eq.(1)), and the mean value obtained for this system is 228.5 (±6.1) J/g.
DHtot¼
Z tf
0 _Hdt ð1Þ
3.2. Glass transition temperature
The glass transition temperature (Tg) and the residual heat of reaction (DHres) after several idle times at several
temper-atures are determined from interrupted isothermal tests, in order to identify a Di Benedetto’s formula. The degree of cure corresponding to each Tgvalue is then computed with the following formula:
a
¼ 1 %DDHHrestot ð2Þ
The Tgvalue can be related to the degree of cure using the Di Benedetto’s equation[31]:
Tg¼ Tgoþ ðTg1% TgoÞ !1 % ð1 % kÞ
a
ka
k ¼FFx
m
ð3Þ
where Tg0and Tg1are respectively the glass transition temperatures for uncrosslinked (
a
= 0) and fully crosslinked polymer(
a
= 1), Fmand Fxare the segmental mobility of the corresponding physical states.According to Pascault and Williams[32], and following the Couchman entropy based approach to mixtures, the k param-eter in Di Benedetto’s equation can also be defined as the ratio between the change in the isobaric heat capacities through the glass transition for a fully cured system (DCp1) and for an uncured system (DCp0):
k ¼DDCCp1
p0 ð4Þ
The experimental observation stating that the product DCp! Tgis approximately constant[33]was checked to apply to
PSZ20. In the present study the mean value of DCp! Tgis 55.9 (±7.6) J/g. The slope of a linear regression of a DCp! Tgversus
alpha plot is 3.8 J/g (6.8% of the mean value), which confirms the hypothesis of constancy of the product DCp! Tg. According
to these considerations, Di Benedetto’s equation reduces to a mixing law for the change in isobaric heat capacity through the glass transition:
DCp¼DCp0þ
a
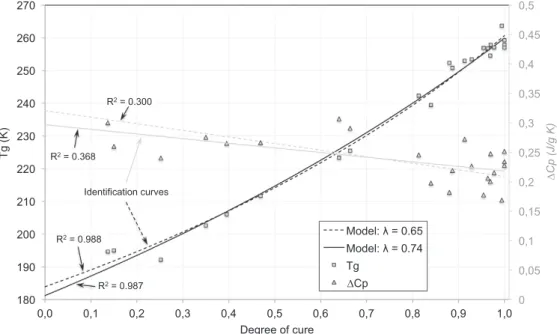
ðDCp1%DCp0Þ ð5ÞThis equation can be used to evaluate DCp0and DCp1from the experimental plot of DCpas a function of the degree of cure
even if both values are not very accurately measured directly, and then calculate the parameter k from Eq.(4)(Fig. 5). This method leads to a value of k of 0.74 (DCp0= 0.297 J ! g%1K%1and DCp1= 0.220 J ! g%1K%1) and a determination coefficient R2of
0 0,5 1 1,5 2 2,5 300 320 340 360 380 400 420 440 460 480 500 Specific Heat Flow [W/g] Temperature [K] 10 deg/min 5 deg/min 2 deg/min 0.5 deg/min
0.368 (Fig. 5). The strong dispersion in the DCp experimental data leads to consider a second method of identification, in
order to confirm the Pascault–Williams (P–W) method. For this reason, a linearization of Eq.(3)has been operated, to obtain the best fitting results, through a multiple linear regression analysis:
Tg¼ A þ B ! X ð6Þ
with A = Tgo, B = (Tg1% Tgo) and X ¼1%ð1%kÞak a. It is possible to plot this straight line for different values of k: the value giving the
best determination coefficient R2will represent the best fitting of the Di Benedetto’s formula for this system. The k giving the
best fit is 0.65 (R2= 0.988), although the residual remains roughly constant for k ranging between 0.6 and 0.75. However a
value of 0.65 significantly reduces the determination coefficient for the DCpcurve (from 0.368 to 0.300,Fig. 5). For this
rea-son the k obtained with the P–W method is finally considered as the most relevant value.
The following parameters are obtained using a k of 0.74: Tg0= 181.2 K, Tg1= 259.9 K, with the corresponding Di
Benedet-to’s plot presented inFig. 5. This result represents the optimum according to the linearization analysis and to the physical meaning of the parameter k described by Pascault and Williams[32].
To confirm the value of Tg1, a DMA (Dynamical Mechanical Analysis) 8000 of Perkin Elmer, under continuous N2flow has
been used on composite samples cured at 393 K (120"C) during 2, 12 or 18 h. The degree of cure is expected to be 1 in these conditions. The size of the samples used for DMA is 4 ( 4 ( 50 mm3. Fibers have been included in the polymer in order to
unmould the samples from the silicone mould used to cast the liquid polymer before curing. The use of composite material was necessary, since it was not possible to easily obtain samples made only with the catalyzed polymer. Fibers in composite do not affect the mechanical manifestation of the glass transition, which depends only on the matrix. For this system Tgis
found to match the onset point of the storage modulus decrease. An average onset temperature of 263 K is obtained, which corroborates the Tg1value obtained using DSC analyses (259.9 K).
3.3. Cure kinetics modelling
Isothermal DSC curves are used to identify the parameters of a phenomenological Kamal–Sourour model, Eq.(7). This approach is chosen to be representative of the isothermal conditions of injection of the polymer precursor, during RTM processing.
d
a
dt ¼ ðk1þ k2
a
mÞ 1 %ða
Þn ð7Þ This model assumes two rate constants[34], k1and k2, Eq.(8), which follow an Arrhenius dependence to temperature.kiðTÞ ¼ koiexp %RTEai
! "
i ¼ 1; 2 ð8Þ
mand n are the reaction orders. Several authors used this law to model epoxy resins polymerization[35–37]or silicone rub-ber vulcanization[38], because of the autocatalytic and catalytic nature of the reactions driving the crosslinking of these sys-tems and conferring a general purpose to this phenomenological model. Some authors[36,37]coupled a diffusion term to
0 0,05 0,1 0,15 0,2 0,25 0,3 0,35 0,4 0,45 0,5 180 190 200 210 220 230 240 250 260 270 0,0 0,1 0,2 0,3 0,4 0,5 0,6 0,7 0,8 0,9 1,0 ∆Cp (J/g K) Tg (K) Degree of cure Model: λ = 0.65 Model: λ = 0.74 Tg ∆Cp R2 = 0.300 R2 = 0.368 R2 = 0.988 R2 = 0.987 Identification curves
the Kamal–Sourour model, in order to take into account the reaction rate decrease at vitrification, when Tgattains the testing
temperature. However, maximal glass transition temperature, Tg1, of the system under study is 259.9 K (%13.1 "C), which is
far lower than the isothermal curing temperatures used in this paper and more generally while composite processing. For this reason, the diffusion-controlled mechanism will not be considered to model the material behaviour.
Before isothermal curing, the material undergoes a heating ramp, which is chosen in order to reduce temperature over-shoot at the beginning of the isothermal dwell. This step is generally neglected in the processing of DSC isothermal data, but it results in an initial degree of cure of the system
a
(t0), which is not negligible in our experiments. This approximationwould imply an error on the parameters of the model, reducing its accuracy. In this paper an initial degree of cure is con-sidered, in order to take into account the reaction advancement during the initial heating rate of the sample. This is made using the hypothesis that the reaction advancement is complete at the end of the isothermal curing, which leads to Eq.(9).
a
ðt0Þ ¼a
0¼ 1 %Rtf
t0Hdt_
Htot ð9Þ
_
His the specific heat flow generated during isothermal curing, t0is the time necessary to reach the isothermal conditions, tfis
the final time of the test.
The parameters of the Kamal–Sourour model were identified on the isothermal curves, using a Nelder-Mead simplex direct search[39,40], through the MatLab!subroutine fminsearch. The objective function of this unconstrained multivariable
optimization is the normalized difference between the numerical solution and the experimental data. The optimized set of parameters is reported inTable 1.
As shown inFig. 6, both rate constants, k1and k2, follow almost perfectly an Arrhenius trend, with correlation coefficients
R2higher than 0.999.
From the fitting line equation, it is possible to obtain the activation energies (the slope of the line is %Ea/R, with
R= 8.3144 J mol%1K%1) and the pre-exponential factor (intercept of the line) of the rate constants. At contrary, the reaction
orders n and m, doesn’t exhibit any significant temperature trend, and the mean values are taken to obtain a global mod-elling of the system. The parameters of the global Kamal–Sourour model are summarized inTable 2.
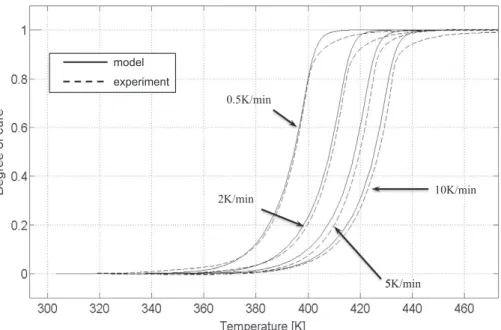
For validation purpose, the identified Kamal–Sourour model is compared to experimental data in both isothermal and dynamic conditions, using either the specific heat flow _H or the degree of cure
a
. The results are plotted inFigs. 7–9, where the discontinuous lines represent the experimental data and the continuous lines represent Kamal–Sourour model results. The identified model is in very good agreement with both isothermal (gap < 4%) and dynamic (gap < 6%) experiments, irrespective of the test conditions. In isothermal conditions it is possible to notice the influence of the initial degree of curea
0, used to correct the error introduced by the initial heating ramp of the sample, which makes starting the curves at a valuehigher than zero (Fig. 7). The dynamic tests (Figs. 8 and 9) are also in good agreement with modelling, although the model attains the total conversion faster than experimental data for all the heating rates (0.5, 2, 5 and 10 K/min). The mismatch between experience and model increases starting from a degree of cure of 0.9. This discrepancy possibly results from several factors. Among them, the hypothesis of a complete conversion at the end of the isothermal experiments is probably not fully valid. More probably, the reaction mechanism, including a first step of dicumyl peroxide degradation, followed by the polysi-lazane resin polymerization, is too complex to be perfectly described by a Kamal–Sourour model. A better description of the whole kinetics would necessitate studying separately the two mechanisms by carrying out a coupled approach, involving an identification of the polymerization parameters once the degradation has been described with another phenomenological model. A larger amount of work would be necessary to build a mechanistic approach, since the degradation of dicumyl peroxide, alone, involves about 50 reactions[41].
Although the trend of the model does not properly match the experiment at the end of cure (for
a
> 0.9), this does not prevent to use the model for a large range of degree of cure, to simulate the gelation of the system, and for the highest con-version rate, where the reaction mechanism is the fastest. It is therefore considered that the global Kamal–Sourour model identified describes satisfactorily the polymerization kinetics of the system, and in particular in the range where gelation occurs, which is one of the most important feature of a TTT diagram for process control purpose.3.4. Gelation point analysis
During the isothermal curing of the system, the viscosity increases continuously with time, because of the crosslinking of the system. The gelation point is a key process parameter, because it gives some useful information for material processing,
Table 1
Kamal–Sourour parameters for isothermal modelling.
tcuring(h) Tcuring("C) k1(s%1) k2(s%1) m n a0
48 90 1.92 ! 10%5 7.78 ! 10%5 2.56 1.28 0.14
30 100 5.54 ! 10%5 2.96 ! 10%4 2.76 1.34 0.16
24 110 1.60 ! 10%4 9.35 ! 10%4 2.98 1.45 0.19
especially for liquid composites moulding. This parameter is commonly identified from oscillatory rheology tests by using a criterion based on the viscoelastic properties of the fluid, which change with the crosslinking advancement. According to the literature, several criteria are used to define the gelation point of a material: a given viscosity value[42], the criterion of the maximum derivative of the viscosity[35], the G00 inflexion criterion[30], the crossover between the G0 and G00 curves or
between the tan d vs. time curves at different frequencies[43]. To investigate these criteria some time sweep oscillatory tests were performed with a frequency of 1 Hz and a strain amplitude of 1%. During these tests, the following equations hold:
lnk1 = -15111/T + 30.74 R² = 0.9994 lnk2 = -16988/T + 37.37 R² = 0.9995 -12 -11 -10 -9 -8 -7 -6 -5 0,0025 0,00255 0,0026 0,00265 0,0027 0,00275 0,0028 ln (k [s -1]) 1/T [K-1]
Fig. 6. Arrhenius plots of the two rate constants of the system, according to a Kamal–Sourour model.
Table 2
Kamal–Sourour parameters obtained with isothermal identification. ) ko1= 2.24 ! 1013s%1 ) Eo1= 125.64 kJ/mol ) m = 2.71 ) ko2= 1.70 ! 1016s%1 ) Eo2= 141.25 kJ/mol ) n = 1.38 393 K (120°C) 383 K (110°C) 373 K (100°C) 363 K (90°C) 3 model experiment
!
e
ðtÞ ¼e
0eiðxtÞ!
s
ðtÞ ¼s
0eiðxtþdÞ ð10ÞA sinusoidal strain
e
(t), with an amplitude e0and a pulsationx
is applied to the polymer. The tests are performed in aplane/plane configuration. The system will react to this solicitation with a sinusoidal stress
s
(t), with an amplitudes
0andpulsation
x
, shifted of an angle d with regard to the strain. d is the loss angle. The complex shear modulus (G) and the complex viscosity (!g
) can be computed according to Eq.(11), where G0 is the elastic shear modulus (or storage modulus),and G00is the viscous shear modulus (or loss modulus).
Gð
x
Þ ¼s
!!e
ðtÞ ðtÞ¼ G 0ðx
Þ þ iG00ðx
Þ !g
ðx
Þ ¼Gðix
x
Þ ð11Þ 0.5K/min 2K/min 5K/min 10K/min 5 model experimentFig. 8. Dynamic validation of the global Kamal–Sourour model: degree of cure vs. temperature.
0.5K/min 2K/min 5K/min 10K/min model experiment
The cross-point of G0and G00, which is the most commonly used gel point criterion[44,45], was found to occur very early
(for polymerization degree lower than 1%) and did not allow a convincing criterion common to all experiment to be iden-tified. This can be observed inFig. 10, where the plot of G0and G00vs. time for an isothermal test at 100"C is presented. Similar
results are obtained for the other isothermal curves. Even if the test parameters were not chosen to properly identify this criterion, occurring for too low viscosity,Fig. 10shows that G0becomes higher than G00at the very early instant of
polymer-ization and was not further investigated.
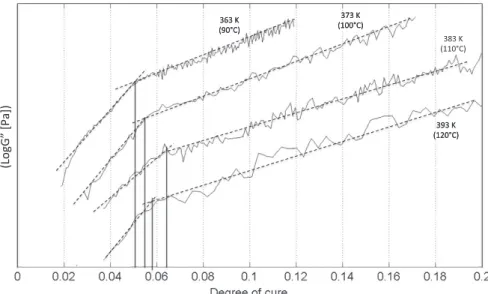
The most relevant criterion to describe the polysilazane gelation was found to be the Harran and Laudouard criterion[30], which matches the gelation point to the inflection of the loss modulus (G00) curve vs. time.
Oscillatory rheology curves were obtained under four isothermal conditions: 363 K (90"C), 373 K (100 "C), 383 K (110 "C) and 393 K (120"C). The initial heating rate, necessary to reach the isothermal temperature, is programmed by a PID con-troller to minimize temperature overshoot at the beginning of the isothermal curing.
According to the Kamal–Sourour global model it is possible to calculate the degree of cure (
a
), integrating the differential equation of the reaction rate dadt
# $ with a Runge–Kutta (4,5) explicit method, the Dormand-Price pair, using the ODE45 MatLab!subroutine[46]. This integration is made at each time step, using the experimental time–temperature curves
com-ing from the results of rheological tests. The four curves presentcom-ing the loss modulus vs. degree of cure are presented in
Fig. 11. The gelation point has been obtained as the crossover of the two straight fitting lines before and after the inflexion, according to the following equations:
Fig. 10. Example of G0/G00vs. time plot for the isothermal test performed at 100"C. The rheological tests were designed to monitor the high viscosity range
and the results must not be considered before 12 min in this figure.
a
gel¼ P ia
gel;i! R2i P iR2i R2i ¼ R2fit1;i! R2fit2;i ð12Þ where R2fit1;i, R2fit2;iand R2i are respectively the correlation coefficients of the two fitting lines and the overall correlation
coef-ficients for each curing temperature,
a
gel,iis the crossover between the two fitting lines anda
gelis the gelation point,com-puted as a geometric average of the values identified for the four curing temperatures. The gelation point obtained for this system is 0.058. The results for the four curing temperatures are summarized inTable 3.
4. TTT diagram
The results obtained for this system are summarized inTable 4. According to these results it is possible to plot the gela-tion curve in a Time–Temperature–Transformagela-tion diagram, using the Kamal–Sourour global model. This diagram can be plotted under strict isothermal conditions (instantaneous temperature change up to the curing temperature) or under pseudo-isothermal conditions (finite heating rate up to the curing temperature). The isoconversional curves are plotted in
Fig. 11 for different degrees of cure, from 1% to 99%, showing the evolution of the conversion of the material. Pseudo-isothermal curves show in the same figure the role played by the initial heating rate on the curve: when the heating rate
Table 3
Gel time, degree of cure at gel point and correlation coefficients for each isothermal curing temperature.
Tcuring("C) agel tgel(min) R2
90 0.050 56.9 0.862
100 0.056 21.7 0.949
110 0.067 10.3 0.957
120 0.058 7.0 0.839
Table 4
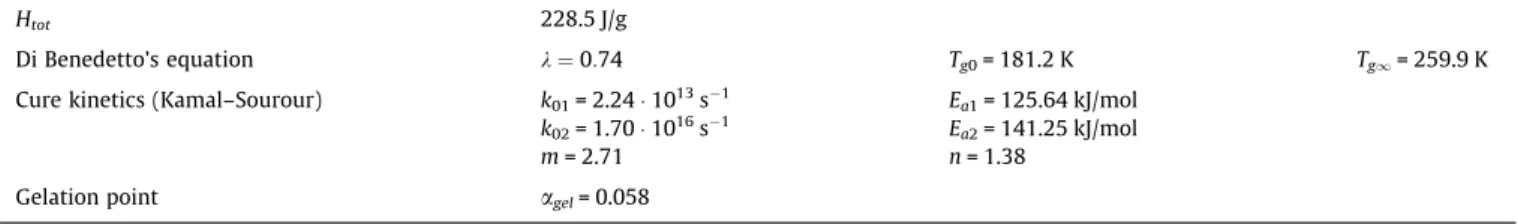
Heat of polymerization, Di Benedetto’s equation, cure kinetics with Kamal–Sourour global model and gelation point of the polysilazane system PSZ20 with 1 wt % of dicumyl peroxide.
Htot 228.5 J/g
Di Benedetto’s equation k ¼ 0:74 Tg0= 181.2 K Tg1= 259.9 K
Cure kinetics (Kamal–Sourour) k01= 2.24 ! 1013s%1 Ea1= 125.64 kJ/mol
k02= 1.70 ! 1016s%1 Ea2= 141.25 kJ/mol
m= 2.71 n= 1.38
Gelation point agel= 0.058
Is ot he rm al
100K/min 50K/min 20K/min 10K/min 5K/min
α = 0.01, Tg = 184.7 K α = 0.025, Tg = 185.4 K α = 0.058, Tg = 187.0 K α = 0.5, Tg = 213.8 K α = 0.99, Tg = 261.7 K Material gelation Experimental oscillatory rheology (heating rate ~19-22K/min)
Fig. 12. Isothermal and pseudo-isothermal (100 K/min, 50 K/min, 20 K/min, 10 K/min, 5 K/min) TTT diagrams for the polysilazane system PSZ20 with 1 wt% of dicumyl peroxide. Grey points are the experimental results obtained during oscillatory rheology tests at 363 K, 373 K, 383 K and 393 K.
slows down (100 K/min), the gelation of the system begins to take place during the heating rate and not during isothermal curing, for temperatures higher than 420 K (this temperature decreases with the heating rate).
InFig. 12, the experimental data (grey circles), obtained with a heating rate between 19 and 22 K/min, and used to iden-tify the gelation point, are close to the gelation curve simulated with a heating rate of 20 K/min, and confirm the relevance of considering the temperature ramp in the gelation identification.
Instead of plotting the usual vitrification curve on this TTT diagram, which would be located in a temperature range between 181 K (%92 "C) and 260 K (%13 "C) without any practical interest for composite processing, the glass transition temperature was mentioned for each isoconversional curve. Moreover in the temperature range of the glass transition, the gelation time is higher than 2 ! 1010s, which is out of the validity range of the model.
5. Conclusions
The cure kinetics of the polysilazane system PSZ20 with dicumyl peroxide at 1 wt% was studied under both isothermal and dynamic conditions. A set of DSC dynamic scans allow computing the heat of polymerization of the system, which value is 229 J/g. Several DSC isothermal analyses were carried out at different curing temperatures (363–393 K) and durations (5 min to 48 h) to identify the Di Benedetto’s equation for this system and a Kamal–Sourour phenomenological model. A Tg0of 181 K (%92 "C) and a Tg1of 260 K (%13 "C) were obtained. The kinetic model was carried out considering an initial
degree of conversion, which allows accounting for the effect of the initial heating rate before isothermal cure. This model uses two rate constants. A first activation energy of 126 kJ/mol is obtained. The second activation energy is 141 kJ/mol, and it allows well reproducing the anisothermal peak, for different heating rates. The numerical simulations of the conver-sion advancement of the system are in good agreement with both isothermal and dynamic experimental analyses, especially for low degree of cure and for the highest conversion rate ranges. The discrepancy between model and experimental data occurs for a degree of cure greater than 0.9: this disagreement is probably generated by the simplicity of the kinetic equations, which cannot allow taking into account the degradation of the dicumyle peroxide and the polymerization of the system at the same time. Other approaches should be tried to improve the modelling of the system, as a cure kinetic composed of two (or more) equations or a fully mechanistic model. However, this error does not prevent to properly model material gelation, which takes place at a low degree of cure, where the model is in good agreement with experimental data. The gel point was obtained with the loss modulus inflexion criterion, according to Harran and Laudouard [30], for four isothermal oscillatory rheology tests. The conversion degree at the gel point (
a
gel= 0.058) is obtained by plotting the lossmodulus vs. the degree of cure, using the kinetic model previously obtained. According to the kinetic model, a set of isother-mal and pseudo-isotherisother-mal gelation curves are plotted in a TTT diagram.
Acknowledgements
The collaboration with Snecma and Herakles is gratefully acknowledged. This work was supported under the PRC Composites, French research project funded by DGAC, involving SAFRAN Group, ONERA and CNRS (Contract reference number: 1554448A).
References
[1]P. Schutzenberger, A. Colson, Silicon, C. R. Hebd. Seances Acad. Sci. 93 (1885) 1508–1511.
[2]O. Glemser, K. Beltz, P. Naumann, Zur Kenntnis des Systems Silicium-Stickstoff, Zeitschrift für Anorg. und Allg. Chemie 291 (1–4) (1956) 51–66. [3]B.J. Aylett, G.M. Burnett, L.K. Peterson, N. Ross, Thermal degradation of polymers, SCI Monogr. 13 (1961) 5–11.
[4]E. Kroke, Y.L. Li, C. Konotschny, E. Lecomte, C. Fasel, R. Riedel, Silazane derived ceramics and related materials, Mater. Sci. Eng. 26 (2000) 97–199. [5]D. Seyferth, G.H. Wiseman, High-yield synthesis of Si3N4/SiC ceramic materials by pyrolysis of a novel polyorganosilazane, Commun. Am. Ceram. Soc.
27 (7) (1984) 132–133.
[6]Y. Blum, R.M. Laine, Catalytic methods for the synthesis of oligosilazanes, Organometallics 5 (1986) 2081–2086. [7]R.M. Laine, Transition metal catalysed synthesis of oligo- and poly-silazanes, Platin. Met. Rev. 32 (2) (1988) 64–71. [8]J.M. Schwark, Isocyanate-modified polysilazane ceramic precursors, Polym. Prep. 32 (1991) 567–568.
[9]J.M. Schwark, M.J. Sullivan, Isocyanate-modified polysilazanes: conversion to ceramic materials, Mater. Res. Soc. Proc. 271 (1992) 807–812. [10]D. Seyferth, C. Strohmann, N.R. Dando, A.J. Perrotta, Poly(ureidosilazanes): Preceramic Polymeric Precursors for Silicon Carbnitride and Silicon Nitride.
Synthesis, Characterization and Pyrolytic Conversion to Si3N4/SiC Ceramics, Chem. Mater. 7 (1995) 2058–2066. [11]F. Aldinger, M. Weinmann, J. Bill, Precursor-derived Si–B–C–N ceramics, Pure Appl. Chem. 70 (1998) 439–448.
[12]Y.L. Li, E. Kroke, R. Riedel, C. Fasel, C. Gervais, F. Babonneau, Thermal cross-linking and pyrolytic conversion of poly(ureamethylvinyl)silazanes to silicon-based ceramics, Appl. Organomet. Chem. 15 (2001) 820–832.
[13]S. Reschke, C. Haluschka, R. Riedel, Z. Lences, D. Galusek, In situ generated homogeneous and functionally graded ceramic materials derived from polysilazane, J. Eur. Ceram. Soc. 23 (2003) 1963–1970.
[14]E. Klatt, A. Frass, M. Friess, D. Koch, H. Voggenreiter, Mechanical and microstructural characterisation of SiC- and SiBNC- fibre reinforced CMCs manufactured via PIP method before and after exposure to air, J. Eur. Ceram. Soc. 32 (2012) 3861–3874.
[15] C.P. GmbH, Technical Information: Ceraset!PSZ 20, 2011.
[16] Technical Bulletin 1, KiON Ceraset polyureasilazane and KiON ceraset polysilazane 20 heat-curable resins of KiON Corporation”.
[17]L.A. Liew, Y. Liu, R. Luo, T. Cross, L. An, V.M. Bright, M. Dunn, J.W. Daily, R. Raj, Fabrication of SiCN MEMS by photopolymerization of pre-ceramic polymers, Sens. Acttuators A Phys. Artic. 95 (2002) 143–151.
[18]M. Schulz, M. Borner, J. Gottert, T. Hanemann, J. Hausselt, G. Motz, Cross linking behaviour of preceramic polymers effected by UV- and synchrotron radiation, Adv. Eng. Mater. 6 (2004) 676–680.
[19]A. Kojima, S. Hoshii, T. Muto, Characteristics of polysilazane compound and its application as coating for carbon materials, J. Mater. Sci. Lett. 21 (10) (2002) 757–760.
[20]C. Vakifahmetoglu, I. Menapace, A. Hirsch, L. Biasetto, R. Hauser, R. Riedel, P. Colombo, Highly porous macro- and micro-cellular ceramics from a polysilazane precursor, Ceram. Int. 35 (2009) 3281–3290.
[21]S.A.C. Abarca, O. Flores, A.L.G. Prette, G.S. Barroso, T. Coan, G. Motz, R.A.F. Machado, Synthesis and thermal characterization of silicon-based hybrid polymer, Chem. Eng. Trans. 32 (2013) 1621–1626.
[22]T. Konegger, R. Patidar, R. Bordia, A novel processing approach for free-standing porous non-oxide ceramic supports from polycarbosilane and polysilazane precursors, J. Eur. Ceram. Soc. 35 (9) (2015) 2679–2683.
[23] J.M. Schwark, Isocyanate- and isothiocyanate- modified polysilazane ceramic precursors, 1988.
[24] J.M. Schwark, (Thio)amide-modified silazane polymer composition containing a free radical generator, 1989. [25] J.M. Schwark, Peroxide-substituted polysilazanes, 1992.
[26]A. Lavedrine, D. Bahloul, P. Goursat, N. Choong Kwet Yive, R. Corriu, D. Leclerq, H. Mutin, A. Vioux, Pyrolysis of polyvinylsilazane precursors to silicon carbonitride, J. Eur. Cearmic Soc. 8 (4) (1991) 221–227.
[27]J. Bill, J. Seitz, G. Thurn, J. Dürr, J. Canel, B. Janos, A. Jalowiecki, D. Sauter, S. Chempp, H.-P. Lamparter, J. Mayer, F. Aldinger, Structure analysis and properties of Si–C–N ceramics derived from polysilazanes, Phys. Status Solidi 166 (1998) 269.
[28] Lanxide company, Technical Bulletin of CERASET!SN Inorganic Polymer, 1997.
[29]M.F. Gonon, S. Hampshire, J.P. Disson, G. Fantozzi, A polysilazane precursor for Si–C–N–O matrix composites, J. Eur. Ceram. Soc. 15 (1995) 683–688. [30]D. Harran, A. Laudouard, Caractérisation de la gélification d’une résine thermodurcissable par méthode rhéologique, Rheol. Acta 24 (1985) 596–602. [31]A.T. Di Benedetto, Prediction of the glass transition temperature of polymers: a model based on the principle of corresponding states, J. Polym. Sci. Part
B 25 (1987) 1949–1969.
[32]J.P. Pascault, R.J.J. Williams, Glass transition temperature versus conversion relationships for thermosetting polymers, J. Polym. Sci. Part B Polym. Phys. 28 (1990) 85–95.
[33]M.J. Richardson, N.G. Savill, Derivation of accurate glass transition temperatures by differential scanning calorimetry, Polymer (Guildf) 16 (10) (1975) 753–757.
[34]M.R. Kamal, S. Sourour, Kinetics and thermal characterization of thermoset cure, Polym. Eng. Sci. 13 (1) (1973) 59–64.
[35]M. Ivankovic, L. Incarnato, J.M. Kenny, L. Nicolais, Curing kinetics and chemo-rheology of epoxy/anhydride system, J. Appl. Polym. Sci. 90 (2003) 3012– 3019.
[36]F.X. Perrin, T.M.H. Nguyen, J.L. Vernet, Chemico-diffusion kinetics and TTT cure diagrams of DGEBA–DGEBF/amine resins cured with phenol catalysts, Eur. Polym. J. 43 (12) (2007) 5107–5120.
[37]N. Rabearison, C. Jochum, J.C. Grandidier, A cure kinetics, diffusion controlled and temperature dependent, identification of the Araldite LY556 epoxy, J. Mater. Sci. 46 (3) (2010) 787–796.
[38]L.M. Lopez, A.B. Cosgrove, J.P. Hernandez-Ortiz, T.A. Osswald, Modeling the vulcanization reaction of silicone rubber, Polym. Eng. Sci. (2007) 675–683. [39]J.A. Nelder, R. Mead, A simplex method for function minimization, Comput. J. 7 (4) (1965) 308–313.
[40]J.C. Lagarias, J.A. Reeds, M.H. Wright, P.E. Wright, Convergence properties of the nelder-mead simplex method in low dimensions, SIAM J. Optim. 9 (1) (1998) 112–147.
[41]I. Di Somma, R. Marotta, R. Andreozzi, V. Caprio, Dicumyl peroxide thermal decomposition in cumene: development of a kinetic model, Chem. Eng. Trans. 24 (2011) 73–78.
[42]P.I. Karkanas, I.K. Partridge, Cure modeling and monitoring of epoxy/amine resin systems. II. Network formation and chemoviscosity modeling, J. Appl. Polym. Sci. 77 (2000) 2178–2188.
[43]H. Winter, Can the gel point of a cross-linking polymer be detected by the G0–G00crossover?, Polym Eng. Sci. 27 (22) (1987) 1698–1702.
[44]R. Chavez, E. Ionescu, C. Balan, C. Fasel, R. Riedel, Effect of ambient atmosphere on crosslinking of polysilazanes, J. Appl. Polym. Sci. 119 (2011) 794– 802.
[45]O. Flores, L. Heymann, G. Motz, Rheological behaviour of tailored polysilazanes melts for the processing of SiCN ceramics: viscoelastic properties and thermal stability, Rheol. Acta 54 (2015) 517–528.