Publisher’s version / Version de l'éditeur:
Analytical Chemistry, 77, 9, pp. 2971-2977, 2005-03-23
READ THESE TERMS AND CONDITIONS CAREFULLY BEFORE USING THIS WEBSITE. https://nrc-publications.canada.ca/eng/copyright
Vous avez des questions? Nous pouvons vous aider. Pour communiquer directement avec un auteur, consultez la
première page de la revue dans laquelle son article a été publié afin de trouver ses coordonnées. Si vous n’arrivez pas à les repérer, communiquez avec nous à PublicationsArchive-ArchivesPublications@nrc-cnrc.gc.ca.
Questions? Contact the NRC Publications Archive team at
PublicationsArchive-ArchivesPublications@nrc-cnrc.gc.ca. If you wish to email the authors directly, please see the first page of the publication for their contact information.
NRC Publications Archive
Archives des publications du CNRC
This publication could be one of several versions: author’s original, accepted manuscript or the publisher’s version. / La version de cette publication peut être l’une des suivantes : la version prépublication de l’auteur, la version acceptée du manuscrit ou la version de l’éditeur.
For the publisher’s version, please access the DOI link below./ Pour consulter la version de l’éditeur, utilisez le lien DOI ci-dessous.
https://doi.org/10.1021/ac048275a
Access and use of this website and the material on it are subject to the Terms and Conditions set forth at
Quantitation of trace metals in liquid samples by dried-droplet laser
ablation inductively coupled plasma mass spectrometry
Yang, Lu; Sturgeon, Ralph E.; Mester, Zoltán
https://publications-cnrc.canada.ca/fra/droits
L’accès à ce site Web et l’utilisation de son contenu sont assujettis aux conditions présentées dans le site
LISEZ CES CONDITIONS ATTENTIVEMENT AVANT D’UTILISER CE SITE WEB.
NRC Publications Record / Notice d'Archives des publications de CNRC:
https://nrc-publications.canada.ca/eng/view/object/?id=adcd00e3-43d3-4ffe-b8d6-b594b3d02107
https://publications-cnrc.canada.ca/fra/voir/objet/?id=adcd00e3-43d3-4ffe-b8d6-b594b3d02107
Quantitation of Trace Metals in Liquid Samples by
Dried-Droplet Laser Ablation Inductively Coupled
Plasma Mass Spectrometry
Lu Yang,* Ralph E. Sturgeon, and Zolta´ n Mester
Institute for National Measurement Standard, National Research Council Canada, Ottawa, Ontario, Canada K1A 0R6
A new, discrete sample introduction approach based on laser ablation (LA) is described for the quantitation of several trace metals in aqueous samples by ICPMS. Dried microdroplets of sample, previously mixed with a sodium acetate matrix, were quantitatively ablated from a poly-styrene substrate. Calibration via the method of standard additions or isotope dilution provided accurate results for Ni, Cd, and Pb in drinking water and Se in a yeast extract. Compared to conventional solution nebulization, LA sample introduction provided a 2-7-fold enhancement in abso-lute sensitivity and transport efficiency of 2-14% for the elements examined. Estimated detection limits are 1-7-fold poorer for the dried-droplet LA technique, primarily a result of degraded precision arising from counting statistics limitations for discrete sample introduction. On the basis of the several-second half-width of the resulting transient signals, sample throughput can be in the range of 250 samples per hour. Additionally, integration of the transient signal should eliminate contributions to elemen-tal fractionation from the LA step. Dried-droplet LA-ICPMS offers several advantages over its counterpart, ETV-ICPMS, with respect to background intensity, through-put, and ease of desorption.
The analytical use of lasers in combination with various mass spectrometric techniques has been studied for decades. Lasers spanning the UV to IR have been primarily used under both vacuum and atmospheric pressure conditions to achieve desorp-tion, ionizadesorp-tion, and fragmentation of samples. The most important laser-based MS techniques include matrix-assisted laser desorption ionization (MALDI) mass spectrometry,1laser ablation ICPMS,2 infrared multiphoton dissociation (IRMPD), Fourier transform ion cyclotron resonance mass spectrometry (FTICR MS),3two-step laser desorption/laser ionization mass spectrometry (L2M),4and laser microprobe mass spectrometry (LMMS).5Of these, laser ablation and MALDI are probably the two most commonly used
techniques. From a user’s perspective, the two technologies are remarkably similar, even if the processes involved are quite different.
Laser ablation is most frequently applied to the analysis of solid samples wherein the laser pulse achieves desorption, vaporization, and ionization of the analyte and the accompanying matrix. During this process, the solid matrix absorbs the photon energy, transforming it to excitation energy/heat. If the laser energy is sufficiently high, direct ejection of atoms/molecules/ions from the crystal lattice can be accomplished2, with the generated species being transferred to an ion source, usually an ICP, where analytes are ionized and detected by MS.
In MALDI, the sample solution is spiked with a highly UV absorptive compound (typically aromatic compounds), the MALDI matrix.1A few microliters of sample-matrix mixture is spotted onto a target plate and dried. Similar to LA, when the laser pulse irradiates the crystallized matrix, the photon energy is rapidly converted to excitation energy, transferred to the crystal lattice, and induces vaporization of the matrix and the analyte species. MALDI has primarily been used with aqueous samples to increase sensitivity and throughput over analysis by nebulization-based electrospray MS. However, quantitation remains a contentious issue both with MALDI and LA. The pulsed nature of the sample/ ion generation process leads to difficulties with detection. In MALDI, the almost exclusive use of TOF detection promotes the speed and information-rich nature of the technique, whereas the vast majority of LA applications are based on use of scanning mass analyzers, which presents a clear mismatch.
LA-ICPMS is advantageous because of its direct solid sampling capability, high sensitivity, fast analysis, and microanalysis and depth profiling capabilities.6-19However, elemental fractionation,20
* Corresponding author fax: 613-993-2451; e-mail: Lu.Yang@nrc.ca. (1) Karas, M.; Hillenkamp, F. Anal. Chem. 1988, 60, 299-301.
(2) Russo, R. E.; Mao, X.; Liu, H.; Gonzalez, J.; Mao, S. S. Talanta 2002, 57, 425-451.
(3) Flora, J. W.; Muddiman, D. C. J Am Soc Mass Spectrom. 2004, 15, 121-127.
(4) Mahajan, T. B.; Ghosh, U.; Zare, R. N.; Luthy, R. G. Int. J. Mass Spectrom.
2001, 212, 41-48.
(5) Van Vaeck, L.; Poels, K.; De Nollin, S.; Hachimi, A.; Gijbels, R. Cell Biol.
Int.1997, 21, 634-648.
(6) Pickhardt, C.; Becker, J. S.; Dietze, H. Fresenius Anal. Chem. 2000, 368, 173-181.
(7) Rodushkin, I.; Axelsson, M. D.; Malinovsky, D.; Baxter, D. C. J. Anal. At.
Spectrom.2002, 17, 1223-1230.
(8) Rodushkin, I.; Axelsson, M. D.; Malinovsky, D.; Baxter, D. C. J. Anal. At.
Spectrom.2002, 17, 1231-1239.
(9) Baba, K.; Watanabe, E.; Eun, H.; Ishizaka, M. J. Anal. At. Spectrom. 2003,
18, 1485-1488.
(10) Legrand, M.; Lam, R.; Jensen-Fontaine, M.; Salin, E. D.; Chan, H. M. J. Anal.
At. Spectrom.2004, 19, 1287-1288.
(11) Lam, R.; Salin, E. D. J. Anal. At. Spectrom. 2004, 19, 938-940. (12) Russo, R. E.; Mao, X.; Liu, H.; Gonzales, J.; Mao, S. S. Talanta 2002, 57,
425-451.
(13) Durrant, S. F. J. Anal. At. Spectrom. 1999, 14, 1385-1403.
(14) Gu¨nther, D.; Jackson, S. E.; Longerich, H. P. Spectrochim. Acta, Part B 1999,
54, 381-409.
Anal. Chem.2005,77,2971-2977
leading to nonstoichiometric response, frequently occurs, although the sources of this problem are still open to debate.7,8,21,22This makes it difficult to achieve quantitative analytical results using this technique. This shortcoming has limited use of LA as a routine quantitative methodology, especially if no suitable standard reference materials of similar matrix composition are available for calibration.
Until now, applications of LA-ICPMS have principally been in the area of geological, environmental, and material science for determination of trace and ultratrace elements in solid samples. No significant effort has been made toward implementation of LA for aqueous samples.23,24The objective of this study was to evaluate the possibility of undertaking quantitative ICPMS analysis of liquid samples by complete LA of dried droplets. This approach has many features in common with electrothermal vaporization (ETV), a powerful sample introduction system for ICPMS applicable to both liquids and solids.25-27Despite different energy sources used for the initial vaporization of analytes and sample matrix, the remaining processes for the transport of vaporized species and analysis by ICPMS are the same in both techniques, as they both require a matrix salt modifier to enhance transport efficiency of analytes to the ICP.28,29ETV-ICPMS offers many advantages for direct analysis of liquid samples, but throughput is limited by the time needed to run the temperature program for drying, pyrolysis, and vaporization cycles. By contrast, LA-ICPMS of dried droplets promises faster throughput for the determination of trace and ultratrace elements in liquid samples. Indeed, a quantitative method was reported by Odom et al.30for the determination of trace elements in aqueous sample by analysis of its dried droplets using secondary ion MS.
EXPERIMENTAL SECTION
Instrumentation. The ICPMS used in this work was a
Perkin-Elmer SCIEX ELAN 6000 (Concord, Ontario, Canada) equipped with a Gem cross-flow nebulizer. A quartz torch with an alumina sample injector tube was used. A double-pass Ryton spray chamber was mounted outside the torch box and maintained at room temperature.
A frequency quadrupled ND-YAG laser system operating at 266 nm (LUV266, New Wave Research, Inc., Fremont, CA) was used for sample ablation. Argon transported sample aerosol to the ICPMS. Laser ablation was performed at 20 Hz using only two pulses at 100% applied laser energy (3.4 mJ).
Polystyrene weighing boats (VWR International, Mississauga, Ontario, Canada) were used as substrates on which all samples were deposited.
Reagents and Solutions. Nitric acid was purified in-house
prior to use by sub-boiling distillation of reagent grade feedstock in a quartz still. High-purity deionized water (DIW) was obtained from a NanoPure mixed bed ion exchange system fed with reverse osmosis domestic feedwater (Barnstead/Thermolyne Corp.). ACS grade sodium chloride, potassium chloride, magnesium chloride, sodium acetate, and citric acid were obtained from BDH Inc. (Toronto, Canada). EDTA tetrasodium salt, lactose, dodecylso-dium sulfate, and glucose were obtained from Fisher Scientific (Nepean, Canada). Titanium oxide nanoparticles (TiNano 40 series) were obtained from AlTAIR Technologies Inc.
Stock solutions of 1000 µg mL-1of natural abundance Ni, Cd, and Pb were prepared by dissolution of the high purity metal or metal oxide (Johnson, Matthey & Co. Limited, London, UK) in HNO3solution. Working standards, which were used for61Ni, 111Cd, and207Pb reverse spike isotope dilution, were prepared by serial dilution of the stock with DIW containing 1% HNO3.
Enriched61Ni,111Cd, and207Pb isotopes were purchased from Oak Ridge National Laboratory (Oak Ridge, TN) as either the metal or metal oxide. Stock solutions were prepared by dissolution of the metal or metal oxide in a few milliliters of nitric acid followed by dilution with DIW. Individual working spike solutions contain-ing 0.26, 0.040, and 0.341 µg mL-1Ni, Cd, and Pb, respectively, were prepared by volumetric dilution of stocks in 1% HNO3. Accurate concentrations in these enriched spikes were determined by reverse isotope dilution using natural abundance Ni, Cd, and Pb standards with liquid introduction ICPMS detection and were then used for the determination of Ni, Cd, and Pb in SIM.8.10P drinking water samples.
Drinking water SIM.8.10P, prepared by the Institute for National Measurement Standards, National Research Council Canada (Ottawa, Ontario, Canada), for a 2004 Inter-American Metrology System intercomparison exercise,31 was used for method validation.
Preparation of Standard Solutions. To examine the effect
of sample volume on the resultant dried-droplet spot size and signal intensity, three standard solutions containing various concentrations of analyte were prepared. Standard A contained 100 ng mL-1Ni, Rh, Cd, and Pb with 10 µg mL-1NaAc. Standard B contained 250 ng mL-1Ni, Rh, Cd, and Pb with 25 µg mL-1 NaAc. Standard C contained 1000 ng mL-1Ni, Rh, Cd, and Pb with 100 µg mL-1NaAc. Four replicates of 50, 20, and 5 µL for standards A, B, and C, respectively, were pipetted onto the surface of a polystyrene weighing boat and located within the confines of a square previously marked on the transverse surface. The weighing boats were then placed in a class-10 fumehood on a hot plate under an IR lamp for drying. The bottom of the weighing
(15) Reid, J. E.; Horn, I.; Longerich, H. P.; Forsythe, L.; Jenner, G. A. Geostand.
Newslett.1999, 23, 149-155.
(16) Boulyga, S. F.; Desideri, D.; Meli, M. A.; Testa, C.; Becker, J. S. Int. J. Mass
Spectrom.2003, 226, 329-339.
(17) Tibi, M.; Heumann, K. G. J. Anal. At. Spectrom. 2003, 18, 1076-1081. (18) Becker, J. S.; Pickhardt, C.; Pompe, W. Int. J. Mass Spectrom. 2004, 237,
13-17.
(19) Boulyga, S. F.; Tibi, M.; Heumann, K. G. Anal. Bioanal. Chem. 2004, 378, 342-347.
(20) Russo, R. E.; Mao, X. L.; Borisov, O. V.; Liu, H. J. Anal. At. Spectrom. 2000,
15, 1115-1120.
(21) Guillong, M.; Gu¨nther, D. J. Anal. At. Spectrom. 2002, 17, 831-837. (22) Kuhn, H. R.; Gu¨nther, D. J. Anal. At. Spectrom. 2004, 19, 1158-1164. (23) Gu¨nther, D.; Frischknecht, R.; Mu¨schenborn, H. J.; Heinrich, C. A. Fresenius
J Anal. Chem.1997, 359, 390-393.
(24) Boue-Bigne, F.; Masters, B. J.; Crighton, J. S.; Sharp, B. L. J. Anal. At.
Spectrom.1999, 14, 1665-1672.
(25) Darke, S. A.; Tyson, J. F. Microchem. J. 1994, 50, 310-336. (26) Gre´goire, D. C. Can. Anal. Sci. Spectrosc. 1997, 42, 1-9.
(27) Martin-Esteban, A.; Slowikowski, B. Crit. Rev. Anal. Chem. 2003, 33, 43-45.
(28) Gre´goire, D. C.; Sturgeon, R. E. Spectrochim. Acta B 1999, 54, 773-786. (29) Hughes, D. M.; Gregoire, D. C.; Chakrabarti, C. L.; Sturgeon, R. E.; Byrne,
J. P.; Goltz, D. M. Spectrochim. Acta B 1995, 50, 425-440.
(30) Odom, R. W.; Lux, G.; Fleming, R. H.; Chu, P. K.; Niemeyer, I. C.; Blattner, R. J. Anal. Chem. 1988, 60, 2070-2075.
(31) Willie, S.; Sturgeon, R. E. SIM.8.10P Part II Trace Elements in Drinking
Water; Technical report, National Research Council Canada, November,
2004.
boat was then excised and placed into the LA sampling chamber for ICPMS analysis.
To study the effect of salt concentration on spot size and signal intensity, six standard solutions (standards D-I) consisting of 10 mL of 100 ng mL-1Ni, Rh, Cd, and Pb containing 1, 10, 20, 50, 100, and 1000 µg mL-1NaAc were prepared in 1% HNO3. Four replicate 20 µL volumes of each solution were deposited onto the polystyrene substrate and further treated as described above.
Sample Preparation for Drinking Water. Sample
prepara-tion was undertaken in a class-100 clean room. For calibraprepara-tion using a Rh internal standard, five calibration standards containing 0, 0.5, 5, 20, and 50 ng mL-1Ni, Cd, and Pb were prepared in 1% HNO3. For LA-ICPMS analysis, 10 mL of each of the five calibration standards, three aliquots of sample blank (1% HNO3), and four aliquots of SIM.8.10P drinking water were accurately pipetted into clean 15 mL polyethylene (PE) bottles. After addition of 0.1000 mL of 1 µg mL-1of Rh, 0.2000 mL of a 1000 µg mL-1 solution of NaAc was added to each bottle. Bottles were then capped and manually shaken. A 20 µL volume of each sample was then taken for drying and LA, as described above.
For standard additions calibration using a Rh internal standard, three sample blanks and four unspiked and three spiked samples of SIM.8.10P were prepared. A 10 mL volume of 1% HNO3served as the sample blank and 10 mL of the drinking water was used for preparing the unspiked and spiked samples, which were pipetted into clean 15 mL PE bottles. After addition of 0.1000 mL of 1 µg mL-1Rh, 0.2000 mL of 1000 µg mL-1NaAc was added to each bottle. Volumes of 0.0200, 0.0400, and 0.1000 mL of 5 µg mL-1Ni, Cd, and Ni mixed standard solution were added to three spiked samples, resulting in concentrations of 10, 20, and 50 ng mL-1. To keep the same volume for all samples, 0.1006 mL of 1% HNO3was added to sample blanks and unspiked samples, whereas 0.0800 and 0.0600 mL of 1% HNO3 were added to the first two spiked samples. A 20 µL volume was dispensed for sample deposition and subsequent LA-ICPMS analysis.
For isotope dilution calibration, three sample blanks and six replicate samples of SIM.8.10P were prepared. Aliquots of 5 mL of SIM.8.10P were spiked with appropriate amounts of61Ni,111Cd, and207Pb enriched spikes. After addition of 0.200 mL of 1000 µg mL-1NaAc, the samples were diluted to 10 mL with 1% HNO3. Again, 20 µL volumes of each sample were spotted for LA analysis. Three sample blanks were also prepared concurrently but with the addition of only 10% of the amount of enriched isotope spikes used for the samples. A mass bias correction solution was prepared in the same way using a 50 ng mL-1natural abundance Ni, Cd, and Pb (NIST SRM 981) standard solution.
Analysis Procedure and Data Handling. Optimization of the
ELAN 6000 and dead time correction were first performed as recommended by the manufacturer using a standard liquid sample introduction system. The plasma was then extinguished and the spray chamber and nebulizer assembly replaced with the LA transfer line and its adapter. The final optimization of lens voltage and Ar carrier gas flow for dry plasma conditions was performed by monitoring the63Cu intensity during continuous ablation of a penny coin. Typical operating parameters for LA-ICPMS are summarized in Table 1. Data acquisition on the ELAN6000 was manually triggered just prior to ablation of samples. Intensities of60Ni, 61Ni, 103Rh,114Cd, 111Cd, 208Pb, and 207Pb were
simulta-neously monitored. At the end of each run, the acquired raw data were transferred to an off-line computer for further processing using in-house software, which yields both background corrected peak height and peak area information. Peak areas were used for the final quantitation of analyte concentrations.
RESULTS AND DISCUSSION
Optimization of Sample Deposition. No significant
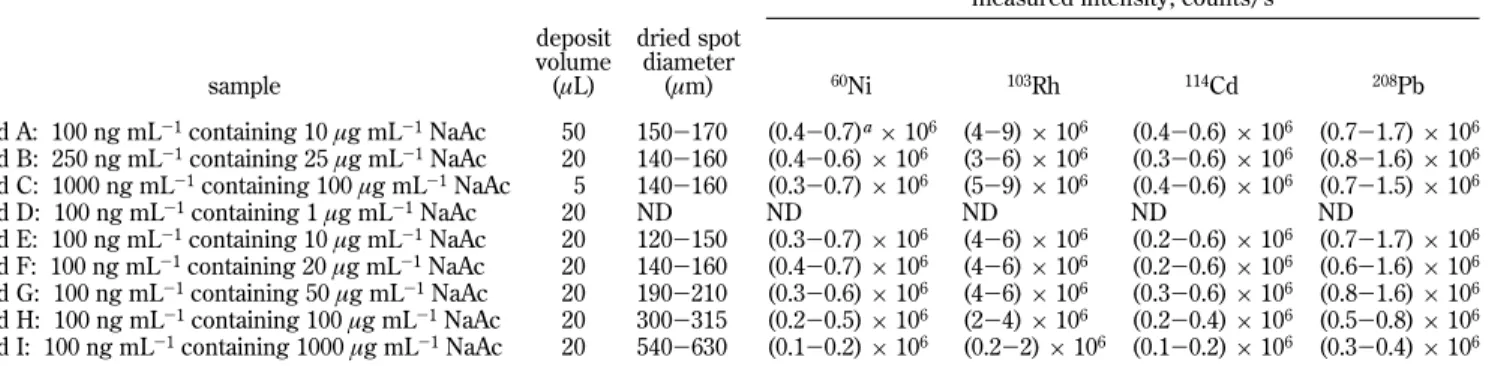
back-ground (less than 100 counts/s) was detected for the targeted analytes during ablation of the polystyrene weighting boat, confirming no significant contribution to contamination from this substrate. Transmission of light through the plastic was of importance because the sample residues need to be illuminated through the supporting surface. In a preliminary study, it was found that use of 100% laser energy and a 400 µm laser beam diameter generated the highest signals from a dried droplet of a standard solution. Full power was thus used for all subsequent studies. To achieve complete desorption from the plastic surface using only a couple of laser shots focused on the same spot, a spot size of less than 400 µm is thus required because this is the maximum laser beam diameter with the present system. As a consequence, the size of the dried sample droplet had a significant effect on the ICPMS response; raster scanning of the laser over the spot was not used. Thus, the effects of salt concentration and sample volume on signal intensities were investigated using standard solutions. Sodium acetate was used as the “matrix”; results are summarized in Table 2.
Deposition volumes in the range of 5-50 µL were investigated. To isolate the effect of deposition volume on dried spot size and signal intensity, three standard solutions having different concen-trations of analytes and salt (Table 2, standards A-C) were tested to provide a constant amount of analyte and matrix, irrespective of the deposition volume. No significant difference was found in either dried spot size or signal intensities, despite the range of deposition volume tested. Spot size is likely determined by the solubility limit of the salt being exceeded as evaporation of the aqueous solvent occurs. Thereafter, suspended nucleated particles
Table 1. LA-ICPMS Operating Conditions ICPMS
rf power 1200 W
plasma Ar gas flow rate 15.0 L min-1
auxiliary Ar gas flow rate 1.0 L min-1
nebulizer Ar gas flow rate 0.925 L min-1for liquid introduction
sampler cone (nickel) 1.00 mm aperture skimmer cone (nickel) 0.88 mm aperture
lens voltage 7.50 V
scanning mode peak hopping
points per peak 1
dwell time 20 ms
sweeps per reading 1
readings per replicate 180
number of replicates 1
LUV266 laser system
energy 100% (3.4 mJ)
size of laser beam 400 µm
repetition rate 20 Hz
pulses 2
will be distributed over the surface as a result of liquid wetting due to its surface tension and any propensity for the precipitate to adsorb onto the polystyrene surface. A 20 µL sample volume was selected for further study in an effort to minimize drying time as well as to permit deposition of several drops over a limited area of the polystyrene substrate.
No dried spots were visible on the plastic surface when using the laser video display if a 20 µL volume of a 100 ng mL-1Ni, Rh, Cd, and Pb standard solution containing less than 1 µg mL-1NaAc (less than 20 ng of salt in the dried spot) was deposited. As expected, the shadow of the spot image (in transmitted light) evident on the laser video display increased as the mass of NaAc increased, as shown in Figure 1. A continuous increase in the size of dried spots was obtained as the concentration of NaAc
increased from 10 to 1000 µg mL-1(from 200 to 20 000 ng in the dried droplets), as shown in Table 2. Relatively high and constant response for all four elements was obtained from the 100 ng mL-1 standards with LA-ICPMS at NaAc concentrations ranging from 10 to 50 µg mL-1 (from 200 to 1000 ng in dried droplets). Sensitivities for all analytes decreased at higher NaAc concentra-tions, likely due to signal suppression caused by Na, as illustrated by the following considerations. Assuming the analysis time for a spot containing 20 µg NaAc using LA is about 6 s, the amount of Na introduced to the ICP is equivalent to nebulization of a solution containing 10000 µg mL-1NaAc at 1.0 mL min-1(assuming 2% nebulization efficiency). Signal suppression is expected at this high level of Na using liquid sample introduction ICPMS. The 20 µg mL-1NaAc concentration (400 ng salt per spot) was chosen for the final study to ensure high signal response, ease of location of the dried spots using the video display, as well as minimization of total salt input to the ICP.
It was verified that two laser pulses resulted in complete sample desorption. It is evident from the data in Table 2 that typical response varies by up to 3-fold for any given element when intensities derived from the complete ablation of four replicate dried deposits of the same solution are examined. This must be a consequence of variable transport efficiencies for the generated aerosol. Possibly nonhomogeneous distributions of the residues within the laser beam diameter give rise to variable amounts of the transport modifier being ablated.
Further experiments were conducted to investigate the effects of varying concentrations of NaAc and different salts on the dried spot size using the drinking water sample. No significant differ-ence in either dried spot size or signal intensities was found using NaAc concentrations in the range of 1-100 µg mL-1. Slightly larger dried spot size and lower signal intensities were obtained when 1000 µg mL-1NaAc was used. Unfortunately, no significant change in dried spot size or signal intensities were observed when the ablation matrix salt was changed to NaCl, KCl, MgCl2, EDTA tetrasodium salt, dodecyl sodium sulfate, citric acid, lactose, glucose, or TiNano 40 nanoparticles at a concentration of 100 µg mL-1. The discrepancy in spot size between a typical dried standard solution and drinking water may arise because of the different matrix composition of the water in that unknown organic components may be present that alter surface tension. A 20 µg mL-1concentration of NaAc (although not limited to NaAc only)
Figure 1. Effect of mass of NaAc on dried-droplet size and density. Table 2. Results of Sample Deposition Study
measured intensity, counts/s
sample deposit volume (µL) dried spot diameter (µm) 60Ni 103Rh 114Cd 208Pb std A: 100 ng mL-1containing 10 µg mL-1NaAc 50 150-170 (0.4-0.7)a × 106 (4-9) × 106 (0.4-0.6) × 106 (0.7-1.7) × 106 std B: 250 ng mL-1containing 25 µg mL-1NaAc 20 140-160 (0.4-0.6) × 106 (3-6) × 106 (0.3-0.6) × 106 (0.8-1.6) × 106 std C: 1000 ng mL-1containing 100 µg mL-1NaAc 5 140-160 (0.3-0.7) × 106 (5-9) × 106 (0.4-0.6) × 106 (0.7-1.5) × 106 std D: 100 ng mL-1containing 1 µg mL-1NaAc 20 ND ND ND ND ND std E: 100 ng mL-1containing 10 µg mL-1NaAc 20 120-150 (0.3-0.7) × 106 (4-6) × 106 (0.2-0.6) × 106 (0.7-1.7) × 106 std F: 100 ng mL-1containing 20 µg mL-1NaAc 20 140-160 (0.4-0.7) × 106 (4-6) × 106 (0.2-0.6) × 106 (0.6-1.6) × 106 std G: 100 ng mL-1containing 50 µg mL-1NaAc 20 190-210 (0.3-0.6) × 106 (4-6) × 106 (0.3-0.6) × 106 (0.8-1.6) × 106 std H: 100 ng mL-1containing 100 µg mL-1NaAc 20 300-315 (0.2-0.5) × 106 (2-4) × 106 (0.2-0.4) × 106 (0.5-0.8) × 106 std I: 100 ng mL-1containing 1000 µg mL-1NaAc 20 540-630 (0.1-0.2) × 106 (0.2-2) × 106 (0.1-0.2) × 106 (0.3-0.4) × 106
aRange reflects intensity variation observed during LA of four replicates of subsample.
was used for the final quantitation of analytes in the drinking water using LA-ICPMS in order to render the dried spots visible under laser video display. Use of the largest laser beam diameter and two pulses at 20 Hz resulted in complete ablation of the visible dried droplet of this water sample.
LA-ICPMS Analysis of the Drinking Water. Different
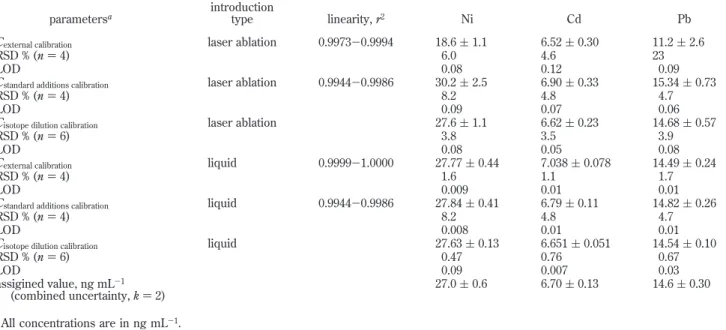
calibration strategies were applied to the quantitation of Ni, Cd, and Pb in the drinking water using LA-ICPMS. An internal standard of Rh (10 ng mL-1) was used with external calibration and standard additions calibration in an attempt to enhance precision and compensate for ablation efficiency. Results are summarized in Table 3.
The linearity of the external calibration curves was examined in the range from 0 to 50 ng mL-1. Correlation coefficients (r2) of 0.9994, 0.9973, and 0.9988 were obtained for Ni, Cd, and Pb, respectively, confirming relatively good linearity. Concentrations of 18.6 ( 1.1, 6.52 ( 0.30, and 11.2 ( 23 ng mL-1(one standard deviation, n ) 4) in the drinking water with precisions of 6.0, 4.6, and 23% RSD were obtained for Ni, Cd, and Pb, respectively, using this approach. As evident from Table 3, only the concentration of Cd is in agreement with the assigned value; significantly lower concentrations were obtained for Ni and Pb. This may be due to the observed differences in size and density of dried sample spots as opposed to those of the calibration solutions, resulting in variations in the fraction of sample ablated.
The linearity of the standard additions calibration curves covers the entire concentration range of the analytes, i.e., 0-50 ng mL-1, in the drinking water. Correlation coefficients (r2) of 0.9986, 0.9983, and 0.9944 were obtained for Ni, Cd, and Pb, respectively. Concentrations of 30.17 ( 2.5, 6.90 ( 0.33, and 15.34 ( 0.72 ng mL-1(one standard deviation, n ) 4) in the drinking water with precisions of 8.2, 4.8, and 4.7% RSDs were obtained for Ni, Cd, and Pb, respectively, in good agreement with the assigned values. Isotope dilution ICPMS has been widely employed for trace element analysis in a variety of sample matrixes. Although solution
introduction yields the highest accuracy and precision,32 this approach has also been used for the determination of trace elements in various solid samples using LA-ICPMS.15-19Better than 10% precision and accuracy was reported in the above studies for most analytes, demonstrating the ability of ID to overcome the generally poor precision and accuracy associated with LA sampling while providing a simple quantitative calibration strategy. Thus, a third calibration strategy, isotope dilution, was also examined for quantitation of the three analytes in the drinking water and relied on the following equation:
where C is the analyte concentration (ng mL-1) in the sample; Cy is the concentration of analyte in the enriched spike (ng mL-1);
vyis the volume (mL) of spike used to prepare the blend solution of sample and spike; vxis the volume (mL) of sample used; Ayis the abundance of the reference isotope in the spike; By is the abundance of the spike isotope in the spike; Axis the abundance of the reference isotope in the sample; Bxis the abundance of the spike isotope in the sample, and Rnis the measured reference/ spike isotope ratio (mass bias corrected) in the blend solution of sample and spike. Results are summarized in Table 3. Concentra-tions of 27.6 ( 1.1, 6.62 ( 0.0.23, and 14.68 ( 0.57 ng mL-1(one standard deviation, n ) 6) in the drinking water with associated precisions of 3.8, 3.5, and 3.9% RSDs were obtained for Ni, Cd, and Pb, respectively. Both precision and accuracy of the results obtained using ID are superior to those obtained using external and standard additions calibration strategies.
Liquid Sample Introduction for ICPMS Analysis of the Drinking Water. A subsequent comparative analysis of the
(32) De Bie`vre, P. Isotope dilution mass spectrometry in Trace Element Analysis
in Biological Specimens; Herber, R. F. M., Stoeppler, M., Eds.; Elsevier: New
York,1994.
Table 3. Analytical Results for Drinking Water Sample
parametersa introductiontype linearity, r2 Ni Cd Pb
Cexternal calibration laser ablation 0.9973-0.9994 18.6 ( 1.1 6.52 ( 0.30 11.2 ( 2.6
RSD % (n ) 4) 6.0 4.6 23
LOD 0.08 0.12 0.09
Cstandard additions calibration laser ablation 0.9944-0.9986 30.2 ( 2.5 6.90 ( 0.33 15.34 ( 0.73
RSD % (n ) 4) 8.2 4.8 4.7
LOD 0.09 0.07 0.06
Cisotope dilution calibration laser ablation 27.6 ( 1.1 6.62 ( 0.23 14.68 ( 0.57
RSD % (n ) 6) 3.8 3.5 3.9
LOD 0.08 0.05 0.08
Cexternal calibration liquid 0.9999-1.0000 27.77 ( 0.44 7.038 ( 0.078 14.49 ( 0.24
RSD % (n ) 4) 1.6 1.1 1.7
LOD 0.009 0.01 0.01
Cstandard additions calibration liquid 0.9944-0.9986 27.84 ( 0.41 6.79 ( 0.11 14.82 ( 0.26
RSD % (n ) 4) 8.2 4.8 4.7
LOD 0.008 0.01 0.01
Cisotope dilution calibration liquid 27.63 ( 0.13 6.651 ( 0.051 14.54 ( 0.10
RSD % (n ) 6) 0.47 0.76 0.67
LOD 0.09 0.007 0.03
assigined value, ng mL-1
(combined uncertainty, k ) 2) 27.0 ( 0.6 6.70 ( 0.13 14.6 ( 0.30
aAll concentrations are in ng mL-1.
C )Cvyvy x ‚ABy- ByRn xRn- Ax ‚AWAWx y (1)
drinking water was undertaken using the three calibration strate-gies and conventional liquid introduction ICPMS. Results are summarized in Table 3. Concentrations obtained for Ni, Cd, and Pb are in agreement with assigned intercomparison values. Again, significant improvement in measurement precision using ID is evident compared to external and standard additions calibrations, even when employing a Rh internal standard. In general, preci-sions in measured concentrations of Ni, Cd, and Pb using conventional liquid sample introduction are significantly better than those obtained with LA.
It is recognized that isotope dilution is capable of achieving high accuracy and precision of results as a ratio, rather than an absolute intensity measurement, is used for quantitation of the analyte concentration. Significant improvements in measurement precision using ID with both LA and conventional liquid introduc-tion are evident. However, measurement precision with LA using ID remains 4-7-fold inferior to results obtained for ID with liquid sample introduction. This may be due to the difference in counting statistics achievable with the two sample introduction systems for ratio measurements, since much lower absolute sensitivities characterize the water sample using LA, as discussed below.
Determination of Total Se in Yeast Digest Using ID with LA and Liquid Sample Introduction. A yeast digest spiked with
82Se was characterized by dried-droplet LA-ICPMS. Because of the high Se concentration in this sample, counting statistics should not present a major limitation in precisions achievable with LA, as noted with analysis of the drinking water. The yeast sample digestion procedure has been described previously.33Because of the high natural salt content of the yeast extract, no additional LA matrix was required. To investigate the effect of counting statistics on precision obtained with the two sample introduction approaches, a single solution of digested yeast was used and five replicate measurements were conducted with LA and liquid sample introduction ICPMS. A concentration of 2010 ( 10 µg g-1 (one standard deviation, n ) 5) with an RSD of 0.50% was obtained for Se in the yeast digest using the78Se/82Se with LA, in agreement with a value of 2012 ( 8 µg g-1(one standard deviation, n ) 5) and RSD of 0.40% generated using liquid sample introduction. Measurement precision using LA is thus comparable to that obtained with liquid sample introduction, suggesting that the disparate performance characterizing the drinking water was, in fact, due to counting statistics.
It is worth noting that precision and accuracy obtained in this study using dried-droplet LA-ICPMS are enhanced relative to previously reported ID-based results15-19obtained with conven-tional LA of solid samples. This arises for two reasons: (a) it is virtually impossible to achieve a completely homogeneous isoto-pically spiked powder or solid, and this is readily produced with a liquid, and (b) fractionation during the LA event is absent with the dried-droplet approach because quantitative removal of the sample is achieved (this does not eliminate possible subsequent fractionation occurring during transport of the aerosol to the ICP or within the plasma/sampling interface).
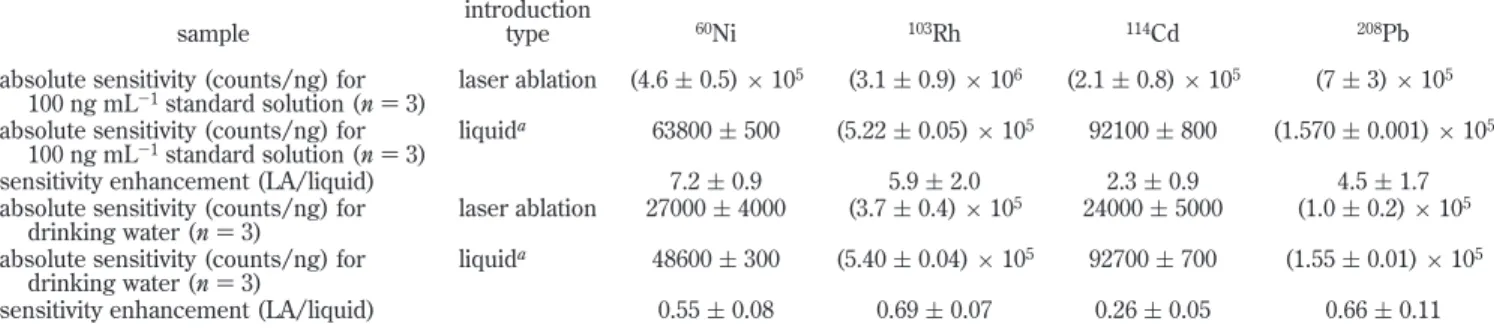
Figures of Merit. Sensitivity Enhancement. Peak height signals
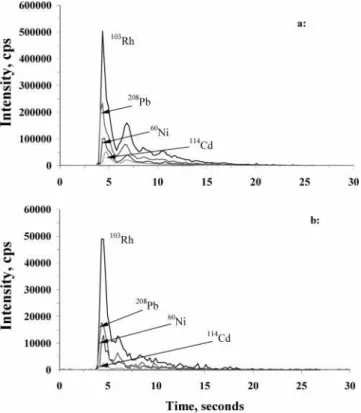
from a 20 µL deposit of a 100 ng mL-1standard solution containing 20 µg mL-1NaAc were about 4-fold higher with dried-droplet LA than steady-state intensities arising from pneumatic nebulization sample introduction. It is of interest to compare the absolute sensitivity of laser ablation with liquid sample introduction under the chosen experimental conditions. Absolute sensitivities for Ni, Rh, Cd, and Pb using laser ablation were estimated from peak area intensities arising from ablation of a dried 20 µL volume of a 100 ng mL-1standard solution. Similarly, absolute sensitivities (i.e. total counts/ng) for liquid sample introduction were estimated by integrating steady-state signals for 15 s and normalizing for the estimated absolute amount of analyte introduced in this time period. Results are summarized in Table 4. Improvements of 2-7-fold in absolute sensitivities are evident with laser ablation sample introduction. The transport efficiency with LA lies in the range 4-14% if a 2% transport efficiency is assumed for a conventional liquid sample introduction. This efficiency is generally lower than the 20-40% reported for ETV.28,29Unfortunately, such sensitivity enhancements were not achieved with the drinking water sample, as shown in Table 4. This may be due to the much larger sample spot size (500 µm versus 150 µm for the standard solution), as evident in Figure 2. As a result, a 10-fold suppression in analyte intensities occurred with the drinking water compared to a calibration standard solution under otherwise similar concentra-tions. This is evident from a comparison of the transient signals shown in Figure 3.
Detection Limits. Detection limits achieved using the three
calibration methods were estimated from replicate measurements of three blank samples based on 3 times the standard deviation of measured concentrations. Results are summarized in Table 3. Similar detection limits, in the range of 0.04-0.09 ng mL-1, were
(33) Yang, L.; Mester, Z.; Sturgeon, R. E. Anal. Chem. 2004, 76, 5149-5156.
Table 4. Estimated Absolute Sensitivities for Laser Ablation and Liquid Sample Introduction sample
introduction
type 60Ni 103Rh 114Cd 208Pb
absolute sensitivity (counts/ng) for 100 ng mL-1standard solution (n ) 3)
laser ablation (4.6 ( 0.5) × 105 (3.1 ( 0.9) × 106 (2.1 ( 0.8) × 105 (7 ( 3) × 105
absolute sensitivity (counts/ng) for 100 ng mL-1standard solution (n ) 3)
liquida 63800 ( 500 (5.22 ( 0.05) × 105 92100 ( 800 (1.570 ( 0.001) × 105
sensitivity enhancement (LA/liquid) 7.2 ( 0.9 5.9 ( 2.0 2.3 ( 0.9 4.5 ( 1.7
absolute sensitivity (counts/ng) for drinking water (n ) 3)
laser ablation 27000 ( 4000 (3.7 ( 0.4) × 105 24000 ( 5000 (1.0 ( 0.2) × 105
absolute sensitivity (counts/ng) for drinking water (n ) 3)
liquida 48600 ( 300 (5.40 ( 0.04) × 105 92700 ( 700 (1.55 ( 0.01) × 105
sensitivity enhancement (LA/liquid) 0.55 ( 0.08 0.69 ( 0.07 0.26 ( 0.05 0.66 ( 0.11
aAbsolute sensitivities for liquid sample introduction were estimated by integrating steady-state signals for 15 s normalized for the absolute
amount of analyte introduced in this time period at a sample uptake rate of 1.2 mL min-1with overall efficiency of 2%.
obtained with all three different calibration strategies and are adequate for the determination of these analytes in drinking water. In general, method detection limits for Ni, Cd, and Pb using conventional liquid sample introduction are significantly better than those obtained with LA.
Sample Throughput. Sample throughput using standard liquid
introduction is limited by the time needed for sample uptake and washout, which may typically require 2-5 min per sample. ETV provides similar sample throughput because of the temperature program needed for drying, pyrolysis, and vaporization of samples. Using LA and dry plasma conditions, coupled with improved sample introduction efficiency, rapid sample throughput is pos-sible. As evident from this study, the peak width at half-maximum of the transient signal arising from a well-focused spot ablated by two laser pulses is on the order of a few seconds. Sample throughput can be as high as one sample every 15 s (or in the range of 250 samples per hour). Furthermore, spotting/drying of aqueous samples can be easily automated, as there are many high-throughput devices already used with MALDI sources that can be harnessed for this purpose.
CONCLUSIONS
Standard additions or isotope dilution calibration can be used for the quantitative determination of Ni, Cd, and Pb in aqueous
samples using LA of dried droplets for sample introduction. Although more precise results are obtained using ID, measure-ment precision obtained with LA-ICPMS remains poorer than that achieved using liquid sample introduction because of limitations imposed by counting statistics due to the finite mass of analyte ablated. A good precision of 0.50% (for Se in yeast extract) can be obtained without this limitation. Nevertheless, the proposed method yields sufficiently low detection limits (0.05-0.09 ng mL-1) to make it well-suited to the quantitation of Ni, Cd, and Pb in the drinking water sample studied here.
Potentially, this technology offers an alternative to ETV for sample introduction, especially for those elements that are difficult to atomize or prone to carbide formation. The dried-droplet LA sample introduction approach may also prove useful for direct analysis of oils or fatty compounds that would otherwise require extensive and time-consuming sample preparation. A logical extension of this study is the use of a ICP-TOF mass analyzer for the simultaneous measurement of an increased number of elements, which is clearly a limitation with the sequential mass analyzer used in this study.
ACKNOWLEDGMENT
The authors are grateful to J. W. H. Lam of the Institute for National Measurement Standards (National Research Council Canada, Ottawa, Canada) for help in setting up the LA system.
Received for review November 22, 2004. Accepted February 23, 2005.
AC048275A Figure 2. Laser ablation video images of dried droplets, 20 µL
deposit.
Figure 3. Transient signals obtained by LA-ICPMS: (a) 20 µL deposit of a 20 ng mL-1standard solution containing 10 ng mL-1Rh as an internal standard; (b) 20 µL deposit of SIM.8.10P drinking water containing 10 ng mL-1Rh internal standard.