1
Laboratory of Hydraulics, Hydrology and Glaciology (VAW), ETH Zurich, Zurich, Switzerland.
2Department of Geosciences, University of Fribourg, Fribourg, Switzerland.
3Geophysical Institute, University of Alaska Fairbanks, Fairbanks, AK, USA.
4Department of Earth Sciences, Uppsala University, Uppsala, Sweden. *e-mail: [email protected]
Worldwide glacier retreat and associated future runoff changes raise major concerns over the sustainability of global water resources
1–4, but global-scale assessments of glacier decline and the resulting hydrological consequences are scarce
5,6. Here we compute global glacier runoff changes for 56 large-scale glacierized drainage basins to 2100 and analyse the glacial impact on streamflow. In roughly half of the investigated basins, the modelled annual glacier runoff continues to rise until a maximum (‘peak water’) is reached, beyond which runoff steadily declines. In the remaining basins, this tipping point has already been passed. Peak water occurs later in basins with larger glaciers and higher ice-cover fractions. Typically, future glacier runoff increases in early summer but decreases in late summer. Although most of the 56 basins have less than 2% ice coverage, by 2100 one-third of them might experience runoff decreases greater than 10%
due to glacier mass loss in at least one month of the melt sea- son, with the largest reductions in central Asia and the Andes.
We conclude that, even in large-scale basins with minimal ice- cover fraction, the downstream hydrological effects of contin- ued glacier wastage can be substantial, but the magnitudes vary greatly among basins and throughout the melt season.
Glacierized large-scale drainage basins cover 26% of the global land surface outside Greenland and Antarctica and are populated by almost one-third of the world’s population
7. Melt waters from glaciers contribute to and modulate downglacier streamflow, which affects freshwater availability, hydropower operations, sediment transport and aquatic ecosystems
2,3,8. Glacier runoff typically shows a distinct seasonality with a minimum in the snow-accumulation season (or dry season in the tropics) and a pronounced maximum in the melt season (or wet season) compared with ice-free basins.
Thus, glacier melt water can compensate for seasons and years of otherwise low flow or droughts in lowland areas downstream of gla- cierized mountain regions
1,6.
Mountain glaciers around the globe have responded strongly to recent climate change and are expected to experience continued mass loss and retreat throughout the twenty-first century
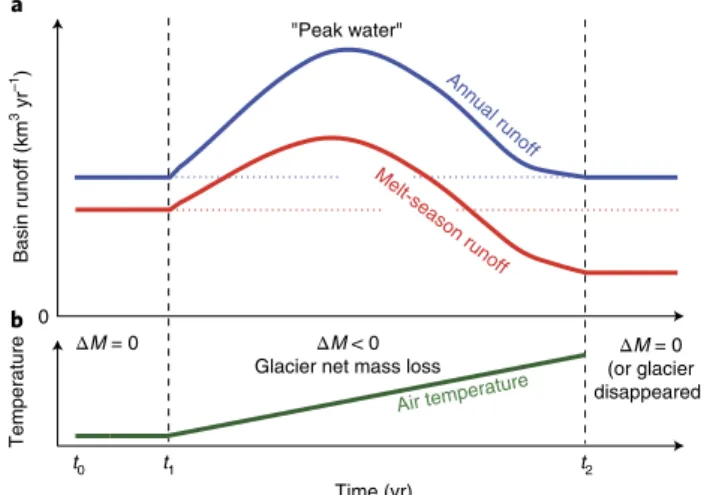
9–11. As gla- ciers recede, water is released from long-term glacial storage. Thus, annual glacier runoff volume typically increases until a maximum is reached, often referred to as ‘peak water’
12, beyond which runoff decreases because the reduced glacier area cannot support rising meltwater volumes anymore
13. As a glacier retreats and disappears, or reaches a new equilibrium (balanced mass budget), annual run- off from the initially glacierized area may return to its initial value prior to glacier retreat (Fig. 1). In contrast, runoff during the melt season is expected to fall below the initial value, because the glacier
provides less and less melt water from long-term storage, which impacts seasonal freshwater availability
14,15.
Many studies have investigated the effects of climate change on glacier runoff using observations or modelling, with a recent focus on High Mountain Asia
14,16,17and the Andes
18–20. The degree to which glacier runoff contributes to downglacier river runoff var- ies greatly from basin to basin
21–23and throughout the year, with glacier contributions in individual months that reach > 25%, even in catchments with < 1% glacierization
24,25. Most studies find that peak water has already been reached or passed
19,20,26or is expected to occur in the coming two or three decades
14,15,17,27,28. However, it remains unclear how representative these results are globally, as most glacio-hydrological studies have been local in scale, typi- cally focused on highly glacierized headwaters
14–16,19,20,26–28or indi- vidual regions
4,23,24. Notable exceptions are the large-scale studies by Kaser et al
3. and Schaner et al.
25, but they do not provide any future projections or analyse peak water. Another study projected runoff from all glaciers on Earth until 2100, but did not consider changes
Global-scale hydrological response to future glacier mass loss
Matthias Huss
1,2* and Regine Hock
3,4Basin runoff (km3 yr–1)Temperature
ΔM = 0 ΔM < 0 Glacier net mass loss
t0 t1 t2
Air temperature
Time (yr)
a
b
ΔM = 0(or glacier disappeared) Melt-season runoff
Annual runoff
"Peak water"
0
Fig. 1 | Schematic illustration of the changes in runoff from a glacierized basin in response to continuous atmospheric warming. The glacier is initially in balance, that is, the annual glacier mass budget Δ M = 0, and it is assumed that all the components of the water balance, except for glacier-storage change, remain unaltered. The changes in melt-season runoff illustrated here are typical of glaciers in climates with a pronounced melt and accumulation season. See Supplementary Material for more information on the concept of peak water.
http://doc.rero.ch
Published in "Nature Climate Change 8 (2): 135–140, 2018"
which should be cited to refer to this work.
at the drainage-basin scale
5. Hence, a global-scale quantification of peak water and the contribution of glacier runoff change to the macroscale drainage basin runoff throughout the twenty-first cen- tury based on a consistent methodology is still lacking.
Here we examine annual and monthly glacier runoff changes, their contribution to large-scale basin runoff and peak water in all 56 glacierized macroscale (> 5,000 km
2) drainage basins on Earth (outside Antarctica and Greenland) with at least 30 km
2of ice cover and > 0.01% glacierization (Supplementary Table 1) for the period 1980–2100. We used the Global Glacier Evolution Model (GloGEM)
11to compute glacier mass changes and associated runoff from each individual glacier in all the basins. The model accounts for all the relevant glaciological processes, which include mass accumulation and loss, and changes in the glacier extent and surface elevation. For each basin, we computed glacier run- off defined as the water that leaves the initially glacierized area, and thus include runoff from ice-free areas once the glaciers have retreated (Methods).
The glacier model is driven with monthly near-surface air tem- perature and precipitation data from the ERA-Interim Reanalysis and results of the fifth phase of the Coupled Model Intercomparison Project (CMIP5) for the past and future, respectively (Methods).
We use projections from 14 Global Circulation Models (GCM;
Supplementary Table 2) forced by three emission scenarios (Representative Concentration Pathways, RCP). Peak emissions are expected to occur at around 2020 (RCP2.6), 2050 (RCP4.5) and after 2100 (RCP8.5); RCP2.6 is the closest scenario to the targets of the Paris climate agreement of 2015. Projected air temperature increases between the periods 1990–2010 and 2080–2100, averaged over all analysed basins (multi-GCM mean ± 1 standard deviation), range from 1.6 ± 1.1 °C (RCP2.6) to 5.4 ± 2.2 °C (RCP8.5).
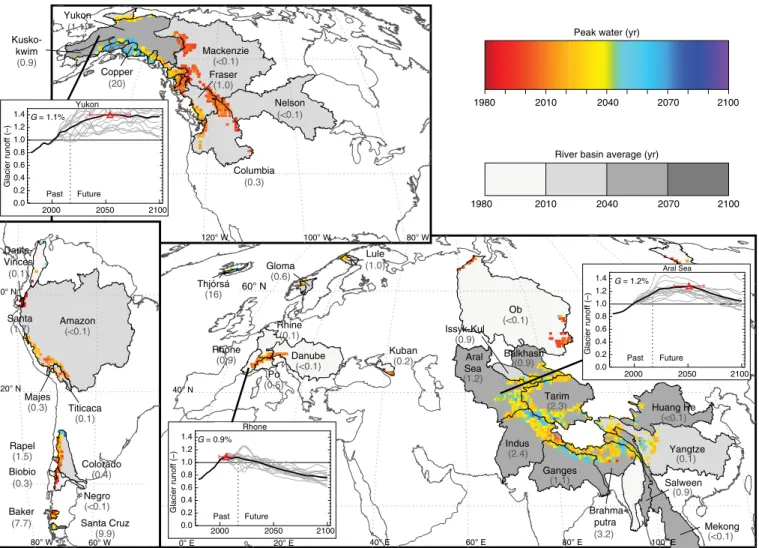
Between 2010 and 2100, the total glacier volume in all the investigated basins is projected to decrease by 43 ± 14% (RCP2.6), 58 ± 13% (RCP4.5) and 74 ± 11% (RCP8.5). For the mid-range scenario RCP4.5, basin-specific glacier-volume reductions (multi- GCM means) range from 37% to 99%. The associated annual gla- cier runoff changes vary greatly among the basins. Although peak water has already been reached in 45% of the basins (year 2017) and annual runoff is expected to decline, runoff is projected to continue to rise beyond 2050 in 22% of the basins (Fig. 2). Increases in the runoff until peak water relative to 1980–2000 can be substantial, and exceed 50% in some basins (Supplementary Table 3). Average runoff increase for the 56 basins is 26% for RCP2.6, 28% for RCP4.5
40° N
0° E 20° E 40° E 60° E 80° E 100° E
60° N
120° W 100° W 80° W
60° N
80° W 60° W
Peak water (yr)
1980 2010 2040 2070 2100
River basin average (yr)
1980 2010 2040 2070 2100
0.0 0.2 0.4 0.6 0.8 1.0 1.2 1.4
Yukon
Glacier runoff (–)
2000 2050 2100
Past Future G = 1.1%
0.0 0.2 0.4 0.6 0.8 1.0 1.2 1.4
Aral Sea
Glacier runoff (–)
2000 2050 2100
Past Future G = 1.2%
0.0 0.2 0.4 0.6 0.8 1.0 1.2 1.4
Rhone
Glacier runoff (–)
2000 2050 2100
Past Future G = 0.9%
Amazon (<0.1) Santa
(1.7)
Colorado (0.4) Rapel
(1.5)
Negro (<0.1) Santa Cruz
(9.9) Titicaca
(0.1) Majes
(0.3) Daule- Vinces (0.1)
Baker (7.7) Biobio
(0.3)
Mackenzie (<0.1) Copper
(20)
Nelson (<0.1) Fraser
(1.0)
Columbia (0.3) Yukon
(1.1) Kusko-
kwim (0.9)
Ob (<0.1) Thjórsá
(16)
Gloma (0.6)
Rhine (0.1)
Danube
(<0.1) Aral
Sea (1.2) Rhone
(0.9) Po (0.5)
Kuban (0.2)
Huang He (<0.1) Indus
(2.4) Yangtze
(0.1)
Mekong (<0.1) Brahma-
putra (3.2) Ganges
(1.1) Salween
(0.9) Tarim
(2.3) Balkhash
(0.9) Issyk-Kul
(0.9) Lule
(1.0) 0° N
20° N
Fig. 2 | Peak water in all the glacierized macroscale drainage basins. Colours show the modelled year of peak water computed from 11-year moving averages of annual glacier runoff from all the glaciers located in the 56 investigated drainage basins, aggregated in 0.5×0.5° grid cells. Peak water is also shown with grey scales for all the macroscale basins, classified in 30-year intervals. The results refer to runoff from the initially glacierized area, and are based on the multimodel mean of 14 GCMs and the RCP4.5 emission scenario. The numbers in brackets below the basin names refer to basin glacierization in per cent. The insets show the modelled annual glacier runoff normalized with the average runoff in 1990–2010 for three selected basins.
Triangles depict peak water (±standard deviation), thin lines show results for individual GCMs and G denotes the percentage ice cover.
http://doc.rero.ch
and 36% for RCP8.5 (multi-GCM mean). The largest increases tend to occur in regions where peak water is reached late in the century (Supplementary Fig. 1).
The timing of peak water shows significant positive correlations with the basin’s glacier area, the present fraction of ice cover and basin latitude (p < 0.01; Supplementary Fig. 2), the latter due to a higher abundance of large glaciers at high latitudes. For RCP4.5, basins with large glaciers and high glacierization (for example, Susitna and Jökulsá) tend to reach peak water towards the end of the twenty-first century (Fig. 2). In contrast, in basins dominated by smaller glaciers (for example, in western Canada, central Europe and South America), peak water has passed or is expected to occur within the next decade, consistent with local studies in these regi ons
19,20,26,27. In most basins fed by High Mountain Asia glaciers (for example, the Aral Sea, Indus, Tarim and Brahmaputra), annual gla- cier runoff is projected to rise until roughly the middle of the century, followed by steadily declining glacier runoff thereafter. However, we find a considerable small-scale variability in this region, with peak water around 2070 in parts of the Indus headwaters and around the middle of the century in most headwaters of the Ganges (southern flanks of the Himalayas), whereas peak water has already passed, or is close to doing so, in the adjacent headwaters of the Brahmaputra (interior of the Himalayas). Peak water variability in High Mountain Asia is attributed to a combination of glacier size and a projected increase in summer precipitation in monsoon-dominated regions.
Large intrabasin variability is also found in Alaska. In both cases, spatially coherent subregions with later peak waters coincide with areas dominated by larger glaciers and vice versa. This indicates that some headwaters of a basin might experience an earlier decline of the annual runoff than does the basin as a whole.
Peak water is generally reached later under emission sce- narios, which implies a stronger warming ( ∼ 15 years for RCP8.5 compared with RCP2.6; Supplementary Table 3). The enhanced atmospheric warming generates sufficiently large melt rates to com- pensate for a shrinking glacier area, and thus delays runoff decline.
Modelled spatial patterns in peak waters broadly agree with local studies in the European Alps
27, the Andes
19,20and High Mountain Asia
14–16,28, which provides confidence in the robustness of our global-scale estimates.
To quantify changes in future glacier runoff, we computed monthly changes by the middle (averaged over 2040–2060) and the end (2080–2100) of the century relative to the reference period 1990–2010. We focused on the melt season (June to October and December to April for the northern and southern hemispheres, respectively). The projected glacier runoff changes for both periods show a strong variability, as well as large differences among basins (Fig. 3). For example, the basins’ glacier runoff changes range from + 38% to − 76% (multi-GCM mean, RCP4.5) in August (northern hemisphere), the month when currently most basins have their seasonal maximum (Supplementary Table 4). This indicates that a future runoff response will be highly diversified and will strongly depend on basin characteristics.
Glacier runoff is projected to rise in June (December in the southern hemisphere) in almost all the basins over both investigated periods. In contrast, it is mostly reduced in August and September (Fig. 3). Basins in South America show relatively consistent runoff decreases in all months of the austral summer. For most of the 56 basins and months, the sign of change remains unaltered between the two investigated periods. Projected glacier runoff reductions by 2090 are larger than those by the middle of the century, which is con- sistent with peak water being reached mostly before 2050 (Fig. 2).
By the end of the twenty-first century, the seasonal glacier runoff maximum is reduced in 93% of the basins compared with the 1990–2010 average, and runoff is less concentrated dur- ing the melt season (Supplementary Fig. 3). In addition, seasonal
Indus Brahmaputra Aral Sea Ganges Balkhash Yangtze Salween Issyk-Kul Ob Mekong Kamchatka Huang He Indigirka Kuban Irrawaddy Tarim
Asia
Thjórsá Jökulsá Rhone Oelfusá Danube Po Rhine Gloma Lule Kalixaelven Dramselv
Europe
Copper Yukon Susitna Stikine Fraser Columbia Taku Mackenzie Nass Kuskokwim Skeena Nelson Skagit Nushagak Colville Alsek
North America
2050 2090June 2050 2090July
2050 2090Aug.
Sept.
2050 2090 2050 2090Oct.
Santa Cruz Baker Amazon Colorado Rapel Santa Titicaca Biobio Negro Majes Daule-Vinces Magdalena
South America
Clutha
NZ
Dec 2050 2090
Jan 2050 2090
Feb 2050 2090
Mar 2050 2090
Apr 2050 2090
5% 20% 60%
Positive Negative No change (±5%)
10% 40%
Fig. 3 | Monthly glacier runoff changes over the two periods 2000–2050 and 2000–2090. Changes are computed from 20-year averages centred around these years. The results refer to multi-GCM means and emission scenario RCP4.5. The circle area scales linearly with runoff change. Basins are listed for each continent in the order of decreasing glacier area. For the Santa basin (inner tropics), large glacier-runoff reductions ( − 21 to − 59%) are found between June and October. NZ, New Zealand.
http://doc.rero.ch
runoff maxima are shifted towards earlier in the season in almost all the basins with a trend of roughly 0.4 days per percentage gla- cier-area loss (Supplementary Fig. 4). Similar to peak water (Fig. 2), glacier runoff changes typically show spatially coherent patterns.
Substantial intrabasin variability, which includes large positive and negative runoff changes within the same basin, is projected for some regions and months (for example, Alaska and High Mountain Asia;
Supplementary Figs. 5 and 6).
We also investigated how the changes in monthly glacier run- off affect the total runoff downstream for each macroscale basin.
To accomplish this, we first shifted each month’s glacier runoff by a basin-specific water transit time, and calculate monthly gla- cier runoff changes, Δ Q
g′, by 2080–2100 relative to the reference period 1990–2010. We then computed the ratio of Δ Q
g′and the large-scale basin runoff, Q
basin, for July to October (January to April for the southern hemisphere), as a proxy for the importance of an increase or reduction in glacier runoff in comparison with the overall basin runoff, which is based on observations (Methods).
We do not account for future changes in basin runoff (for example, due to changes in precipitation, evapotranspiration, groundwater recharge and land cover). Hydrological studies indicate both posi- tive and negative changes up to the end of the century with a large spatial variability
29, but uncertainties are high. We assessed the effect of our assumptions on future basin runoff using sensitivity
tests (Methods). We further assumed that glacier runoff volumes remain unaltered on their path through the basin, although the sig- nal will be increasingly modified with distance from the headwaters due to processes such as groundwater exchange or human water use.
Nevertheless, this approach suffices to provide a first-order approxi- mation of the magnitude of glacier runoff changes relative to basin runoff. By relating glacier runoff to total flow at each basin’s lowest point, we also neglect any sub-basin differences. The relative con- tribution of glacier runoff changes can be expected to increase with proximity to the glacierized headwaters.
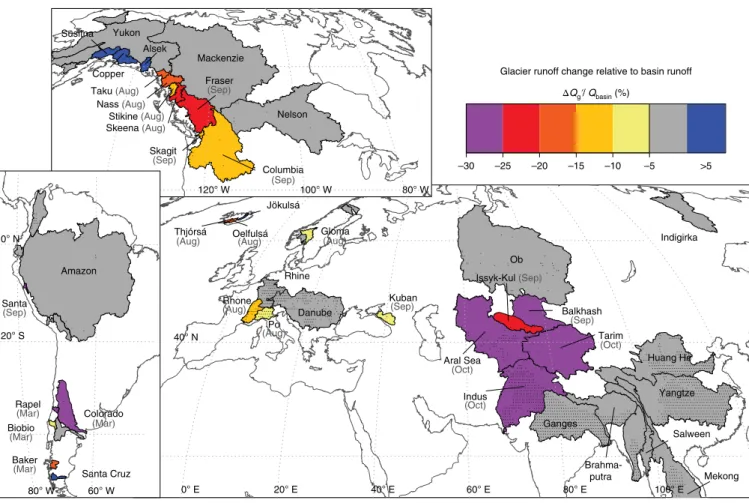
For about half of the basins, the glacier runoff change between 2000 and 2090 (RCP4.5) accounts for less than 5% of the basin run- off throughout the melt season (Fig. 4, Supplementary Figs. 7 and 8, and Supplementary Table 5) despite large relative changes in glacier runoff in some cases (Fig. 3). This indicates a negligible hydrologi- cal impact of glacier wastage on the monthly basin runoff by the end of the century. However, 19 of the 56 investigated basins, spread across the globe, experience at least one melt-season month with a glacier runoff reduction that exceeds 10% of the basin runoff (five basins prior to 2050). For 13 of these 19 basins, glacierization is less than 2.5%, and less than 10% in all but two (Figs. 4 and 5). This indicates that future glacier changes can have a substantial impact on monthly runoff at large scales, even in basins with an extremely low ice coverage.
Ob Thjórsá
(Aug)
Gloma (Aug)
Rhine
Danube
Aral Sea (Oct) Rhone
(Aug) (Aug)Po
Kuban (Sep)
Huang He
(Oct)
Yangtze
Mekong Brahma-
putra Ganges
Salween Tarim
(Oct) Balkhash
(Sep) Yukon
Mackenzie
Nelson (Sep)
Columbia (Sep) 120° W
40° N
0° E 20° E 40° E 60° E 80° E 100° E
100° W 80° W
Amazon
Santa (Sep)
Colorado (Mar) Rapel
(Mar)
Santa Cruz
–25 –15 –5
ΔQgʹ/ Qbasin (%) Alsek
Skagit (Sep) Skeena (Aug) Taku (Aug)
Nass (Aug) Stikine (Aug)
Jökulsá Oelfulsá
(Aug)
Issyk-Kul (Sep)
Biobio (Mar) Baker (Mar)
Copper Susitna
Indigirka
–10 >5
–20 –30
Fraser
0° N
20° S
80° W 60° W
Glacier runoff change relative to basin runoff
Indus
Fig. 4 | Contribution of future glacier runoff changes (between 2000 and 2090) to the macroscale basin runoff in all 56 investigated basins. The ratio of glacier runoff change to basin runoff, Δ Q Q
g′∕
basin, is evaluated for the period July to October (January to April for the southern hemisphere, and throughout the year in the tropics). For basins with substantial glacier runoff decreases ( Δ Q Q
g′∕
basin< − 5%) in at least one month, the ratio refers to the month (given in brackets below the basin names) with the largest reduction in glacier runoff. Basins with negligible glacier impact ( Δ Q Q
g′∕
basin< 5%) are shown in grey, and the remaining basins, which show glacier runoff increases that exceed 5% in at least one month, in dark blue. The results refer to multi-GCM means and RCP4.5. Small dots refer to population density > 100km
−2on a 0.5×0.5° grid as an indicator for potential downstream socio-environmental impacts.
http://doc.rero.ch
The largest relative reductions in basin runoff due to glacier runoff change (that is, the most-negative monthly Δ Q
g′/ Q
basin) are projected in central Asian basins (for example, Indus, Aral Sea and Tarim) in September or October, and in South America (for exam- ple, Rapel and Colorado) in February and March (Figs. 4 and 5).
During these months, a low basin runoff typically coincides with melt-induced glacier runoff maxima (accounting for water travel time). In a future climate, the role of glaciers in compensating a potential low flow in these critical months is diminished. In con- trast, basins in North America (for example, Copper, Alsek) and Iceland (Jökulsá) show substantial glacier runoff increases relative to basin runoff in all four summer months.
Our global-scale analysis illustrates robust patterns of large spatio-temporal variability in the hydrological response of the pro- jected twenty-first century glacier recession in macroscale drain- age basins around the globe. Although the changes in runoff of the Earth’s largest glacier-fed rivers due to glacier wastage are small for many basins, glacier runoff reductions are substantial (> 10%
of basin runoff) in at least one month of the melt season in more than a third of the 56 investigated basins, despite low ice-cover frac- tions. These basins, especially where combined with high popula- tion densities (Fig. 4), are possible regions of concern, and should be a focus of further glacio-hydrological research, ideally combined with cross-disciplinary approaches that include the human impacts on glacier runoff variability
30.
Methods
Methods, including statements of data availability and any asso- ciated accession codes and references, are available at https://doi.
org/10.1038/s41558-017-0049-x.
References
1. Barnett, T. P., Adam, J. C. & Lettenmaier, D. P. Potential impacts of a warming climate on water availability in snow-dominated regions.
Nature 438, 303–309 (2005).
2. Immerzeel, W. W., van Beek, L. P. H. & Bierkens, M. F. P. Climate change will affect the Asian water towers. Science 328, 1382–1385 (2010).
3. Kaser, G., Grosshauser, M. & Marzeion, B. Contribution potential of glaciers to water availability in different climate regimes. Proc. Natl Acad. Sci. USA
107, 20223–20227 (2010).4. Pritchard, H. D. Asia’s glaciers are a regionally important buffer against drought. Nature 545, 169–174 (2017).
5. Bliss, A., Hock, R. & Radić, V. Global response of glacier runoff to twenty-first century climate change. J. Geophys. Res. Earth Surf. 119, 717–730 (2014).
6. Radić, V. & Hock, R. Glaciers in the Earth’s hydrological cycle: assessments of glacier mass and runoff changes on global and regional scales. Surv. Geophys.
35, 813–837 (2014).
7. Beniston, M. Climatic change in mountain regions: a review of possible impacts. Clim. Chang. 59, 5–31 (2003).
8. Xu, J. et al. The melting Himalayas: cascading effects of climate change on water, biodiversity, and livelihoods. Conserv. Biol. 23, 520–530 (2009).
9. Marzeion, B., Jarosch, A. H. & Hofer, M. Past and future sea-level change from the surface mass balance of glaciers. Cryosphere 6, 1295–1322 (2012).
10. Radić, V. et al. Regional and global projections of twenty-first century glacier mass changes in response to climate scenarios from global climate models.
Clim. Dyn. 42, 37–58 (2014).
11. Huss, M. & Hock, R. A new model for global glacier change and sea-level rise. Frontiers in Earth Science 3, 54 (2015).
12. Gleick, P. H. & Palaniappan, M. Peak water limits to freshwater withdrawal and use. Proc. Natl Acad. Sci. USA 107, 11155–11162 (2010).
13. Jansson, P., Hock, R. & Schneider, T. The concept of glacier storage—a review.
J. Hydrol. 282, 116–129 (2003).
14. Immerzeel, W. W., Pellicciotti, F. & Bierkens, M. F. P. Rising river flows throughout the twenty-first century in two Himalayan glacierized watersheds.
Nat. Geosci. 6, 742–745 (2013).
15. Ragettli, S., Immerzeel, W. W. & Pellicciotti, F. Contrasting climate change impact on river flows from high-altitude catchments in the Himalayan and Andes Mountains. Proc. Natl. Acad. Sci. USA 113, 9222–9227 (2016).
–100 –50 0 50
Asia Europe North America South America
a
–40 –20 0 20
20 40 60 80
Indus Tarim Kuban Aral Sea Issyk-Kul Balkhash Jökulsá Gloma Po Thjórsá Rhone Oelfusá Copper Susitna Alsek Columbia Skagit Nass Taku Stikine Fraser Skeena Santa Cruz Biobio Baker Colorado Santa Rapel
c
ΔQgʹ (%)ΔQgʹ / Qbasin (%)Latitude (°) 0.1% 3% 20%1%
Jul Aug Sep Oct
Jan Feb
Mar Apr
b
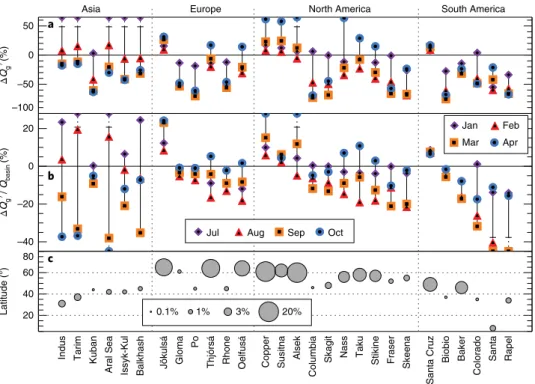
Fig. 5 | Projected glacier runoff changes and contribution to basin-scale runoff. The results are based on glacier runoff changes over 2000–2090 (multi- GCM mean, RCP4.5) for July to October (January to April for the southern hemisphere). For the Santa basin (inner tropics) the results refer to the months July to October as the largest glacier runoff reductions are found in the austral winter (dry season). a, Relative runoff changes from the initially glacierized area (adjusted by basin-specific water-transit times to the basin’s mouth), Δ Q
g′. b, Glacier runoff changes relative to the macroscale basin runoff, Δ Q Q
g′∕
basin. Vertical lines connect the minimum and maximum changes. c, Glacierization as a function of geographic latitude. The results are shown for each continent in the order of decreasing Δ Q Q
g′∕
basin. Only the 28 basins in which Δ Q Q
g′∕
basinexceeds 5% for at least one of the four months are shown.
http://doc.rero.ch
16. Sorg, A., Huss, M., Rohrer, M. & Stoffel, M. The days of plenty might soon be over in glacierized Central Asian catchments. Environ. Res. Lett. 9, 104018 (2014).
17. Duethmann, D., Menz, C., Jiang, T. & Vorogushyn, S. Projections for headwater catchments of the Tarim River reveal glacier retreat and decreasing surface water availability but uncertainties are large. Environ. Res. Lett. 11, 054024 (2016).
18. Juen, I., Kaser, G. & Georges, C. Modelling observed and future runoff from a glacierized tropical catchment (Cordillera Blanca, Perú). Glob. Planet.
Chang. 59, 37–48 (2007).
19. Baraer, M. et al. Glacier recession and water resources in Peru’s Cordillera Blanca. J. Glaciol. 58, 134–150 (2012).
20. Frans, C. et al. Implications of decadal to century scale glacio-hydrological change for water resources of the Hood River basin, OR, USA. Hydrol.
Process. 30, 4314–4329 (2016).
21. Lambrecht, A. & Mayer, C. Temporal variability of the non-steady contribution from glaciers to water discharge in western Austria. J. Hydrol.
376, 353–361 (2009).
22. Comeau, L. E. L., Pietroniro, A. & Demuth, M. N. Glacier contribution to the North and South Saskatchewan Rivers. Hydrol. Process. 23, 2640–2653 (2009).
23. Neal, E. G., Hood, E. & Smikrud, K. Contribution of glacier runoff to freshwater discharge into the Gulf of Alaska. Geophys. Res. Lett. 37, L06404 (2010).
24. Huss, M. Present and future contribution of glacier storage change to runoff from macroscale drainage basins in Europe. Water Resour. Res. 47, W07511 (2011).
25. Schaner, N., Voisin, N., Nijssen, B. & Lettenmaier, D. P. The contribution of glacier melt to streamflow. Environ. Res. Lett. 7, 034029 (2012).
26. Stahl, K., Moore, R. D., Shea, J. M., Hutchinson, D. & Cannon, A. J. Coupled modelling of glacier and streamflow response to future climate scenarios.
Water Resour. Res. 44, W02422 (2008).
27. Farinotti, D., Usselmann, S., Huss, M., Bauder, A. & Funk, M. Runoff evolution in the Swiss Alps: projections for selected high-alpine catchments based on ENSEMBLES scenarios. Hydrol. Process. 26, 1909–1924 (2012).
28. Lutz, A., Immerzeel, W., Shrestha, A. & Bierkens, M. Consistent increase in High Asia’s runoff due to increasing glacier melt and precipitation. Nat. Clim.
Chang. 4, 587–592 (2014).
29. Kundzewicz, Z. W. et al. The implications of projected climate change for freshwater resources and their management. Hydrol. Sci. J. 53, 3–10 (2008).
30. Carey, M. et al. Impacts of glacier recession and declining meltwater on mountain societies. Ann. Am. Assoc. Geogr. 107, 350–359 (2017).
Acknowledgements
We thank the Randolph Glacier Inventory consortium for providing global glacier inventory data, the European Centre for Medium-range Weather Forecasts for the ERA-interim Reanalysis and the GRDC for discharge data and drainage-basin outlines.
We acknowledge the World Climate Research Programme’s Working Group on Coupled Modelling, which is responsible for CMIP, and we thank the climate modelling groups (listed in Supplementary Table 2) for producing and making available their model output. R.H acknowledges funding from grants from the National Aeronautics and Space Administration (NNX17AB27G and NNX11AO23G). A. Aschwanden, D. Farinotti, A. Johnsson, D. Rounce and M. Truffer commented on a previous version of the manuscript.
Author contributions
M.H. gathered and prepared the data, performed all the calculations and made the figures. He developed the model and modelling procedure with input from R.H. M.H.
and R.H. contributed to the development of the analyses and figures and the discussion of results, and shared the writing of the paper.
Competing interests
The authors declare that they have no competing financial interests.
http://doc.rero.ch
Methods
Glacier data. Glacier outlines of all ∼ 113,000 glaciers in the investigated basins
are taken from the globally complete Randolph Glacier Inventory v4.0 (ref.
31). The glaciers cover a total area of 169,000 km
2, which corresponds to 34% of total glacier area on Earth outside Greenland and Antarctica. The remaining 66% are mostly located in close proximity to the ocean, and hence glacierized drainage basins are
<5,000 km
2. The vast majority of these glaciers is located in the High Arctic and have limited importance for freshwater availability. The glacier outlines refer roughly to the year 2000
± 10 and were intersected with global digital-elevationmodels from various sources
32,33. Each glacier’s topography was aggregated into 10 m elevation bands, the resolution at which GloGEM operates. The initial ice-thickness distribution for each glacier was calculated by inverting the bedrock elevation from the surface topography based on the principles of ice-flow dynamics
34.
Basins. For all 56 investigated drainage basins, we used river-basin boundaries
at the erosion-base level provided by the Global Runoff Data Centre (GRDC)
35. The data set was intersected with the glacier inventory to extract the catchment glacierization. The total glacier area in the investigated basins ranges from 32 km
2to 27,000 km
2, whereas ice cover varies between 0.01% and 20% (2.9% on average;
Supplementary Table 1). Glacierization is smaller than 2% for three-quarters of the basins.
Runoff data. To assess the effect of the projected glacier runoff changes on the
basin runoff we used monthly runoff data from two sources (Supplementary Table 6): (1) for 87% of the investigated basins, long-term runoff measurements are available from the GRDC
36, and (2) for the remaining basins with no or less than ten years of observations (typically smaller or endorheic basins), we used the global runoff data set provided by the University of New Hampshire and the GRDC
37,38. The data set includes monthly runoff on a 0.5
× 0.5° global grid forthe period 1986 to 1995 derived from hydrological modelling assimilated to the GRDC runoff station data. For each basin and month we averaged runoff amounts over the (varying) periods of available data (spanning 20 to more than 100 years between 1900 and 2013) and assumed these averages to represent the current runoff volumes. For the endorheic basins Balkhash and Issyk-Kul, the runoff measurements only covered subcatchments, which we upscaled based on monthly runoff from the entire basin derived from macroscopic hydrological modelling
37,38. To evaluate how much the varying period lengths affect the period averages, we performed a trend analysis of all the runoff time series (Supplementary Fig. 9). For 86% of the series no significant temporal trend was detected, and annual runoff variations mostly remain within ± 10% of their period average. This indicates that the heterogeneity in the period of reference is unlikely to affect our results beyond calculation uncertainties (see below).
Climate. Monthly near-surface air temperature and precipitation data from
the ERA-Interim Reanalysis
39for the period 1980–2012 and from results of the CMIP5
40for 2013–2100 were utilized and were downscaled to all glaciers individually
11. Projections from 14 GCMs forced by three emission scenarios (Representative Concentration Pathways
41) were used (Supplementary Table 2).
Projections were available for RCP2.6, RCP4.5 and RCP8.5 for all the GCMs except for GFDL-CM3 and INMCM4 (only RCP4.5 and RCP8.5). For GCMs with several available ensemble members we used member ‘rlilp1’.
Glacier modelling. GloGEM11
computes glacier mass balance and associated geometry changes for each glacier individually. The climatic mass balance − the balance of snow accumulation, snow- and ice melt, and refreezing
42− is calculated at a monthly resolution based on near-surface air temperature and precipitation time series. Annual mass losses at marine- or lake-terminating glacier fronts are approximated by a simple scheme that accounts for calving front height and width
43. Total mass changes are then used to adjust each glacier’s surface elevation and extent on a yearly basis using an empirical parameterization
44. The model was calibrated using estimates of regional glacier mass changes
45. Rather than glacier runoff observations, which are rarely available at glacier termini, we validated the model against observations of both glacier mass balances (in situ and geodetic measurements)
46and glacier area changes. This approach is justified by the dominant role of glacier melt in glacier runoff. Previous work
11gives further details of the model, its calibration and downscaling procedures.
Definition of glacier runoff. We define glacier runoff as all the water that
originates from the initially glacierized area as given by the Randolph Glacier Inventory version 4.0 (ref.
31), even when a glacier has melted completely. Initially, it consists of the sum of glacier melt (sum of snow, firn and ice melt) and rain, minus refreezing over the glacierized area. As the glacier recedes, we also include rain and snow melt minus refreezing from any areas that are no longer glacierized within the initial boundaries of each glacier. We do not consider other processes in the gradually growing deglacierized proglacial area, such as evapotranspiration or changes in groundwater recharge and land cover, as the data to parameterize them in a global model are unavailable. However, we assume that these processes only have minor effects on the projected changes in glacier runoff because runoff amounts and regime in highly glacierized basins are typically strongly dominated
by melt and rain. We keep the basin’s area constant because this is the spatial scale relevant for water resources, which describes how water availability changes with time over a fixed domain. Our definition of glacier runoff differs from that in another global study
5, which only considered water from each year’s ice- covered area, that is, global runoff projections referred to an annually changing basin extent.
Runoff transit time. To assess seasonal variations in the importance of the
projected glacier runoff changes to the overall basin runoff, the travel time of glacial runoff from the headwaters to the basin’s mouth needs to be accounted for. Here we chose a simple empirical approach
47to approximate basin-specific water transit times. This approach refers to the response of water pressure waves that travel faster than individual water molecules, but neglects the residence time of glacial melt water in lakes or in groundwater systems. Transit time, t
w(days), is calculated as a function of basin area, A main-stream slope, β (m km
−1), by:
basin(km
2), mean discharge,
Q(m ̄
3s
−1) and
̄
β= . . − . − . .
tw 0 055Abasin0 50Q 0 10 0 35 (1) β
is extracted from global digital elevation models
32,33. Transit-time estimates vary between a few days and more than 2 months (Supplementary Table 1). This simple approach has shown reasonable agreement with observations from dye tracer experiments
24.
Contribution of glacier runoff change to the macroscale basin runoff. To
quantify the contribution of glacier runoff changes to the macroscale basin runoff we compute the ratio:
Δ
= ′∕
R Q Qg basin (2)
where Δ
Qg′is the glacier runoff change over the period 1990–2010 to 2080–2100 and
Qbasinis the macroscale basin runoff averaged over the period of available observations. Monthly glacier runoff changes are computed after accounting for a basin-specific transit time, t
w(equation (1)). Q
basinis derived from long-term stream gauges
36or, where these are not available, from macroscopic hydrological modelling
37(see above and Supplementary Table 6).
Future basin runoff will be affected by variations in components of the water balance other than glacier mass change, such as changes in precipitation, evapotranspiration and groundwater/lake storage caused by variations in climate, land cover and human influences. Projected twenty-first century changes in basin runoff mostly range from negligible to ± 30% (ref.
48). Studies report a tendency towards a runoff decrease in arid regions
29,48,49, which hence exacerbates the impact of glacier runoff decline (Fig. 4). Due to large uncertainties in these projections, we do not account for any changes in basin runoff in our analysis, but investigate the effect of this simplification with sensitivity tests. To assess the potential effect of future precipitation changes (typically the main driver of runoff changes) on basin runoff and the resulting R (equation (2)), we modified the observed basin runoff (Supplementary Table 6) using the percentage changes in monthly precipitation between 1990–2010 and 2080–2100 as projected by the 14 GCMs for each basin (Supplementary Fig. 3). Averaged over all GCMs and basins, the monthly precipitation changes range from + 5 ± 5% (standard deviation of the 56 basins) in August to + 9 ± 8% in December. Annual precipitation is projected to increase by 6 ± 4%. The resulting values of R varied by less than 1% for 42 (75%) of the investigated basins, with a maximum change in R of 3%. The number of basins with
R>5% is almost the same for all summer months compared with our calculations, given no future basin runoff changes.
In addition, our trend analysis of the observed runoff series indicated that the vast majority of basins did not show any significant trends, and that (smoothed) variations in annual runoff rarely exceeded
±10% (Supplementary Fig. 9).
Although future runoff variations may differ, the past variations provide an indication of the magnitude of possible future changes, as considerable change in climate, land cover and human influences have occurred during the period of available runoff observations. Both analyses provide confidence that our results of R are robust despite our simplistic assumption of an unaltered future basin runoff.
Below, we quantify the uncertainties in basin runoff associated with assumptions in our uncertainty analysis.
Uncertainties. We quantified uncertainties in peak water, Pw
, and the monthly glacier runoff changes,
ΔQg, between the periods 1990–2010 and 2080–2100, and
ΔQ Qg′∕ basin. We consider uncertainties in (1) the climate projections, (2) the initial ice thickness data, (3) the melt-model parameterization, (4) the estimated water transit time to the basin’s mouth and (5) the macroscale basin discharge data due to observational errors, varying measurement periods and the assumption of an unaltered basin runoff. For P
wand
ΔQg, components (1)–(3) are relevant, whereas for
ΔQ Qg′∕ basinall the factors affect the results.
We addressed each of the five uncertainties above individually with targeted model experiments by varying input data, model parameterizations and parameters within prescribed ranges. Uncertainties are computed as standard deviations of the experiment’s results or, where appropriate, from error propagation. (1) The model
http://doc.rero.ch
is run with 14 GCMs for each of the three emission scenarios. (2) The initial ice thickness for all the glaciers is increased/decreased by 30%, which corresponds to the typical uncertainties in these data
50,51. (3) Snow and ice melt is calculated with an energy-balance approach
11instead of a degree-day model
5,10, and glacier retreat is modelled using volume-area scaling
52instead of a parameterization for the dynamic glacier geometry change
44. For (2) and (3), the uncertainty is defined as the arithmetic mean of the absolute deviation of each sensitivity experiment from the reference run. (4) Water transit times of glacier runoff to the mouth of the drainage basins are computed with varying parameters of equation (1) by ± 2–10%
(depending on their estimated uncertainty) and propagating the errors through equation (2). (5) For the large-scale basin runoff,
Qbasin(equation (2)), we assume an uncertainty of
±18% based on the estimated uncertainties in runoff observations
36(
±10%) and the potential future changes in basin runoff as indicated by a previous compilation
29for the investigated regions (± 15%). For basins in which the runoff from macroscopic hydrological modelling
37,38was used, the uncertainty is set to ± 30%.
The resulting five uncertainties are then combined through the root of the sum of squares to arrive at a total uncertainty for each emission scenario, although inherent assumptions, such as independence of the individual error components, might not be fulfilled. We use generous assumptions for the individual errors to obtain conservative (upper bound) uncertainty estimates.
P
wis most sensitive to the choice of the climate model. For the same emission scenario, the uncertainty in P
wlies within 5–20 years for about 75% of all the basins (Supplementary Table 3). Except for a few regions, uncertainties in the initial ice thickness data and glacier model assumptions influence P
wby less than five years (Supplementary Table 3). The uncertainty in the calculated ΔQ
gis also dominated by the climate scenarios. Absolute values of
ΔQgthat exceed the uncertainty (which indicates that the sign of runoff change is robust) are found for 85–89% of the basins in August and 75–82% in September depending on the emission scenario (Supplementary Table 4). In June and July, the share is 64–85% and 55–80%, respectively, due to somewhat larger uncertainties of the projections.
Uncertainties in R (equation (2)) are relatively large compared with those for
ΔQgdue to additional uncertainties in the water transit time and basin runoff.
Nevertheless, the magnitude of R exceeds the uncertainty in 81–86% of the basins with
R>5% in August, 76–85% in September and 58–83% in October depending on the emission scenario, which thus indicates that the direction of change is robust in these cases (Supplementary Table 5).
Data availability. Data generated and analysed during this study are included
in this published article and its supplementary information files. Additional datasets and code used for the modelling are available from the corresponding author on request.
References
31. Arendt, A. et al. Randolph Glacier Inventory—a dataset of global glacier outlines: Version 4.0 Global Land Ice Measurements from Space (Digital Media, 2014).
32. Jarvis, J., Reuter, H., Nelson, A. & Guevara, E. SRTM 90m Digital Elevation Data Version 4 (CGIAR-CSI, 2008); http://srtm.csi.cgiar.org
33. Tachikawa, T., Hato, M., Kaku, M. & Iwasaki, A. Characteristics of ASTER GDEM version 2 Geoscience and Remote Sensing Symposium (IGARSS) 3657–3660 (IEEE, New York, 2011).
34. Huss, M. & Farinotti, D. Distributed ice thickness and volume of all glaciers around the globe. J. Geophys. Res. 117, F04010 (2012).
35. Major River Basins of the World (Global Runoff Data Centre, 2007);
www.bafg.de/GRDC/
36. Long-Term Mean Monthly Discharges and Annual Characteristics of GRDC Stations (Global Runoff Data Centre, accessed 17 July 2016).
37. Fekete, B., Vörösmarty, C. & Grabs, W. High-resolution fields of global runoff combining observed river discharge and simulated water balances. Glob.
Biogeochem. Cycles 16, 15-1–15-10 (2002).
38. Fekete, B. & Vörösmarty, C. ISLSCP II UNH/GRDC Composite Monthly Runoff (2011); http://dx.doi.org/10.3334/ORNLDAAC/994
39. Dee, D. P. et al. The ERA-Interim reanalysis: configuration and performance of the data assimilation system. Q. J. R. Meteorol. Soc. 137, 553–597 (2011).
40. Taylor, K. E., Stouffer, R. J. & Meehl, G. A. An Overview of CMIP5 and the experiment design. Bull. Am. Meteorol. Soc. 93,
485–498 (2012).
41. Meinshausen, M. et al. The RCP greenhouse gas concentrations and their extensions from1765 to 2300. Clim. Chang. 109, 213–241 (2011).
42. Cogley, J. et al. Glossary of Glacier Mass Balance and Related Terms Technical Documents in Hydrology No. 86 (IACS, 2011).
43. Oerlemans, J. & Nick, F. M. A minimal model of a tidewater glacier.
Ann. Glaciol. 42, 1–6 (2005).
44. Huss, M., Jouvet, G., Farinotti, D. & Bauder, A. Future high-mountain hydrology: a new parameterization of glacier retreat. Hydrol. Earth Syst. Sci.
14, 815–829 (2010).