Publisher’s version / Version de l'éditeur:
Journal of Periodontology, 81, 2, pp. 186-198, 2010-02-08
READ THESE TERMS AND CONDITIONS CAREFULLY BEFORE USING THIS WEBSITE.
https://nrc-publications.canada.ca/eng/copyright
Vous avez des questions? Nous pouvons vous aider. Pour communiquer directement avec un auteur, consultez la première page de la revue dans laquelle son article a été publié afin de trouver ses coordonnées. Si vous n’arrivez pas à les repérer, communiquez avec nous à [email protected].
Questions? Contact the NRC Publications Archive team at
[email protected]. If you wish to email the authors directly, please see the first page of the publication for their contact information.
NRC Publications Archive
Archives des publications du CNRC
This publication could be one of several versions: author’s original, accepted manuscript or the publisher’s version. / La version de cette publication peut être l’une des suivantes : la version prépublication de l’auteur, la version acceptée du manuscrit ou la version de l’éditeur.
For the publisher’s version, please access the DOI link below./ Pour consulter la version de l’éditeur, utilisez le lien DOI ci-dessous.
https://doi.org/10.1902/jop.2009.090419
Access and use of this website and the material on it are subject to the Terms and Conditions set forth at
An update on novel non-invasive approaches for periodontal diagnosis
Xiang, Xiaoming; Sowa, Michael G.; Iacopino, Anthony M.; Maev, Roman G.; Hewko, Mark D.; Man, Angela; Liu, Kan-Zhi
https://publications-cnrc.canada.ca/fra/droits
L’accès à ce site Web et l’utilisation de son contenu sont assujettis aux conditions présentées dans le site LISEZ CES CONDITIONS ATTENTIVEMENT AVANT D’UTILISER CE SITE WEB.
NRC Publications Record / Notice d'Archives des publications de CNRC:
https://nrc-publications.canada.ca/eng/view/object/?id=581ef268-5b52-4c49-829c-1044c72955a2 https://publications-cnrc.canada.ca/fra/voir/objet/?id=581ef268-5b52-4c49-829c-1044c72955a2
An Update on Novel Non-Invasive Approaches for Periodontal Diagnosis
Xiang, Xiaoming; Sowa, Michael G.; Iacopino , Anthony M.; Maev, Roman
G.; Hewko, Mark D.; Man, Angela; Liu, Kan-Zhi
Abstract
For decades there has been an ongoing search for clinically acceptable methods for the accurate, non-invasive diagnosis and prognosis of periodontitis. There are several well-known inherent drawbacks with current clinical procedures. The purpose of this review is to summarize some of the newly emerging diagnostic approaches, namely, infrared spectroscopy, optical coherence tomography (OCT), and ultrasound. The history and attractive features of these new approaches are briefly illustrated, and the interesting and significant inventions related to dental applications are discussed. The particularly attractive aspects for the dental community are that some of these methods are totally non-invasive, do not impose any discomforts to the patients during the procedure, and require no tissue to be extracted. For instance, multiple inflammatory indices withdrawn from near infrared spectra have the potential to identify early signs of inflammation leading to tissue breakdown. Morphologically, some other non-invasive imaging modalities, such as OCT and ultrasound, could be employed to accurately measure probing depths and assess the status of periodontal attachment, the front-line of disease progression. Given that these methods reflect a completely different assessment of periodontal inflammation, if clinically validated, these methods could either replace traditional clinical examinations for the diagnosis of periodontitis or at least serve as attractive complementary diagnostic tools. However, the potential of these techniques should be interpreted more cautiously given the multifactorial character of periodontal disease. In addition to these novel tools in the field of periodontal inflammatory diseases, other alternative modalities like microbiologic and genetic approaches are only briefly mentioned in this review because they have been thoroughly discussed in other comprehensive reviews.
Periodontitis is an endemic infectious disease of the tissues surrounding the teeth occurring in 50% of the population and may result in significant debilitation for about half of these persons.1 As the leading cause of edentulism, periodontitis may also have important implications for systemic health including an increased risk for cardiovascular disease and low birth
weight/preterm delivery.2 According to a report by the World Health Organization,3 severe periodontitis leading to tooth loss was found in 5% to 15% of most populations worldwide. Therefore, it is considered one of the most important global oral health burdens.
Periodontitis is a multifactorial disease with microbial dental plaque as the initiator.4 It is generally accepted that a consortium of bacteria in a biofilm, instead of one single
microorganism, is associated with the disease.5 More than 500 different bacterial species are able to colonize subgingival plaque.6,7 However, whether these bacteria are periodontopathogens or disease indicators has not been clarified.5 The manifestation and progression of periodontitis are also influenced by a variety of other risk factors, such as genetic factors, systemic factors, social and behavioral factors, and patient- and tooth-level factors.8
Periodontitis is currently diagnosed almost entirely on the basis of its clinical manifestations: signs of gingival inflammation (e.g., redness and swelling), probing depth (PD), and level of periodontal attachment or amount of alveolar bone loss. In fact, alveolar bone and periodontal attachment loss represent the results of the destructive aspects of the host defense mechanisms responding to opportunistic infections by bacteria present in the gingival sulcus as well as the direct effects of virulence factors of periodontal pathogens. Alveolar bone and periodontal attachment loss cannot be used to predict the susceptibility to future disease progression or to dictate appropriate treatment plans. Therefore, the drawback of traditionally used diagnostic procedures (clinical signs) is that they cannot reliably identify susceptible individuals or distinguish between disease-active and -inactive sites.9 These are critical criteria for the prevention and treatment of periodontitis.
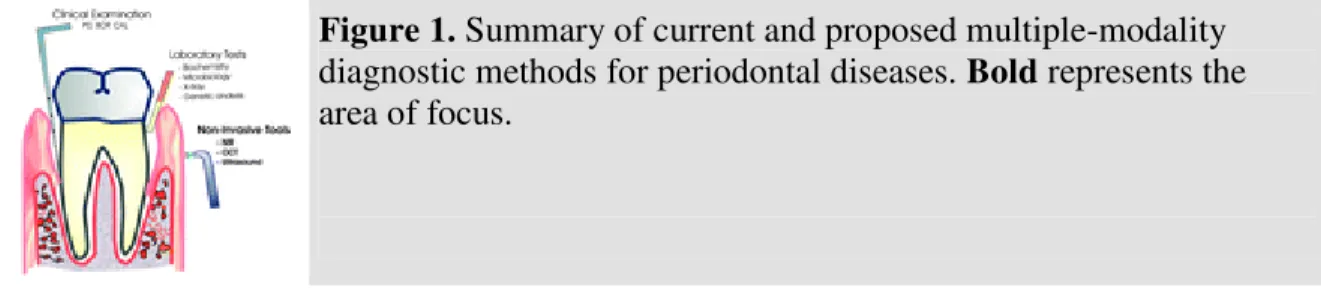
Therefore, additional diagnostic and prognostic tests have been extensively sought to address these problems. Tests are needed to define active versus inactive sites and to identify sites within patients with periodontitis that may require additional/alternative treatments. The overall features of currently used and emerging diagnostic methods for periodontal diseases are shown in Figure 1. In principle, these diagnostic methods can be classified into three categories based on their features and clinical aspects. First, a clinical examination, which is the mainstream, or gold standard, of current practice, primarily measures clinical parameters such as bleeding on probing (BOP), pocket depth, and clinical attachment loss (CAL). Second, genetic analyses and
laboratory-type tests measure aspects of oral biochemistry, microbiology, or radiography. Third, newly emerging non-invasive techniques, such as molecular fingerprinting with infrared (IR) spectroscopy and morphologic imaging using optical coherence tomography (OCT) or ultrasound, are used.
Figure 1. Summary of current and proposed multiple-modality diagnostic methods for periodontal diseases. Bold represents the area of focus.
Non-invasive diagnostic methods that do not use ionizing radiation are of particular interest for routine use in the diagnosis and monitoring of periodontitis as well as for predicting disease progression. Several non-invasive methods that are being explored as complementary diagnostic tools in periodontal diagnostics are reviewed in this article.
CLINICAL DIAGNOSTIC CRITERIA AND THEIR LIMITATIONS
Currently, the diagnosis of periodontitis is primarily based on clinical observations and
radiographs. They complement each other, and together, they help define the extent and severity of periodontitis. One of the most widely used periodontal examinations is periodontal probing. It
helps determine some critical clinical parameters such as BOP, PD, and clinical AL for
evaluating the status of periodontal tissue. However, there are some unavoidable limitations. For instance, the extent of the probe penetration is influenced by the inflammatory status of the tissue. When healthy tissues are examined, the probe tip stops coronally to the apical termination of the junctional epithelium, but at inflamed sites, the probe tip usually passes apically to this point. In such cases, inflammation affects the measurement of PD in a manner unrelated to the attachment level. Furthermore, the poor reliability and reproducibility associated with measuring CAL to monitor the progression of periodontal destruction and to evaluate the effect of
periodontal treatment limit the practical value of periodontal probing. This is reflected in the difficulty in precisely duplicating the insertion force and reproducing probe placement and angulation. In addition, the reproducibility represented by the standard deviation for the measurement of attachment with conventional probes was reported to be in a range of 0.62 to 1.17 mm.10-12 This magnitude of measurement error requires a change of 2 to 3 mm to reliably detect a change in CAL.13 This is a particular concern when considering the fact that
periodontitis is a chronic inflammatory process, and therefore, tissue destruction and repair are relatively slow.
A radiographic survey is another key parameter in periodontal diagnostic decision making, which can help determine the severity of periodontitis and bone-related damage but with limited sensitivity. When examined by eye, radiographs only reveal changes in bone after 30% to 50% of the mineral has been lost.14-16 In addition, radiographs cannot be taken at each visit due to the radiation exposure to the patient. Most importantly, radiographs and clinical probing can only provide information about the level of tissue destruction and disease severity. Therefore, conventional radiography is not useful for evaluating disease activity or the risk of disease progression. Also, these methods are time consuming, subject to various sources of measurement error, and often poorly tolerated by patients.17
Computer-assisted subtraction radiography has been used in periodontal studies since the early 1980s.18,19 Compared to traditional radiographic techniques, it is more sensitive to small bony changes. It was demonstrated that results of subtraction radiolography were strongly associated with CAL relative to the frequency and pattern of disease activity measured by automated periodontal probes.20,21 Despite the improved sensitivity and accuracy of the subtraction technique, detecting variations in bone still requires sequential observations over time.
Microbiologic testing has been an important tool in determining the effects of therapy, predicting disease recurrence, and aiding in the choice of specific adjunctive antibiotics.22 Although the gold standard in the field remains bacterial counting, a number of immune diagnostic methods were established to provide quantitative or semiquantitative estimates of oral microorganisms; these include direct or indirect immunofluorescent microscopy assays, flow cytometry, enzyme-linked immunosorbent assay (ELISA), membrane assays and latex agglutination, multiplex polymerase chain reaction (PCR), and real-time PCR.23-25 These methods demonstrated a higher sensitivity and specificity, but they were expensive and required monoclonal antibodies or special probes and well-trained personnel, thus greatly limiting their application in the clinic.26 Genetic analysis is another method for distinguishing among periodontal patients. There has been increasing evidence indicating that genes play a role in determining the susceptibility to and
progression of periodontitis.27,28 For instance, a clustering of aggressive periodontitis strongly suggests a genetic component of the disease.29-32 A number of gene polymorphisms were also found to be potential markers of an increased susceptibility for periodontitis, such as the increased expression of interleukin-1 in inflamed gingival33 and leukocyte receptors for the constant part of immunoglobulin.34 However, periodontitis depends on the interaction among genetic susceptibility, composition of bacterial etiology, and environmental and acquired factors. The assessment of a genetic predisposition to periodontitis represents only one of many
components of subject-based analyses.33 In addition, when single candidate genes are tested, the influences of confounder genes should be taken into consideration because these may either additionally increase or attenuate the inflammatory response to the bacterial challenge. Thus, the candidate-gene approach is unfortunately not the ideal method for the assessment of
periodontitis.35
SHEDDING LIGHT ON INFLAMMATORY PERIODONTAL DISEASE BY IR SPECTROSCOPY
The biomedical use of the electromagnetic spectrum of radiation has revolutionized the practice of medicine, most recently through the dramatic healthcare advances afforded by the
development of magnetic resonance imaging (Fig. 2).36 The last region of the spectrum to be applied to the practice of medicine is the IR region (Fig. 2). IR spectroscopy is being
increasingly used in biomedical settings and has major advantages, such as requiring no reagents and its ease of use, rapidity, and capability of molecular probing.37
Figure 2. Biomedical applications of the electromagnetic spectrum. The classic electromagnetic spectrum is shown aligned with
common, established biomedical applications. The IR region (red arrow) of the electromagnetic spectrum lies between the visible and microwave regions. PET = positron emission tomography; MRI = magnetic resonance imaging. (Reproduced with permission from Hynes et al.36)
Generally speaking, IR spectroscopy can distinguish differences in the characteristics of diverse molecules by probing vibrations of chemical bonds and can use these molecular and
submolecular profiles to define and differentiate between diseased and healthy tissues.38 As covalent bonds vibrate, they absorb energy in the form of IR light (Fig. 3).36 The wavelength of light absorbed depends on the nature of the covalent bond (e.g., C=O and N–H), the type of vibration (e.g., bending and stretching), and the environment of the bond. The IR spectrum of a tissue sample can be regarded as the molecular fingerprint of the tissue. If this molecular
fingerprint is modified by a disease process, IR spectroscopy can be used to detect and monitor the disease process.
Figure 3. Representative spectrum in the mid-IR region. The region below 1,500 cm−1 is the fingerprint region. The region above 1,500 cm−1 is the functional group region. (Reproduced with permission from Hynes et al.36)
Compared to analyzing one or more particular biomarkers in tissue or body fluid, IR spectroscopy analyzes complex biologic systems by capturing the entire IR spectrum that represents the sum of the contributions of the biomolecules present, such as proteins, lipids, sugars, and nucleic acids.39 In the previous 10 years, IR spectroscopists took advantage of this molecular information, in combination with pattern recognition/classification methods, to explore the potential of IR spectroscopy as a powerful tool for the diagnoses of various diseases based upon the spectra of biologic fluids, including gingival crevicular fluid (GCF).40-45 The IR spectrum of GCF is a rich source of information regarding the oral cavity and associated inflammation.
Diagnosis of Periodontitis Based on IR Spectra of GCF
GCF is defined as either a serum transudate or inflammatory exudate. It is composed of serum and locally generated materials such as tissue-breakdown products, inflammatory mediators, and antibodies formed directly against dental plaque bacteria. GCF production is governed by the passage of fluid from capillaries into the tissues and the removal of this fluid by lymphatics.46 The amount of GCF produced at a given site significantly increases with the severity of gingival inflammation clinically and histologically.47 The flow rate of GCF may increase about 30-fold in individuals with periodontitis compared to those with a healthy sulcus.48 Therefore, analysis of GCF quantitatively and qualitatively possesses great potential as an indicator for the diagnosis and progression of periodontitis.
After many years of effort, over 65 biologically active components were identified in GCF. The diagnostic and prognostic plaque or GCF markers for periodontitis include: 1) the presence of specific bacteria (including Porphyromonas gingivalis and Aggregatibacter
actinomycetemcomitans [previously Actinobacillus actinomycetemcomitans]);49 2) bacterial
products of metabolism (e.g., volatile sulfur compounds50 or specific proteases;51 3) biomarkers involved in the disease process but produced by the host (e.g., matrix metalloproteinases,52 neutrophil elastase, and alkaline phosphatase);53,54 4) biomarkers of tissue damage (e.g.,
hydroxyproline/collagen fragments);53,55 and 5) other markers of the inflammatory process, such as prostaglandin E2 and interleukin-1.53 However, despite the complex nature of periodontal
flora, and the interindividual variations in inflammatory responses,56 such potential biomarkers are generally studied individually or, rarely, in small numbers. This may explain why the predictive value of potential biomarkers has not been sufficient for effective routine clinical use.53
However, IR analysis of GCF, unlike traditional biochemical analyses, measures the total contents of GCF and may prove to be a more powerful diagnostic and prognostic tool for periodontal diseases as our data suggested.57 In the recent study,57 we used IR spectroscopy to characterize GCF from healthy, gingivitis, and periodontitis sites and determined specific spectral signatures that clearly demarcated healthy and diseased tissues.
We were able to show that, even in unprocessed spectral data (Fig. 4), subtle differences in spectral band intensity and positions arising from the three major components, i.e., lipid, protein and DNA, were observed in GCF from healthy, gingivitis, and periodontitis groups. Several major differentiating IR bands were visualized in a spectral range of 900 to 1,800 cm−1 (Fig. 4). The two prominent absorptions at 1,652 and 1,542 cm−1 arose from C=O stretching (amide I band) and N–H bending (amide II band) vibrations of peptide groups.43,58 The bands at 1,087 and 1,240 cm−1 were PO2− stretching vibrations of phosphodiester groups in DNA, whereas the band
at 1,740 cm−1 originated from lipid ester C=O groups.58,59 The lipid-ester intensity in the GCF from periodontitis sites was much lower than that in healthy GCF. A cluster of CH2 and CH3
stretching vibrations, mainly attributed to GCF lipids, was found in the spectral range of 2,800 to 3,100 cm−1. Other distinguishing spectral features included the proteinaceous amide B band at 3,050 cm−1 and the amide A at 3,290 cm−1.43,58 Thus, disease-specific cellular and molecular alterations to the composition of GCF were evident, most prominently the increased intensity of the 1,652 cm−1 amide I band at inflammatory sites (gingivitis and periodontitis) compared to healthy crevices.
Figure 4. Mean mid-IR spectra of GCF samples from healthy, gingivitis, and periodontitis sites. Shaded bands represent the IR bands originating from molecular signatures from lipid, protein, and nucleic acid in GCF samples. (Reproduced with permission from Xiang et al.57)
As shown in Figure 5, using Fourier self-deconvolution (FSD) to narrow effective bandwidths and effectively enhance resolution60 revealed important discriminatory features such as the DNA band at 1,713 cm−1 that is characteristic of base-paired DNA strands.59,61 By integrating the three major DNA-sensitive bands (the bands at 1,087 and 1,240 cm−1 arising from symmetric sPO2−
and asymmetric asPO2− stretching vibrations of phosphodiester groups in DNA and the 1,713
cm−1 band), we demonstrated that GCF DNA concentrations in diseased subjects were increased compared to healthy subjects. The increased DNA content in the inflammatory GCF samples
might suggest an early phase during the inflammatory process with active enrolled leukocytes, bacteria, and shedding epithelial cells in the GCF samples.
Figure 5. Relative DNA contributions were increased in the GCF samples from diseased sites. A) Shaded areas on the spectra highlight DNA-specific signals in GCF. B) The enlarged area represents an important DNA band, 1,713 cm−1, arising from DNA base-pair vibration after FSD. The bars in the upper panels represent the integrated area (relative DNA content) in the mean spectra from the three groups (A). (Reproduced with permission from Xiang et al.57)
Increased protein (amide I at 1,652 cm−1) and lipid (a symmetric CH2 stretching vibration at
2,853 cm−1 from the fatty acyl chains) signals were also evident at diseased sites. The integrated area of the =CH band at 3,012 cm−1 is used as an index of the relative concentration of double bonds in lipid structures from unsaturated fatty acyl chains (e.g., linolenic and arachidonic) arising from lipid peroxidation.62,63 Interestingly, lipid oxidation was increased in the
inflammatory groups, as evidenced by the olefinic =CH band at 3,012 cm−1, providing further evidence of the importance of lipid peroxidation in periodontal disease pathogenesis.64,65 However, the lipid ester band arising from the C=O group at 1,740 cm−1 decreased in the periodontitis group.
Besides the unique capability of IR spectroscopy to capture the composite molecular contents of GCF, it may also provide a qualitative diagnosis of periodontal inflammatory status. This could be achieved by using linear discriminant analysis (LDA) to correlate observed spectral
differences of GCF from inflammatory conditions (gingivitis and periodontitis) and normal healthy status. As shown in Table 1, the ability of the LDA procedure to adequately predict periodontitis appears promising in that the accuracy of this LDA approach for diagnosing
periodontitis was 98.4% for the training set and 93.1% for the validation set based on the spectral information from 900 to 1,800 cm−1.57 This was primarily due to the fact that periodontal disease is clearly multifactorial, and our LDA analyses considered multiple components in the GCF as the basis to designate individual spectra as healthy or diseased. Therefore, the IR spectroscopy approach is entirely different from previous attempts that heavily rely on the measurement of only one or two specific GCF components for the potential diagnostic tool.
In addition to potentially providing high accuracy, there are several other advantages to using IR spectroscopy of GCF for the screening and diagnosis of periodontitis: IR spectroscopy is reagent free, requiring only small sample volumes; GCF samples are essentially unprocessed; the process is readily automated; IR spectroscopy is straightforward, requiring minimal training for
operators; and GCF samples are easily collected by clinicians with sample collection targeted to specific sites or to a representative set of teeth.
In Vivo Monitoring and Screening of Periodontitis by Near IR (NIR) Spectroscopy
Another novel non-invasive optical modality being explored for periodontal disease diagnosis is NIR spectroscopy. NIR can be used to monitor hemodynamic and edema-based markers of soft tissues of the oral cavity. Several light-absorption bands in the visible and NIR spectral region reflect key inflammatory events.66,67 For instance, the wavelength region 500 to 600 nm is dominated by the absorption from oxygenated hemoglobin (HbO2) and deoxygenated
hemoglobin (Hb) in the capillary bed gingival tissue, whereas the absorption from water results in an increased attenuation at longer wavelengths centered at 970 nm. (Fig. 6).68
Figure 6. NIR reference spectra (500 to 1,000 nm) for water (H2O),
Hb, and HbO2. The extinction coefficient data for water were
multiplied by a scaling factor of 10. (Reproduced with permission from Liu et al.68)
Therefore, optical spectroscopy offers a non-invasive means of assessing the balance between tissue oxygen delivery and oxygen use. Hemoglobin and oxygenation indices were previously measured in periodontal tissues with the data suggesting that the increase in blood supply during inflammation was insufficient to meet the oxygen demand in inflamed gingivae.69 The electronic transitions stemming from the heme ring and central metal iron ion of hemoglobin are
particularly strong in the visible region. Optical spectroscopy can measure relative
concentrations of HbO2 and Hb by fitting optical attenuation spectra to the known optical
properties (extinction coefficients) of HbO2 and Hb.68,70
In addition, tissue edema, an index that is commonly used as a marker of gingival
inflammation,71,72 can be measured using NIR spectroscopy.66,67 Consequently, monitoring the intensity of water bands in gingival tissues provides an index of tissue hydration representing a simple indicator of inflammation at specific periodontal sites. Furthermore, the 960-nm water band is known to shift with tissue temperature and changes in electrolyte concentration.73 Thus, optical spectroscopy provides a measure of the hemoglobin-oxygen saturation of tissues and the degree of tissue perfusion as well as a measure of tissue edema.
Based on these principles, we recently demonstrated, using NIR spectroscopy, that tissue oxygenation at periodontitis sites was significantly decreased (P <0.05) compared to gingivitis and healthy controls, as shown in Figure 7A.68 Such decreased oxygen saturation likely reflects tissue hypoxia resulting from an ongoing inflammatory response leading to increased oxygen
consumption.74 It is well known that anaerobic microorganisms predominate in the periodontal pocket in destructive periodontal diseases, and diminished oxygen tension in deep pockets would be expected to promote the growth of anaerobic bacteria.75,76 Interestingly, it was shown that tissue oxygen saturation correlated well with oxygen tension in periodontal pockets.69 As tissue oxygen saturation is not measurable clinically, optical spectroscopy can provide a further index of inflammation that may be useful to the periodontist. In other words, after future studies, the NIR intraoral probe may be able to determine sites at which disease has not yet clinically progressed but which have biochemically defined profiles suggesting that a particular site has pathogenic potential, such as the anaerobicity required to establish a pathogenic microflora.
Figure 7. Percentage of tissue hemoglobin oxygen saturation (A) and relative tissue water content (B). Indices were compared among healthy (normal), gingivitis, and periodontitis sites. *Significantly different; see text.
In addition, our spectra indicate that sites of periodontitis had a significantly higher tissue water content compared to healthy sites (Fig. 7B). Periodontal edema (water content, as interpreted by optical spectra) results from an increase in vascular permeability in response to bacterial etiology leading to interstitial fluid accumulation and, subsequently, the release of a variety of this
inflammatory exudate in the gingival crevice.77 Clinically, this appears as swelling at affected periodontal sites.
In summary, optical spectroscopy represents an attractive technology to apply to the study of periodontal inflammation and periodontal disease diagnosis because spectra can be captured instantly; no consumables need be purchased or developed (i.e., antibodies, substrates, or molecular probes); and once the equipment is in place, it is very inexpensive to operate, and minimal training is required to obtain reliable and reproducible data.
IN VIVO IMAGING OF THE PERIODONTAL AREA BY OCT
OCT, a relatively new imaging technique, can create high-resolution cross-sectional images of biologic structures by scanning a lightly focused light beam across the tissue surface of interest. Conceptually, OCT imaging has been compared to ultrasound scanning.78 Both techniques provide structural images using backscattered energy. However, unlike an ultrasound, which uses sound waves, OCT uses broad-band low-coherent NIR light sources that provide considerable penetration into tissue with no known detrimental biologic effects.79 OCT takes advantage of the low-coherence length of broadband laser light and interferometric detection to create images with resolutions of 10 μm in the axial direction and 20 μm in the transverse plane using relatively inexpensive light sources and optics. A more elaborate OCT system can achieve axial and
transverse resolutions of 1 to 3 μm. The coherence gating nature of OCT enables the separation of axial resolution from the dependence of the optical properties of the imaging optics.
Therefore, a high axial resolution is attained while maintaining a long depth of focus. OCT uses the backscattering of light from tissue components of differing refractive indices to create three-dimensional grayscale images.80 The weak backscattered light is measured using heterodyne mixing where source light is split to the sample and a moving reference mirror. The light
reflected from the reference mirror recombines with the backscatter light from the sample. When the distance traveled by the light in the sample and reference path is equal within the coherence length of the light source, they recombine with interference fringes. The envelope of these
fringes provides the intensity for the OCT images. The reliance on the coherence matching of the light from the sample and reference paths limits the penetration depth to 2 mm in biologic tissues to the loss of coherence caused by scattering within the sample.
OCT was first proposed for use as a biologic imaging system in 1991 by Huang et al.81 This imaging technology was demonstrated to have potential clinical applications in dermatology,82 ophthalmology,83 cardiology84 and dentistry.85-87 A study85 suggested that in vivo dental OCT images can clearly depict anatomic structures that are important in the diagnostic evaluation of hard and soft oral tissue. Periodontal tissue contour, sulcular depth, and connective tissue attachment were visualized at high resolution using this technology. Our preliminary data showed that OCT imaging can offer three-dimensional imaging of periodontal soft tissues and bone at an exquisitely high resolution (Fig. 8). Because OCT reveals microstructural details of the periodontal soft tissues, it offers the potential for identifying active periodontitis before significant alveolar bone loss occurs.
Figure 8. A and B) OCT images of an upper central incisor and soft tissue in a rat.
Periodontal diseases are plaque-induced disorders that result in the loss of connective tissue attachment and resorption of alveolar bone. An important aspect of periodontal disease
assessment is determining the location of the soft tissue attachment to the tooth surface.88 OCT may prove to be a more reproducible and reliable method of determining attachment level than traditional probing methods. The optical nature of OCT does not require direct contact with the tissue. A non-contact probe does not compress the soft tissue and allows direct geometric measurement of the tissue dimensions in their natural state. The tissue of interest can be imaged without contact using a probe designed with a focal plane at a distance from the probe tip, and tissues within the depth of field of the probe optics will be imaged. In addition, an OCT probe may be designed with a short focus distance for direct contact imaging allowing a submillimeter probe to be placed on the tissue surface or even in the pocket space.
Moreover, directly imaging tooth and soft-tissue structures and contours in vivo may provide information that would allow a diagnosis of periodontitis before attachment loss. In brief, although NIR can supply indices related to tissue inflammation, gauging the attachment level requires exploration of the integrity of the periodontal tissue and tooth interface. It is likely that OCT imaging will provide three-dimensional imaging of periodontitis and bone at an exquisitely high resolution.
NON-INVASIVE DIAGNOSIS OF PERIODONTITIS BY ACOUSTIC MICROSCOPY
Ultrasound imaging is another imaging modality that has been explored for the diagnosis of periodontitis. The application of an ultrasound as a diagnostic tool is well documented.89,90 The definition of an ultrasound is based on mechanical vibrations at frequencies above the limit of human audibility. Most diagnostically useful sound frequencies occur between 1 and 5 MHz. Ultrasound is reflected when it strikes an interface between two media of different acoustic properties. This effect is used for the measurement of distance. This technique is non-ionizing, non-invasive, fast, and painless.
Ultrasound imaging has been extensively used in medical and dental areas such as diagnostic imaging and physiotherapy. For instance, dental scaling, a procedure for removing dental plaque and calculus from the surface of the teeth, is a very popular routine practice in dental offices. Other applications of ultrasound in dentistry include the treatment of joint- and muscle-related ailments around the face, the generalized cleaning of instruments prior to sterilization and dentures, and as a diagnostic procedure to detect dental caries and periodontal disease.91 The use of ultrasound as a potential clinical diagnostic device has been investigated for many years.90,92-94 As early as 1971, Lees92 demonstrated that it was possible to measure the size and shape of the pulp chamber of teeth using an ultrasound pulse-echo system. However, the accuracy was limited by both the high acoustic impedance mismatches between the various interfaces and anatomic arrangement of the tooth. Meanwhile, Spranger94 tested a one-dimensional ultrasonic impulse-echo process for periodontal diagnosis. For the diagnosis of marginal periodontal disease, the dentist usually has to monitor and consider changes in the alveolar bone. However, the interpretation of radiographs of the alveolar margin pose some uncertainties that arise from effects dependent on the perspective and projection angles that are often overlooked. Spranger94 demonstrated that the sounding of the depth of intrabony pockets can be successfully obtained if the measurement conditions are carefully controlled. In addition, Spranger94 noted that there were marked changes in echo qualities when the ultrasonic head passes across the gingival mucosa in a coronal-apical direction. The author interpreted this as a change in the homogeneity of the gingiva where it was interrupted by the cancellous structure of the alveolar edge bone. Based on these findings, the author concluded that the one-dimensional form of the ultrasonic impulse-echo method could show an improvement in the assessment of the condition of the periodontium and supplement x-ray diagnosis by providing instant local findings related to the alveolar margin bone.
Approximately 14 years later, Fukukita et al.93 examined this unique technique in periodontal disease by using a B-mode high-resolution ultrasonic scanner with a 20-MHz ultrasonic
transducer and a novel scanning method. Within the limited cases they studied, they accurately determined the distance between the gingival margin and the alveolar crest and tooth and periodontal structures based on the ultrasound measurement. One year later, Palou et al.90
assessed the value of ultrasound in the measurement of periodontal bone morphology. However, they found that the measurement of alveolar bone topography with the ultrasound probe
available at that time was not accurate. They speculated that one of the possibilities for this negative outcome might be the probe they used, which was straight and cumbersome to use in areas distal to the first premolar. Therefore, they suggested that this probe should be redesigned with a fine tip for accurate placement on the area where the measurement is desired and a 90° bend, similar to a dental handpiece contra-angle, to improve the accuracy of an ultrasound-based periodontitis diagnosis. As shown in Figure 9, the detailed microstructure of dentin and enamel and the distinct boundaries among different elements were revealed by using this pulse-scanning acoustic microscope.95
Figure 9. Determination of tissue and tooth surface topography and reflectivity by ultrasound. A) The whole tooth. B) Magnified dentin– enamel interface.95 D–E Junction = dentin–enamel interface.
(Reproduced with permission from Maev.95)
More recently, Cotti et al.96 used an ultrasound real-time imaging technique for the assessment of a periradicular lesion of endodontic origin. Based on echographic features, they obtained and recorded information on the size of the lesion, its content, and its vascular supply. Therefore, a tentative differential diagnosis between a cyst and a granuloma could be made based on the data. To this end, they speculated that echography is an easy and reproducible technique that has the potential to supplement conventional radiography in the diagnosis and follow-up of extensive periapical lesions. It provides specific information on the size of a lesion and has a low radiation risk. Furthermore, its potential to describe the contents of lesions (i.e., watery versus
corpusculated) and their vascularization may become an important factor when making a differential diagnosis among lesions of endodontic origin (i.e., granulomas versus cysts) and among other lesions of the maxillary bones.
In summary, ultrasound imaging can visualize periodontal and oral tissues in vivo or ex vivo without the need for complicated processing, fixing, or staining. It is fast and non-invasive. Therefore, echography is an easy and reproducible technique that has the potential to supplement conventional radiography in the diagnosis and follow-up of periodontal-associated disease.
The diagnosis of periodontal diseases is mainly dependent on clinical measurements and radiographs. Inherent measurement problems have led scientists and clinicians to seek more reliable diagnostic methods. The ideal diagnostic tools should be able to: 1) screen susceptible subjects in large populations, 2) differentiate active and non-active disease sites, 3) and predict the future course of the disease in specific individuals and sites. Given the complex nature of periodontitis, it is unlikely that one single clinical or laboratory examination can address all issues concerning diagnosis and prognosis. Non-invasive diagnostic methods seem to be the most promising candidates for these purposes.
As our understanding of periodontitis etiology has deepened, some biomarkers in the oral fluids, including GCF and saliva, emerged as promising candidates because these fluids can be readily collected with minimal discomfort. To fully use the information derived from GCF, one can evaluate some biologically specific proteins or markers by using immunologic or biochemical methods. However, these approaches to diagnose periodontitis by means of qualifying or
quantifying specific biomarkers are still being tested. Instead of examining one or more specific molecules, molecular fingerprinting of the overall expression of these proteins and cytokines in GCF with IR spectroscopy, if valid and reliable, will be a distinct help to both clinicians and researchers.
Alternative non-invasive biodiagnostic tools such as NIR spectroscopy acquire spectra in situ from specific periodontal sites. Multiple inflammatory indices withdrawn from NIR spectra have the potential to identify early signs of inflammation leading to tissue breakdown.
Morphologically, some other non-invasive imaging modalities, such as OCT and ultrasound, could be employed to accurately measure PD and assess the status of periodontal attachment, the front line of disease progression. In general, these new methods complement one another and, together with conventional clinical and radiographic examination, are most likely to provide more accurate means for the diagnosis of periodontitis.
ACKNOWLEDGMENTS
This study was generously supported by a grant from the Natural Sciences and Engineering Research Council of Canada and the Canadian Institutes for Health Research, Ottawa, ON (312901-2005). The authors report no conflicts of interest related to this review.
REFERENCES
1. Brown LJ, Löe H. Prevalence, extent, severity and progression of periodontal disease.
Periodontol 2000 1993;2:57-71.
2. Teng YT, Taylor GW, Scannapieco F, et al. Periodontal health and systemic disorders. J Can
Dent Assoc 2002;68:188-192.
3. World Health Organization. The World Oral Health Report. Geneva: World Health Organization; 2003.
4. Kinane DF. Periodontitis modified by systemic factors. Ann Periodontol 1999;4:54-64. 5. Nishihara T, Koseki T. Microbial etiology of periodontitis. Periodontol 2000 2004;36:14-26. 6. Moore WE, Moore LV. The bacteria of periodontal diseases. Periodontol 2000
1994;5:66-77.
7. Moore WE, Holdeman LV, Smibert RM, Hash DE, Burmeister JA, Ranney RR. Bacteriology of severe periodontitis in young adult humans. Infect Immun 1982;38:1137-1148
8. Nunn ME. Understanding the etiology of periodontitis: An overview of periodontal risk factors. Periodontol 2000 2003;32:11-23.
9. Greenstein G. Commentary on periodontal diagnostic testing. J Periodontol 1995;66:531-535.
10.
Goodson JM, Tanner AC, Haffajee AD, Sornberger GC, Socransky SS. Patterns of
progression and regression of advanced destructive periodontal disease. J Clin Periodontol 1982;9:472-481.
11.
Cercek JF, Kiger RD, Garrett S, Egelberg J. Relative effects of plaque control and
instrumentation on the clinical parameters of human periodontal disease. J Clin Periodontol 1983;10:46-56.
12. Aeppli DM, Boen JR, Bandt CL. Measuring and interpreting increases in probing depth and attachment loss. J Periodontol 1985;56:262-264.
13. Haffajee AD, Socransky SS, Goodson JM. Clinical parameters as predictors of destructive periodontal disease activity. J Clin Periodontol 1983;10:257-265.
14.
Ortman LF, McHenry K, Hausmann E. Relationship between alveolar bone measured by 125I absorptiometry with analysis of standardized radiographs: 2. Bjorn technique. J
Periodontol 1982;53:311-314 .
15. Jeffcoat MK. Assessment of periodontal disease progression: Application of new technology to conventional tools. Periodontal Case Rep 1989;11:8-12.
16.
Jeffcoat MK, Page R, Reddy M, et al. Use of digital radiography to demonstrate the potential of naproxen as an adjunct in the treatment of rapidly progressive periodontitis. J Periodontal
Res 1991;26:415-421.
17. Kaufman E, Lamster IB. Analysis of saliva for periodontal diagnosis – A review. J Clin
Periodontol 2000;27:453-465 .
18. Webber RL, Ruttimann UE, Grondahl HG. X-ray image subtraction as a basis for assessment of periodontal changes. J Periodontal Res 1982;17:509-511.
19. Hausmann E. A contemporary perspective on techniques for the clinical assessment of alveolar bone. J Periodontol 1990;61:149-156.
20. Jeffcoat MK, Reddy MS. A comparison of probing and radiographic methods for detection of periodontal disease progression. Curr Opin Dent 1991;1:45-51.
21. Reddy MS, Geurs NC, Jeffcoat RL, Proskin H, Jeffcoat MK. Periodontal disease progression.
J Periodontol 2000;71:1583-1590.
22. Teles RP, Haffajee AD, Socransky SS. Microbiological goals of periodontal therapy.
Periodontol 2000 2006;42:180-218.
23. Greenstein G. Microbiologic assessments to enhance periodontal diagnosis. J Periodontol 1988;59:508-515.
24. Lamster IB, Celenti RS, Jans HH, Fine JB, Grbic JT. Current status of tests for periodontal disease. Adv Dent Res 1993;7:182-190.
parameters and step-by-step protocol. Biotechniques 1997;23:504-511.
26.
Sanz M, Lau L, Herrera D, Morillo JM, Silva A. Methods of detection of Actinobacillus
actinomycetemcomitans, Porphyromonas gingivalis and Tannerella forsythensis in
periodontal microbiology, with special emphasis on advanced molecular techniques: A review. J Clin Periodontol 2004;31:1034-1047.
27. Hodge P, Michalowicz B. Genetic predisposition to periodontitis in children and young adults. Periodontol 2000 2001;26:113-134.
28. Kinane DF, Shiba H, Hart TC. The genetic basis of periodontitis. Periodontol 2000 2005;39:91-117 .
29. Boughman JA, Astemborski JA, Suzuki JB. Phenotypic assessment of early onset periodontitis in sibships. J Clin Periodontol 1992;19:233-239.
30. Butler JH. A familial pattern of juvenile periodontitis (periodontosis). J Periodontol 1969;40:115-118.
31.
Marazita ML, Burmeister JA, Gunsolley JC, Koertge TE, Lake K, Schenkein HA. Evidence for autosomal dominant inheritance and race-specific heterogeneity in early-onset
periodontitis. J Periodontol 1994;65:623-630. 32.
Van Dyke TE, Schweinebraten M, Cianciola LJ, Offenbacher S, Genco RJ. Neutrophil chemotaxis in families with localized juvenile periodontitis. J Periodontal Res 1985;20:503-514.
33.
Huynh-Ba G, Lang NP, Tonetti MS, Salvi GE. The association of the composite IL-1 genotype with periodontitis progression and/or treatment outcomes: A systematic review. J
Clin Periodontol 2007;34:305-317.
34. Yoshie H, Kobayashi T, Tai H, Galicia JC. The role of genetic polymorphisms in periodontitis. Periodontol 2000 2007;43:102-132.
35. Shapira L, Wilensky A, Kinane DF. Effect of genetic variability on the inflammatory response to periodontal infection. J Clin Periodontol 2005;32(Suppl. 6):72-86. 36. Hynes A, Scott DA, Man A, Singer DL, Sowa MG, Liu KZ. Molecular mapping of
periodontal tissues using infrared microspectroscopy. BMC Med Imaging 2005;5:2-11. 37. Liu KZ, Man A, Shaw RA, Liang B, Xu Z, Gong Y. Molecular determination of liver fibrosis
by synchrotron infrared microspectroscopy. Biochim Biophys Acta 2006;1758:960-967. 38. Jackson M, Sowa MG, Mantsch HH. Infrared spectroscopy: A new frontier in medicine.
Biophys Chem 1997;68:109-125.
39. Petibois C, Déléris G. Chemical mapping of tumor progression by FT-IR imaging: Towards molecular histopathology. Trends Biotechnol 2006;24:455-462.
40.
Liu KZ, Dembinski TC, Mantsch HH. Prediction of RDS from amniotic fluid analysis: A comparison of the prognostic value of TLC and infra-red spectroscopy. Prenat Diagn 1998;18:1267-1275.
41.
Liu KZ, Shaw RA, Dembinski TC, Reid GJ, Ying SL, Mantsch HH. Comparison of infrared spectroscopic and fluorescence depolarization assays for fetal lung maturity. Am J Obstet
Gynecol 2000;183:181-187.
42.
Liu KZ, Shaw RA, Man A, Dembinski TC, Mantsch HH. Reagent-free, simultaneous determination of serum cholesterol in HDL and LDL by infrared spectroscopy. Clin Chem 2002;48:499-506.
43. Liu KZ, Tsang KS, Li CK, Shaw RA, Mantsch HH. Infrared spectroscopic identification of beta-thalassemia. Clin Chem 2003;49:1125-1132.
44. Eysel HH, Jackson M, Mantsch HH. Method for diagnosing arthritic disorders by infrared spectroscopy. Patent ID: US5473160; Issue Date: December 5, 1995.
45.
Eysel HH, Jackson M, Nikulin A, Somorjai RL, Thomson GTD, Mantsch HH. A novel diagnostic test for arthritis: Multivariate analysis of infrared spectra of synovial fluid.
Biospectroscopy 1997;3:161-167.
46. Pashley DH. A mechanistic analysis of gingival fluid production. J Periodontal Res 1976;11:121-134.
47. Armitage GC. Clinical evaluation of periodontal diseases. Periodontol 2000 1995;7:39-53. 48. Uitto VJ. Gingival crevice fluid – An introduction. Periodontol 2000 2003;31:9-11.
49. D'Ercole S, Catamo G, Piccolomini R. Diagnosis in periodontology: A further aid through microbiological tests. Crit Rev Microbiol 2008;34:33-41.
50. Morita M, Wang HL. Relationship of sulcular sulfide level to severity of periodontal disease and BANA test. J Periodontol 2001;72:74-78.
51.
Loesche WJ, Bretz WA, Kerschensteiner D, et al. Development of a diagnostic test for anaerobic periodontal infections based on plaque hydrolysis of benzoyl-DL-arginine-naphthylamide. J Clin Microbiol 1990;28:1551-1559.
52.
Munjal SK, Prescher N, Struck F, Sorsa T, Maier K, Netuschil L. Evaluation of immunoassay-based MMP-8 detection in gingival crevicular fluid on a point-of-care platform. Ann N Y Acad Sci 2007;1098:490-492.
53. Lamster IB, Ahlo JK. Analysis of gingival crevicular fluid as applied to the diagnosis of oral and systemic diseases. Ann N Y Acad Sci 2007;1098:216-229.
54.
Bowers MR, Fisher LW, Termine JD, Somerman MJ. Connective tissue-associated proteins in crevicular fluid: Potential markers for periodontal diseases. J Periodontol 1989;60:448-451.
55. Huynh QN, Wang S, Tafolla E, et al. Specific fibronectin fragments as markers of periodontal disease status. J Periodontol 2002;73:1101-1110.
56. Kinane DF, Mark Bartold P. Clinical relevance of the host responses of periodontitis.
Periodontol 2000 2007;43:278-293.
57. Xiang XM, Liu KZ, Man A, Ghiabi E, Cholakis A, Scott DA. Periodontitis-specific molecular signatures in gingival crevicular fluid. J Periodontal Res 2009; in press. 58. Liu KZ, Man A, Dembinski TC, Shaw RA. Quantification of serum apolipoprotein B by
infrared spectroscopy. Anal Bioanal Chem 2007;387:1809-1814.
59. Liu KZ, Jia L, Kelsey SM, Newland AC, Mantsch HH. Quantitative determination of apoptosis on leukemia cells by infrared spectroscopy. Apoptosis 2001;6:269-278.
60. Surewicz WK, Mantsch HH. New insight into protein secondary structure from resolution-enhanced infrared spectra. Biochim Biophys Acta 1988;952:115-130.
61. Taillandier E, Liquier J. Infrared spectroscopy of DNA. Methods Enzymol 1992;211:307-335.
62. Severcan F, Gorgulu G, Gorgulu ST, Guray T. Rapid monitoring of diabetes-induced lipid peroxidation by Fourier transform infrared spectroscopy: Evidence from rat liver microsomal
membranes. Anal Biochem 2005;339:36-40.
63. Liu KZ, Bose R, Mantsch HH. Infrared spectroscopic study of diabetic platelets. Vib
Spectrosc 2002;28:131-136.
64.
Sheikhi M, Bouhafs RK, Hammarström KJ, Jarstrand C. Lipid peroxidation caused by oxygen radicals from Fusobacterium-stimulated neutrophils as a possible model for the emergence of periodontitis. Oral Dis 2001;7:41-46.
65. Tsai CC, Chen HS, Chen SL, et al. Lipid peroxidation: A possible role in the induction and progression of chronic periodontitis. J Periodontal Res 2005;40:378-384.
66. Sowa MG, Leonardi L, Payette JR, Cross KM, Gomez M, Fish JS. Classification of burn injuries using near-infrared spectroscopy. J Biomed Opt 2006;11:054002.
67. Sowa MG, Leonardi L, Payette JR, Fish JS, Mantsch HH. Near infrared spectroscopic assessment of hemodynamic changes in the early post-burn period. Burns 2001;27:241-249. 68. Liu KZ, Xiang XM, Man A, et al. In vivo determination of multiple indices of periodontal
inflammation by optical spectroscopy. J Periodontal Res 2009;44:117-124. 69.
Hanioka T, Shizukuishi S, Tsunemitsu A. Hemoglobin concentration and oxygen saturation of clinically healthy and inflamed gingiva in human subjects. J Periodontal Res 1990;25:93-98.
70.
Attas M, Hewko M, Payette J, Posthumus T, Sowa M, Mantsch H. Visualization of cutaneous hemoglobin oxygenation and skin hydration using near-infrared spectroscopic imaging. Skin Res Technol 2001;7:238-245.
71. Löe H, Silness J. Periodontal disease in pregnancy. I. Prevalence and severity. Acta Odontol
Scand 1963;21:533-551.
72. Scott DA, Singer DL. Suppression of overt gingival inflammation in tobacco smokers – Clinical and mechanistic considerations. Int J Dent Hyg 2004;2:104-110.
73. Otal EH, Inon FA, Andrade FJ. Monitoring the temperature of dilute aqueous solutions using near-infrared water absorption. Appl Spectrosc 2003;57:661-666.
74.
Hanioka T, Tanaka M, Ojima M, Takaya K, Matsumori Y, Shizukuishi S. Oxygen sufficiency in the gingiva of smokers and non-smokers with periodontal disease. J
Periodontol 2000;71:1846-1851.
75.
Amano A, Tamagawa H, Takagaki M, Murakami Y, Shizukuishi S, Tsunemitsu A. Relationship between enzyme activities involved in oxygen metabolism and oxygen tolerance in black-pigmented Bacteroides. J Dent Res 1988;67:1196-1199.
76. Loesche WJ. Oxygen sensitivity of various anaerobic bacteria. Appl Microbiol 1969;18:723-727.
77. Bartold PM, Walsh LJ, Narayanan AS. Molecular and cell biology of the gingiva.
Periodontol 2000 2000;24:28-55.
78. Tadrous PJ. Methods for imaging the structure and function of living tissues and cells: Optical coherence tomography. J Pathol 2000;191:115-119.
79.
Delpy DT, Cope M, van der Zee P, Arridge S, Wray S, Wyatt J. Estimation of optical pathlength through tissue from direct time of flight measurement. Phys Med Biol 1988;33:1433-1442.
hamster cheek pouches. J Biomed Opt 2004;9:978-981.
81. Huang D, Swanson EA, Lin CP, et al. Optical coherence tomography. Science 1991;254:1178-1181.
82.
Park BH, Saxer C, Srinivas SM, Nelson JS, de Boer JF. In vivo burn depth determination by high-speed fiber-based polarization sensitive optical coherence tomography. J Biomed Opt 2001;6:474-479.
83. Fercher AF, Hitzenberger CK, Drexler W, Kamp G, Sattmann H. In vivo optical coherence tomography. Am J Ophthalmol 1993;116:113-114.
84.
Yelbuz TM, Choma MA, Thrane L, Kirby ML, Izatt JA. Optical coherence tomography: A new high-resolution imaging technology to study cardiac development in chick embryos.
Circulation 2002;106:2771-2774.
85. Otis LL, Everett MJ, Sathyam US, Colston BW Jr. Optical coherence tomography: A new imaging technology for dentistry. J Am Dent Assoc 2000;131:511-514.
86. Feldchtein F, Gelikonov V, Iksanov R, et al. In vivo OCT imaging of hard and soft tissue of the oral cavity. Opt Express 1998;3:239-250.
87.
Colston BW Jr., Everett MJ, Da Silva LB, Otis LL, Stroeve P, Nathel H. Imaging of hard- and soft-tissue structure in the oral cavity by optical coherence tomography. Appl Opt 1998;37:3582-3585.
88. Machtei EE, Norderyd J, Koch G, Dunford R, Grossi S, Genco RJ. The rate of periodontal attachment loss in subjects with established periodontitis. J Periodontol 1993;64:713-718. 89. Baum G. Application of ultrasound. JAMA 1974;229:1065-1067.
90. Palou ME, McQuade MJ, Rossmann JA. The use of ultrasound for the determination of periodontal bone morphology. J Periodontol 1987;58:262-265.
91. Walmsley AD. Applications of ultrasound in dentistry. Ultrasound Med Biol 1988;14:7-14. 92. Lees S. Ultra-sonics in hard tissues. Int Dent J 1971;21:403-417.
93.
Fukukita H, Yano T, Fukumoto A, Sawada K, Fujimasa T, Sunada I. Development and application of an ultrasonic imaging system for dental diagnosis. J Clin Ultrasound 1985;13:597-600.
94. Spranger H. Ultra-sonic diagnosis of marginal periodontal diseases. Int Dent J 1971;21:442-455.
95. Maev RG. Scanning acoustic microscopy. Fundamentals and applications. Berlin: John Wiley and Sons; 2007. 453 p.
96. Cotti E, Campisi G, Garau V, Puddu G. A new technique for the study of periapical bone lesions: Ultrasound real time imaging. Int Endod J 2002;35:148-152.