Publisher’s version / Version de l'éditeur:
Biomedicine&Pharmacotherapy, 64, 6, pp. 390-395, 2010-03-11
READ THESE TERMS AND CONDITIONS CAREFULLY BEFORE USING THIS WEBSITE.
https://nrc-publications.canada.ca/eng/copyright
Vous avez des questions? Nous pouvons vous aider. Pour communiquer directement avec un auteur, consultez la
première page de la revue dans laquelle son article a été publié afin de trouver ses coordonnées. Si vous n’arrivez pas à les repérer, communiquez avec nous à PublicationsArchive-ArchivesPublications@nrc-cnrc.gc.ca.
Questions? Contact the NRC Publications Archive team at
PublicationsArchive-ArchivesPublications@nrc-cnrc.gc.ca. If you wish to email the authors directly, please see the first page of the publication for their contact information.
NRC Publications Archive
Archives des publications du CNRC
This publication could be one of several versions: author’s original, accepted manuscript or the publisher’s version. / La version de cette publication peut être l’une des suivantes : la version prépublication de l’auteur, la version acceptée du manuscrit ou la version de l’éditeur.
For the publisher’s version, please access the DOI link below./ Pour consulter la version de l’éditeur, utilisez le lien DOI ci-dessous.
https://doi.org/10.1016/j.biopha.2010.02.004
Access and use of this website and the material on it are subject to the Terms and Conditions set forth at
Ex vivo assays of CEM cells cultured and treated in the three dimensional cultures
Bartusik, Dorota; Tomanek, Boguslaw; Lattova, Erika; Perreault, Hélène; Fallone, Gino
https://publications-cnrc.canada.ca/fra/droits
L’accès à ce site Web et l’utilisation de son contenu sont assujettis aux conditions présentées dans le site LISEZ CES CONDITIONS ATTENTIVEMENT AVANT D’UTILISER CE SITE WEB.
NRC Publications Record / Notice d'Archives des publications de CNRC: https://nrc-publications.canada.ca/eng/view/object/?id=4239e3c7-1172-4171-ba48-302719a5393e https://publications-cnrc.canada.ca/fra/voir/objet/?id=4239e3c7-1172-4171-ba48-302719a5393e
Ex vivo assays of CEM cells cultured and treated in the three
dimensional cultures
Bartusik, Dorota; Tomanek, Boguslaw; Lattova, Erika; Perreault,
Hélène; Fallone, Gino
Abstract
This study was aimed at the applications of an ex vivo assays to characterization of CEM
(Human T-Lymphoblastoid) cells. CEM cells were cultured in three dimensional (3-D) geometry in the Hollow Fibre Bioreactor (HFB) device. The cells were treated with Herceptin, anti-HER-2 (clone CB-11) and lipoplex containing lipofectamine (LipA) and plasmid DNA. To identify the response to treatment, the viability was established using Trypan blue assays. Magnetic
resonance imaging (MRI) at 9.4 Tesla (T) was applied for localization of the cells in the HFB device. The structural changes in the cells associated with treatment were examined with matrix-assisted laser desorption/ionization mass spectrometry (MALDI-MS). The tryptic peptides and glycopeptides detected in treated cells provided evidence of the efficacy of antibody binding to the receptor. The results of the study confirmed that cells growth significantly decreased after treatment with antibodies and transfection with lipoplex.
Keywords: Magnetic resonance imaging; Matrix-assisted laser desorption, ionization mass spectrometry; CEM cells
1. Introduction
Effective ex vivo methods for characterization of cancer cells relationship before and after treatment are required to study the efficacy of treatment at the cellular levels. The methods for cellular examination are based on the type of cancer, location and grade of the tumor.
Magnetic Resonance (MR) ex vivo has an ability of noninvasive imaging of the network-like structures and longitudinal track of tumor formation and response to treatments. We applied MR to study the time course of tumor growth and response to treatment in a three-dimensional (3-D) culture system containing CEM (Human T-Lymphoblastoid) cells.
For treatment with the use of monoclonal antibodies we used CEM cells culture expressing HER-2 receptor. Within the body the solid CEM tumor has a unique 3-D organization [1]. Therefore, a culture system that mimics in vivo cancer condition was needed for an appropriate physiological investigation. Moreover, it was already recognized that fundamental differences exist between cancer cells cultured in two-dimensional monolayer (2-D) versus 3-D
configurations in terms of cell-cell access and cell–matrix interactions [2]. These phenomena have ramifications on cancer cells morphology [3], growth and proliferation [4], viability [5] and gene or protein expression [6]. Human CEM cell lines are very sensitive and long-term culture to investigate their viability and functions is very difficult [7]. Therefore, to examine drug efficacy in the cellular model we used Hollow Fiber Bioreactor (HFB) device to obtain 3-D CEM cell culture and applied MR, matrix-assisted laser desorption/ionization (MALDI) and staining
techniques. Recently, the monoclonal antibody received significant attention in cancer treatment and produced stable effects, which can correspond to structural changes suitable for ex vivo measurements. We investigated the immunotargeting of CEM cells using Herceptin and anti-HER-2 (clone CB-11) alone and treated with lipoplex containing lipofectamine (LipA) and DNA plasmid. Lipoplex has a membranous structure, which enhances transferring through the cell membrane due to its polarization [8]. Moreover, LipA is composed of the polycationic lipid 2,3-dioleoxy-N-[2(sperminecarboxymido)ethyl]N,N-dimethyl-1-propanaminium trifluoroacetate (DOSPA) and the neutral lipid dioleolylphosphatidylethanolamine (DOPE) in membrane filtered water [9]. Our hypothesis was that antibodies as a targeting ligand will specifically target HER-2 and nucleic acid and will deliver into cytoplasm more efficiently while used with LipA.
2. Materials and methods
2.1. Cell culture
CEM cells (American Type Culture Collection, Rockville, MD) were maintained in complete Medium RPMI-1640 supplemented with 100 U/ml penicillin, 100 ng/ml streptomycin and 10% Fetal Bovine Serum (FBS). CEM cells were grown in 75 cm2 flask in a humidified incubator at 37 °C and 5% CO2. All compounds for cell culture were supplied by Fisher Scientific (Oakland, ON).
For the 3-D cells culture we used the Hollow Fiber Bioreactor (HFB, FiberSystem Cell Inc., Frederick, MD). HFB device uses a specific fiber to allow cells’ growth on their surfaces. The nutrition and waste is delivered in the controlled manner through the fiber. Moreover, fiber provides a large membrane surface area to volume ratio that permits high mass transfer. HFB provides constant perfusion of medium, nutrients and delivery of oxygen [10].
In our study we used fiber with 0.1 μm diameter pores. When the number of cells in the culture flask reached 105 cells/ml the culture was harvested and then inoculated into the perfused HFB. For cell culturing we used the 14 ml/h media flow rate controlled by a peristaltic pump.
Throughout four weeks of culturing and 3 days of treatments the media reservoir (100 ml) was replaced with fresh media each 5 days. The polysulfone fiber was flushed with 10 ml of solution containing 1 mg collagen per 1 ml PBS. In this manner CEM cells growing originally in
suspension build up a 3-D solid tumor. Total of 30 HFB were used for the study: two for control (untreated cells), one for each tested drug (four drugs) and one HFB for each drug concentration (seven concentrations).
Glucose consumption was determined using a glucometer by analyzing glucose concentration in fresh media and media used during 5 days of cell culturing. Lactate levels were measured using a commercial enzyme-linked immunosorbent assay kit. CEM derived cell lines expressing HER-2 have been described previously [11] and [12]. HER-2 overexpression of this cell line was confirmed by cytometric analysis followed published recommendation [13].
Three samples from each HFB were taken using a syringe to measure cells viability. Viability was assessed using Trypan blue (Sigma-Aldrich, Oakville, ON). Briefly, CEM cells were
harvested from HFB, seeded in six well microplates and exposed to 0.4% (w/v) Trypan blue dye solution [14]. The cell number was determined manually with a hemacytometer chamber
(Hausser Scientific, Horsham, PA). 2.3. Targeting of HER-2
To determine the influence of the antibodies and lipoplexes, we measured CEM cells viability 1 h, 6 h, 24 h, 48 h and 72 h after treatment. The tested concentrations of both Herceptin (Genetech Inc. San Francisco, CA) and anti-HER2 (clone CB-11) (Abcam, Cambridge, MA) were: 0.001 μg/ml, 0.01 μg/ml, 0.1 μg/ml, 1 μg/ml, 10 μg/ml, 20 μg/ml and 100 μg/ml.
The day before the transfection with Lipofectamine™2000 (LipA) (InnoVita Inc. Gaithersburg, MD), the CEM cells were maintained in serum-free growth media without antibiotics. LipA was mixed with each concentration of the antibody to obtain the final ratio of 3:1 [15]. Plasmid DNA containing β-gal was diluted in serum free media and added to mixtures Herceptin/LipA or anti-HER-2 (clone CB-11)/LipA to obtain DNA/LipA ratio of 1:9 (μg/nmol). Then the solution was mixed with medium for 30 min to produce the Herceptin/plasmid DNA complex and anti-HER-2 (clone CB-11)/plasmid DNA complex. The treatment was performed with 3 ml volume of each lipoplexes with 109 cells/ml. After 48 h, serum-free media were replaced with serum-containing media. The cells were washed with PBS and the β-gal activity was measured by enzymatic assay (Promega, E2000) following the manufacturer's recommendation. Moreover, the viability of CEM cells was measured after 72 h treatment with LipA alone and plasmid DNA containing β-gal without antibody. Concentrations of LipA were at ratio of 3/1 (w/w) to previously used antibody concentrations (0.001 μg/ml, 0.01 μg/ml, 0.1 μg/ml, 1 μg/ml, 10 μg/ml, 20 μg/ml and 100 μg/ml) as described above. Plasmid DNA containing β-gal was used at ratio of 1/3 to antibody concentration.
2.4. Magnetic Resonance Imaging
The MRI experiments were performed using a 9.4 Tesla (T) with 21 cm bore magnet (Magnex, England) equipped with TMX console (NRC-IBD, Canada). Images were acquired using a transmit/receive RF volume coil operating at 400 MHz.
To image the 3-D ex vivo aggregation of the CEM cells in the HFB, the spin echo images were acquired with repetition time (TR) = 5000 ms, echo time (TE) = 12.8 ms, FOV = 3 cm × 3 cm, slice thickness 1 mm and matrix size of 256 × 256. To determine the volume of cells, the Region of Interest (ROI) was drawn around the region of the tumor cells before treatment. All remaining voxels within this region were counted and multiplied by the voxel dimensions to produce an enhancement volume. To provide the total structure, five axial slices with 1 mm slice thickness were performed. Based on 1H MR images, the cells samples (> 109 cells/ml) were harvested with a syringe from the region close to the fiber, washed three times with PBS and centrifuged. For each imaging session, HFBs were connected to a reservoir bottle and placed within the MRI compatible chamber with continuous flow of air and CO2 mixture while in the magnet.
Throughout the data acquisition HFB was maintained in 95% air atmosphere with 5% CO2 at 37 °C.
2.5. Trypsin digestion
The cells (0.2 mg) were dissolved in 25 mM ammonium bicarbonate (100 (l) and digested with trypsin (Promega, Madison, WI) at 37oC for 20 h, at a substrate-to-enzyme ratio of 50:1. After incubation, the digests were frozen to terminate the reaction. Prior to fractionation, digests were
in vacuo evaporated and volume was adjusted to volume 50 μl with deionized water.
2.6. Fractionation of digested cells
Digested cell samples were fractionated with a Gold HPLC chromatograph system equipped with a Gold 166 Ultra Violet (UV) Detector and 32-Karat software (Beckman-Coulter, Mississauga, ON). For reversed-phase HPLC, a Vydac 218 TP54 Protein & Peptide C18 analytical column, 300 Ǻ pore size, 0.46 cm × 25 cm (Separation Group, Hesperia, CA) was used. The
chromatograph was equipped with a Rheodyne injector (5 μl). UV detection was performed at 245 nm. Eluent A consisted of 5% acetonitrile (ACN) water solution and eluent B of 0.01% trifluoroacetic acid in 95% ACN water solution. A linear gradient from 5 to 70% ACN was applied over 60 min. All fractions were collected manually and concentrated in vacuo. Deionized water (5 μl) was added to all dried fractions and analyzed by mass spectrometry (MS).
2.7. MALDI - mass spectrometric analysis
MALDI-MS and tandem MS/MS analyses were carried out on the Manitoba/Sciex quadrupole-quadrupole-TOF (QqTOF) mass spectrometer [16]. Typically, the samples were spotted onto 2,5 dihydroxybenzoic acid matrix or onto a mixture of
2-aza-2-thiothymine/phenylhydrazine-hydrochloric acid (molar ratio 2:1), predeposited on the surface of a MALDI target. Peptide mass fingerprinting was achieved in positive MS mode and peptide identifications were performed with Mascot (www.matrixscience.com) database search. Search parameters included less than 0.01 Da mass error with no missed cleavages. MS results were confirmed by sequencing the tryptic peptides in MS/MS mode, and ion peaks assigned manually or searched against the National Centre for Biotechnology Information database Mascot MS/MS system.
Deglycosylation of the glycopeptide mixtures was performed with peptide-N-glycosidase F (PNGaseF) treatment according to the procedures described previously [17] and [18]. 2.8. Statistical analysis
Results were expressed as a mean ± SD. Differences between groups at each time-point were identified by one-way Anova. Statistical comparison between two independent variables was determined by two-way Anova with Dunnet's correction performed post-hoc to correct multiple comparisons. The p-values < 0.05 were considered statistically significant. All data reported here are from sets of three separate experiments. Error bars in all graphs represents the standard error of the mean. The data were analyzed using the Sigma Stat Soft (Chicago, IL) software.
The control CEM cells cultured in the HFB reached a density of 109 cells/mL within 4 weeks. The percentage of area occupied by CEM cells in the HFB device increased over the course of the experiment. The MRI analysis used to study the cells’ aggregation showed that the volume of tumor cells increased from 21 ± 3 mm3 to 61 ± 7 mm3, after 4 weeks. Fig. 1 showed particular MR image of the growing tumor cells. An increased number of CEM cells was counted with Trypan blue and was 5 × 10⁵ cells/ml, 5.0 × 10⁷ cells/ml, 6.3 × 10⁸ cells/ml and 109 cells/ml, measured from 1 to 4 weeks respectively. The average glucose consumption rate in the control cells was 1.2 ± 0.3 mg/h, while the average lactic acid production was 2 ± 0.1 mg/h.
Fig. 1.
An MR image of the CEM cells in the Hollow Fiber Bioreactor (HFB) at 9.4 Tesla. SE pulse sequence (TR/TE = 5000/12.8 ms, FOV = 3 cm × 3 cm, slice thickness 1 mm and matrix
256 × 256) was used. The red lines indicate the fiber, area of cell harvesting and the total area of growing CEM cells.
The collected viability data illustrated in Fig. 2 indicated changes in viable cells number after 1 h and 72 h treatment with different drug concentrations. The viability after 6 h, 24 h and 48 h of the treatment was between the values obtained for 1 h and 72 h and these results were not presented for clarity. Viability of cells after 1 h of treatment with 0.001 μg/ml and 100 μg/ml Herceptin was 83 ± 3% and 69 ± 2%, respectively (Fig. 2a). After 72 h, the viability of the cells treated with the same concentrations of Herceptin was 80 ± 3% and 63 ± 2% respectively (Fig. 2b). The study of anti-HER2 (clone CB-11) treatments showed that after 1 h of treatment with 0.001 μg/ml and 100 μg/ml concentrations, CEM cell viability was 86 ± 1% and 70 ± 2% respectively (Fig. 2c). After 72 h, the viability of CEM cells was 79 ± 1% and 65 ± 1% for the same concentrations (Fig. 2d). Similar studies of cells treated with Herceptin/lipoplex showed that the viability of CEM cells was 76 ± 3% and 61 ± 2% after 1 h (Fig. 2a) and 73 ± 2% and 55 ± 4%, after 72 h of exposure to treatment of 0.001 μg/ml and 100 μg/ml concentrations respectively (Fig. 2b). The study of anti-HER-2/lipoplex treatments showed that viability of cells was 83 ± 3% and 64 ± 2% after 1 h (Fig. 2c) and 76 ± 3% and 62 ± 4% after 72 h (Fig. 2d) for the same concentrations.
Fig. 2.
Viability of the CEM cells after: (a) 1 h and (b) 72 h exposure to Herceptin and
Herceptin/lipoplex as well as (c) 1 h and (d) 72 h after exposure to anti-HER-2(clone CB-11) and anti-HER-2 (clone CB-11)/lipoplex. Statistically significant differences are indicated with an asterisk (*).
A significant difference in cell viability was observed in treatments with Herceptin and Herceptin/lipoplex at a concentration of 0.01 μg/ml and higher after 1 h (Fig. 2a) and at each concentration after 72 h (Fig. 2b). For anti-HER-2(clone 11) and anti-HER-2(clone CB-11)/lipoplex treatments significant changes were observed at concentrations 0.01 μg/ml, 0.1 μg/ml and 1 μg/ml after 1 h (Fig. 2c) and at concentrations 0.01 μg/ml, 0.1 μg/ml, 1 μg/ml, 10 μg/ml, 20 μg/ml, after 72 h (Fig. 2d).
CEM cells treated with Herceptin/lipoplex (3/1) showed an increased treatment efficiency with a three-fold increase of β-gal expression as compared with non-treated one. The viability of cells treated with plasmid DNA containing β-gal reached values higher than cell treated with
Herceptin/lipoplex and lower than cells treated with Herceptin, after 72 h. The viability of cells treated with plasmid DNA containing β-gal was 87 ± 3%, 85 ± 2%, 79 ± 1%, 77 ± 4% and 74 ± 6%, after 72 h. We did not observe decreases in the growth of CEM cells treated with LipA only.
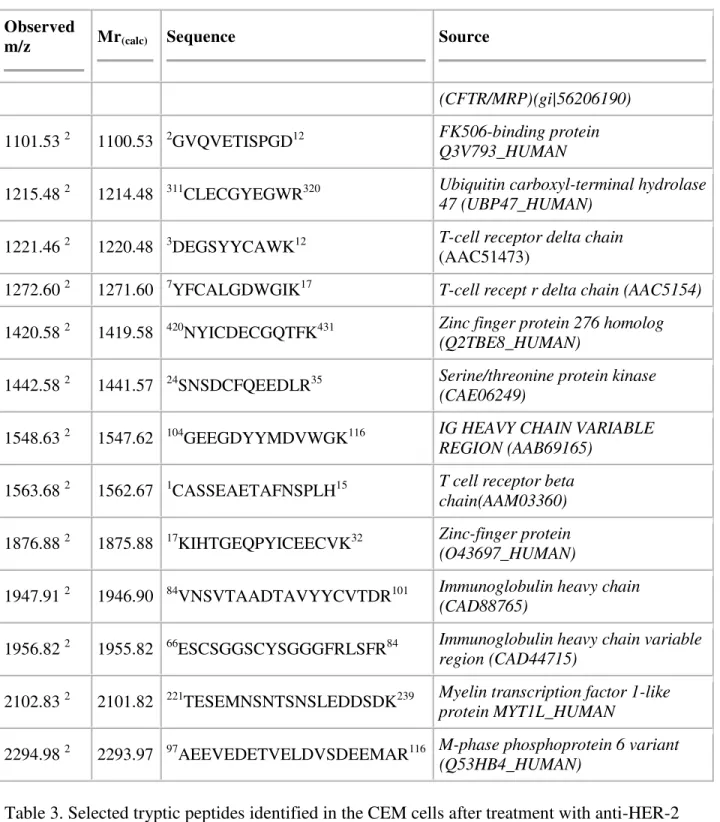
The relationship between conditions of immunotargeted cells was also studied using MS. The profiles observed for tryptic peptides in untreated samples were compared to tryptic profiles in immunotargeted CEM samples. The selected peaks observed in the single cell lines before and after treatment with Herceptin and anti-HER-2 (clone CB-11) are listed in [Table 1], [Table 2]
and [Table 3] respectively. Numerous peptides were associated with sequences originating from the immunoglobulin heavy chain and were identified in all samples examined. In original CEM cells we observed the expression of the mixed leukemia peptides that belongs to the group of histone-modifying enzymes and are involved in the pathogenesis of human leukemia [19]. Based on MS studies of cells treated with Herceptin, we identified cyclic GMP protein indicating possible changes in HER-2 receptor structure after treatments [20]. As a result of the treatment with anti-HER-2 (clone CB-11), we observed peptides that suggest increased transcription rates and belong to AP-2B receptor and ATP-binding cassette that transport a diverse set of substrates across membranes [21]. We determined that fibronectin leucine protein is located at the CEM
cell surface, after treatment with anti-HER-2 (clone CB-11). Moreover, the human programmed cells’ death peptides were also expressed in tumor cells and are specific during apoptosis [22]. Table 1. Selected tryptic peptides identified in the CEM cells without treatment (1).
Observed
m/z Mr(calc) Sequence Source
897.43 1 896.42 8LSGGGYTDK16 T cell receptor delta chain (AAA69884)
916.47 1 915.46 19VNVDEVGGK27 Mutant beta-globin (Q9HAR8_HUMAN)
1039.51 1 1038.50 20RDLEYTDK27 T-cell receptor V delta 1(AAK62928)
1090.55 1 1089.54 24KLEDEFPGR32 Selenoprotein W (SEPW1_HUMAN)
1099.55 1 1098.54 25TIYQFHYK32 Protein tyrosine phosphatase PEP
(Q93095_HUMAN)
1117.54 1 1116.53 13DIDEDEILR21 Tropomodulin 4 Q5JR82_HUMAN
1118.54 1 1117.53 91AHRGIYGMDV100 Immunoglobulin heavy chain (CAB76479)
1145.47 1 1144.46 305CGECEKSFSR314 Zinc finger protein zf (Q92967_HUMAN)
1331.68 1 1330.67 71NTMEALPACLLR82 Thymidine kinase KIHUT
1380.62 1 1379.61 1MGQSFSCSLHQR12 Transcript Y 14 (Q9BZ96_HUMAN)
1499.65 1 1498.65 246FTGDSGIEVCVCNR259 Outcome predictor in acute leukemia
1(Q1EG70_HUMAN)
1516.72 1 1515.71 2HTGGETSACKPSSVR16 MNB/DYRK protein kinase
(Q76N25_HUMAN)
1706.85 1 1705.83 180KPLDIDYMGEEQLR193 Troponin T1 (Q5U0E1_HUMAN)
1744.81 1 1743.80 206FQFTEHRCHQHFK218 Mixed-lineage leukemia 5
(Q86WG0_HUMAN)
Table 2. Selected tryptic peptides identified in the CEM cells after treatment with Herceptin (2).
Observed
m/z Mr(calc) Sequence Source
836.41 2 835.40 68AHSQTHR74 Leucocyte antigen A
Q8SNB3_HUMAN
947.38 2 946.46 4AGPSFGQQR12 Cyclic GMP-specific
phosphodiesterase PDE5A1(Q9P0K6)
Observed
m/z Mr(calc) Sequence Source
(CFTR/MRP)(gi|56206190)
1101.53 2 1100.53 2GVQVETISPGD12 FK506-binding protein
Q3V793_HUMAN
1215.48 2 1214.48 311CLECGYEGWR320 Ubiquitin carboxyl-terminal hydrolase
47 (UBP47_HUMAN)
1221.46 2 1220.48 3DEGSYYCAWK12 T-cell receptor delta chain
(AAC51473)
1272.60 2 1271.60 7YFCALGDWGIK17 T-cell recept r delta chain (AAC5154)
1420.58 2 1419.58 420NYICDECGQTFK431 Zinc finger protein 276 homolog
(Q2TBE8_HUMAN)
1442.58 2 1441.57 24SNSDCFQEEDLR35 Serine/threonine protein kinase
(CAE06249)
1548.63 2 1547.62 104GEEGDYYMDVWGK116 IG HEAVY CHAIN VARIABLE
REGION (AAB69165)
1563.68 2 1562.67 1CASSEAETAFNSPLH15 T cell receptor beta
chain(AAM03360)
1876.88 2 1875.88 17KIHTGEQPYICEECVK32 Zinc-finger protein
(O43697_HUMAN)
1947.91 2 1946.90 84VNSVTAADTAVYYCVTDR101 Immunoglobulin heavy chain
(CAD88765)
1956.82 2 1955.82 66ESCSGGSCYSGGGFRLSFR84 Immunoglobulin heavy chain variable
region (CAD44715)
2102.83 2 2101.82 221TESEMNSNTSNSLEDDSDK239 Myelin transcription factor 1-like
protein MYT1L_HUMAN
2294.98 2 2293.97 97AEEVEDETVELDVSDEEMAR116 M-phase phosphoprotein 6 variant
(Q53HB4_HUMAN)
Table 3. Selected tryptic peptides identified in the CEM cells after treatment with anti-HER-2 clone CB-11 (3).
Observed
m/z Mr(calc) Sequence Source
834.43 3 833.42 5MWRDVK10 Mitochondrial ribosomal protein S14
Observed
m/z Mr(calc) Sequence Source
1022.46 3 1021.46 1MHFLCCLR8 Human prothomysin-lpha pseudogene (AAA63241)
1130.58 3 1129.58 36KYTSWYVALK44 FGF2 protein (Q2NKM4_HUMAN)
1189.56 3 1188.56 1GSADEELEALR11
Chain A, solution structure of 1-26 fragment of human programmed cell death 5 protein (gi|78101022)
1244.66 3 1243.65 1AMTWVRQAPGK11 Immunoglobulin heavy chain variable region
(CAD48904)
1315.57 3 1314.56 663DGGIPDIDYSYT674 Fibronectin leucine rich transmembrane protein
1(Q8WVA2_HUMAN)
1347.59 3 1346.59 338CEWNYFMAKR347 Transcription negative regulator AP-2B – human
(A48135)
The most noticeable posttranslational changes in proteins were observed at the level of
glycosylation. Glycopeptides in tryptic digests of original CEM cells and samples treated only with Herceptin or anti-HER-2 (clone CB-11) were generally not observed or were present in amounts beyond the detection limit. However, the tryptic digest obtained from the cells treated with Herceptin in combination with LipA comprised fractions of glycopeptides, as shown by peaks with typical monosaccharide mass differences of 146, 162, 203 or 291 Da. The most abundant ions of glycosylated peptides were observed at m/z 2634.1 and 2796.2 (Fig. 3). To verify the composition, all peak ions recognized as glycopeptides were further subjected to tandem MS analysis. Fig. 4 shows MALDI-MS/MS spectra of two less abundant glycopeptides with parent precursor ions at m/z 2488.0 and 2958.1. Both these ions indicated a peptide with the same mass (m/z 1189.5) but differing in the glycosylation patterns. To confirm the origin of the peptide sequence and the composition of oligosaccharides linked at asparagine, glycans were enzymatically detached with PNGase and analyzed next to the deglycosylated peptides [17] and
[18]. The fragmentation pattern of the peptide observed at m/z 1190.5 was consistent with the sequence of amino acids EEQYDSTYR described previously in human IgG [17] and [23]. N-glycans linked at asparagine in EEQYNSTYR or EEQFNSTYR sequences corresponded to biantennary oligosaccharide structures with fucose linked at 6-position of the reducing GlcNAc residue (Fig. 4).
Fig. 3.
Positive MALDI-MS spectrum recorded with QqTOF spectrometer from HPLC fraction
obtained from trypsin digested CEM cells treated with Herceptin/lipoplex. All ions are [M + H]+. Peaks at m/z 2406.0, 2488.0, 2634.1, 2796.2, 2812.2 and 2959.2 (red color) correspond to
glycopeptides with peptide sequence EEQYNSTYR and peaks observed at m/z 2619.1 and 2781.2 (blue) match to glycopeptides with peptide sequence EEQFNSTYR found in human monoclonal IgG. Symbols: ○: mannose (Man); ●: galactose (Gal); ■: N-acetylglucosamine (GlcNAc); : fucose (Fuc).
Fig. 4.
Positive MALDI-MS/MS spectra of glycopeptides with (a) m/z 2489.0 and (b) m/z 2958.1 obtained from digested CEM cells after treatment with Herceptin/lipoplex. Symbols the same as in Fig. 3.
4. Discussion
A variety of techniques and reagents have been developed to study cell death. Methods for detecting and quantifying of cells are based on standard histological stains or fluorescent dyes
[24], light microscopy and electron microscopy [25]. In oncology, imaging of cell death has gained interest for the assessment of tumor response to cancer therapy. However, the accurate determination of the cancer cells’ response to various treatments is still not widely achieved. Non-invasive MR-based imaging techniques have the ability to differentiate between treated and
untreated cells. Therefore, the use of MR compatible HFB device was described here for studying the growing and inhibition of CEM cells’ growth using MRI measurements. It is already known that 3-D cell cultures reproduce physiological behaviors of tissue in a simplified environment [26]. Moreover, the standard 2-D culture methods produce rather low cell concentrations, which are difficult or impossible to detect with the use of MRI, while 3-D provides concentration which is high enough and reflects tumor in vivo conditions in a better way.
Targeted HER-2 is overexpressed in a variety of tumors’ cells of epithelial origin and hematological malignancies including acute lymphoblastic leukemia (ALL) [27]. The major barrier for the delivery of monoclonal antibodies to cancerous cells is the cellular membrane. Substantial advances have been made in the use of cationic lipids that can efficiently deliver antibodies and nucleic acid from cell media into the cytoplasm and nucleus of cells [28] and
[29]. In our study we observed that lipoplexes had a larger effect on CEM cells than antibody alone. Anti-HER-2 (clone CB-11) induced a small decrease in cell growth but this effect was magnified in combination with lipoplex. Therefore, the low binding effects measured using cells’ viability was specific to Herceptin or anti-HER-2 (clone CB-11) interactions with HER-2
receptor and not due to unspecific binding processes. An important proof for this is the absence of increased binding events when an excess amount of antibody was added in the media as observed in the composition of peptides.
Various glycoproteins and sugar molecules present in the oncogenic cellular plasma of CEM cells contribute to inhibition of cells’ growth observed during immunotargeting. Some previous studies on cancer cells have already reported a link between the fibronectin leucine protein and HER-2 receptor expression in human carcinomas cells [30], as well as the possibility that fibronectin leucine acts as a suppressor of tumor cell growth [21] and [31]. Moreover,
determined peptides of AP-2 receptor have also a potential role in regulating insulin-like growth factor expression [32], which is involved in regulating the HER-2 expression. However, it is as yet unclear whether the transfection activity could be due to internalization of lipoplex and/or due to an improved ability to fuse with or perturb membrane, necessary for allowing the plasmid gain to cytoplasm [33].
To sum up, we observed that it is possible to enhance the efficacy of Herceptin and anti-HER-2 clone (CB-11) by the treatment with lipoplex. The combination of the antibodies with lipoplex presents a possibility for the simultaneous delivery of antibodies to the cell surface and plasmid DNA to cell cytoplasm. The results presented here provide good evidence for the applicability of this new probe in potential drug delivery investigations. Application of high field MRI enables study of CEM cells in a controlled environment and examination of tissue structure at high resolution. At the same time, valuable physiological information can be extracted from small clusters of cells, while quantitative investigations of drug delivery are crucial for the
development of effective therapy. Therefore, ex vivo assays of 3-D cultures offer a specific way to study tumor response to cancer therapy.
None.
References
[1] L.G. Griffith and M.A. Swartz, Capturing complex 3D tissue physiology in vitro, Nat Rev
Mol Cell Biol 7 (2006), pp. 211–224.
[2] A. Abbott, Biology's new dimension, Nature424 (2003), pp. 870–872.
[3] J.E. Fata, A.T. Ho, K.J. Leco, R.A. Moorehead and R. Khokha, Cellular turnover and extracellular matrix remodeling in female reproductive tissues: functions of metalloproteinases and their inhibitors, Cell Mol Life Sci 57 (2000), pp. 77–95.
[4] E. Cukierman, E. Pankov, D.R. Stevens and K.M. Yamanda, Taking cell-matrix adhesions to the third dimension, Science 294 (2001), pp. 1708–1712.
[5] T. Takezawa, Y. Mori, T. Yonaha and K. Yoshizato, Characterization of morphology and cellular metabolism during the spheroid formation by fibroblasts, Exp Cell Res 208 (1993), pp. 430–441.
[6] A. Ivascu and M. Kubbies, Diversity of cell-mediated adhesions in breast cancer spheroids,
Int J Oncol 31 (2007), pp. 1403–1413.
[7] DeBartolo L, Drioli. Membranes in artificial organs. in: P.I. Haris, D. Chapman (eds.), Biomedical and Health Research: New Biomedical Materials-Basic and Applied Studies, IOS Press, Amsterdam/Berlin/Oxford/Tokyo/Washington, 1998, pp. 167–81.
[8] I.S. Zuhorn, D. Kalicharan, G.T. Robillard and D. Hoekstra, Adhesion receptors mediate efficient non-viral gene delivery, Mol Therapy 15 (2007), pp. 946–953.
[9] J.H. Felgner, R. Kumar, C.N. Sridhar, C.J. Wheeler, Y.J. Tsai and R. Border et al., Enhanced gene delivery and mechanism studies with a novel series of cationic lipid formulations, J Biol
Chem 269 (1994), pp. 2550–2561.
[10] M.N. Kirstein, R.C. Brundage, W.F. Elmquist, R.P. Remmel, P.H. Marker and D.E. Guire et
al., Characterization of an in vitro cell culture bioreactor system to evaluate anti-neoplastic drug
regimens, Breast Cancer Res Treat 96 (2006), pp. 203–301.
[11] G.D. Plowman, J.M. Green, J.M. Culouscou, G.W. Carlton, V.M. Rothwell and S. Buckley, Heregulin induces tyrosine phosphorylation of HER4/pl8OerbB4, Nature 366 (1993), pp. 473– 475.
[12] D.J. Riese, T.M. van Raaij, G.D. Plowman, G.C. Andrews and D.F. Stern, The cellular response to neuregulins is governed by complex interactions of the erbB receptor family, Mol
[13] K. Kono and Y. Rongcun, Identification of HER2/neuderived peptide epitopes recognized by gastric cancer-specific CTLs, Charo J. Int J Cancer 78 (1998), pp. 202–208.
[14] K. Takahashi and G. Loo, Disruption of mitochondria during tocotrienol-induced apoptosis in MDAMB-231 human breast cancer cells, Biochem Pharm 67 (2004), pp. 315–324.
[15] L. Xu, P. Frederik, K.F. Pirollo, W.H. Tang, A. Rait and L.M. Xiang et al., Self-assembly of a virus-mimicking nanostructure system for efficient tumor-targeted gene delivery, Hum Gene
Ther 13 (2002), pp. 469–481.
[16] A.V. Loboda, N.N. Krutchinsky, M.P. Bromirski, W. Ens and K.G. Standing, A tandem quadrupole/time-offlight mass spectrometer with a matrix-assisted laser desorption/ionization source: design and performance, Rapid Commun Mass Spectrom 14 (2000), pp. 1047–1057.
[17] E. Lattová, P. Kapková, O. Krokhin and H. Perreault, Method for investigation of
oligosaccharides from glycopeptides: direct determination of glycosylation sites in proteins, Anal
Chem 78 (2006), pp. 2977–2984.
[18] E. Lattová, S. Varma, T. Bezabeh and H. Perreault, Matrix-assisted laser desorption/ionization on-target method for the investigation of oligosaccharides and glycosylation sites in glycopeptides and glycoproteins, Rapid Commun Mass Spectrom 21 (2007), pp. 1644–1650.
[19] M.G. Guenther, R.G. Jenner, B. Chevalier, T. Nakamura, C.M. Croce and E. Canaani et al., Global and Hox-specific roles for the MLL1 methyltransferase, Proc Natl Acad Sci U S A 102 (24) (2005), pp. 8603–8608.
[20] R. Richie-Jannetta, J.L. Busch, K.A. Higgins, J.D. Corbin and S.H. Francis, Isolated regulatory domains of cGMP-dependent protein kinase Ialpha and Ibeta retain dimerization and native cGMP-binding properties and undergo isoform-specific conformational changes, J Biol
Chem 281 (11) (2006), pp. 6977–6984.
[21] M.B. Laederich, M. Funes-Duran, L. Yen, E. Ingalla, X. Wu and K.L. Carraway III et al., The leucine-rich repeat protein LRIG1 is a negative regulator of ErbB family receptor tyrosine kinases, Biol Chem 279 (45) (2004), pp. 47050–47056.
[22] C. Duan and D.R. Clemmons, Transcription factor AP-2 regulates human insulin-like growth factor binding protein-5 gene expression, J Biol Chem 270 (42) (1995), pp. 24844– 24851.
[23] H. Posting and N. Hilschmann, The rule of antibody structure, Hoppe Seylers Z Physiol
Chem 357 (1976), pp. 1571–1604.
[24] N.J. McCarthy and G.I. Evan, Methods for detecting and quantifying apoptosis, Curr Top
[25] J.F. Kerr, A.H. Wyllie and A.R. Currie, Apoptosis: a basic biological phenomenon with wide-ranging implications in tissue kinetics, Br J Cancer 26 (1972), pp. 239–257.
[26] Y. Martin and P. Vermette, Bioreactors for tissue mass culture: design, characterization, and recent advances, Biomaterials 26 (2005), pp. 7481–7503.
[27] N.E. Hynes and D.F. Stern, Biological effects of anti-ErbB2 single chain antibodies selected for internalizing function, Biochim Biophys Acta 1198 (1994), pp. 165–184.
[28] R.J. Mahato, J. Henry, A.S. Narang, O. Sabek, D. Fraga and M. Kotb et al., Cationic lipid and polymer-based gene delivery to human pancreatic islets, Mol Therapy 7 (2003), pp. 89–100.
[29] B. Dalby, S. Cates, A. Harris, E.C. Ohki, M.L. Tilkins and P.J. Price et al., Advanced transfection with Lipofectamine 2000 reagent: primary neurons, siRNA, and high-throughput applications, Methods 33 (2004), pp. 95–103.
[30] M. Thomasson, H. Hedman, D. Guo, B. Ljungberg and R. Henriksson, LRIG1 and epidermal growth factor receptor in renal cell carcinoma: a quantitative RT-PCR and immunohistochemical analysis, Br J Cancer 89 (2003), pp. 1285–1289.
[31] H. Hedman, J. Nilsson, D. Guo and R. Henriksson, Is LRIG1 a tumour suppressor gene at chromosome 3p14. 3?, Acta Oncol 41 (2002), pp. 352–354.
[32] M. Li, Y. Wang, M.C. Hung and P. Kannan, Inefficient proteasomaldegradation pathway stabilizes AP-2 alpha and activates HER-2/neu gene in breast cancer, Int J Cancer 118 (2006), pp. 802–811.
[33] T. Akao, T. Fukumoto, H. Ihara and A. Ito, Conformational changes in DNA induced by cationic bilayer membranes, FEBS Lett 391 (1996), pp. 215–218.