Publisher’s version / Version de l'éditeur:
The Astronomical Journal, 150, 2, p. 51, 2015-08-01
READ THESE TERMS AND CONDITIONS CAREFULLY BEFORE USING THIS WEBSITE. https://nrc-publications.canada.ca/eng/copyright
Vous avez des questions? Nous pouvons vous aider. Pour communiquer directement avec un auteur, consultez la
première page de la revue dans laquelle son article a été publié afin de trouver ses coordonnées. Si vous n’arrivez pas à les repérer, communiquez avec nous à PublicationsArchive-ArchivesPublications@nrc-cnrc.gc.ca.
Questions? Contact the NRC Publications Archive team at
PublicationsArchive-ArchivesPublications@nrc-cnrc.gc.ca. If you wish to email the authors directly, please see the first page of the publication for their contact information.
NRC Publications Archive
Archives des publications du CNRC
This publication could be one of several versions: author’s original, accepted manuscript or the publisher’s version. / La version de cette publication peut être l’une des suivantes : la version prépublication de l’auteur, la version acceptée du manuscrit ou la version de l’éditeur.
For the publisher’s version, please access the DOI link below./ Pour consulter la version de l’éditeur, utilisez le lien DOI ci-dessous.
https://doi.org/10.1088/0004-6256/150/2/51
Access and use of this website and the material on it are subject to the Terms and Conditions set forth at
On the absolute age of the metal-rich globular M71 (NGC 6838). I.
Optical photometry
Cecco, A. Di; Bono, G.; Moroni, P. G. Prada; Tognelli, E.; Allard, F.; Stetson,
P. B.; Buonanno, R.; Ferraro, I.; Iannicola, G.; Monelli, M.; Nonino, M.;
Pulone, L.
https://publications-cnrc.canada.ca/fra/droits
L’accès à ce site Web et l’utilisation de son contenu sont assujettis aux conditions présentées dans le site LISEZ CES CONDITIONS ATTENTIVEMENT AVANT D’UTILISER CE SITE WEB.
NRC Publications Record / Notice d'Archives des publications de CNRC:
https://nrc-publications.canada.ca/eng/view/object/?id=9e854c5a-b310-456f-9514-4d5005eca7d3 https://publications-cnrc.canada.ca/fra/voir/objet/?id=9e854c5a-b310-456f-9514-4d5005eca7d3ABSTRACT
We investigated the absolute age of the Galactic globular cluster M71(NGC 6838) using optical ground-based images(u g r i z¢ ¢ ¢ ¢ ¢) collected with the MegaCam camera at the Canada–France–Hawaii Telescope (CFHT)., , , , We performed a robust selection of field and cluster stars by applying a new method based on the 3D (r u¢ ¢ - ¢ ¢ - ¢) color–color–magnitude diagram. A comparison between thecolor–magnitude diagram, g g, r
(CMD) of the candidate cluster stars and a new set of isochrones at the locus of the main sequence turn-off (MSTO) suggests an absolute age of 12 ± 2 Gyr. The absolute age was also estimated using the difference in magnitude between the MSTO and the so-called main sequence knee, a well-defined bending occurring in the lower main sequence. This feature was originally detected in the near-infrared bands and explained as a consequence of an opacity mechanism(collisionally induced absorption of molecular hydrogen) in the atmosphere of cool low-mass stars. The same feature was also detected in the r′, u¢ - ¢, and in the r gg ¢ ¢ - ¢ CMD, thus, r
supporting previous theoretical predictions by Borysow et al. The key advantage in using theDTOKnee as an age diagnostic is that it is independent of uncertainties affecting the distance, the reddening, and the photometric zero point. We found an absolute age of 12± 1 Gyr that agrees, within the errors, with similar age estimates, but the uncertainty is on average a factor of two smaller. We also found that theDTOKneeis more sensitive to the metallicity than the MSTO, but the dependence vanishes when using the difference in color between the MSK and the MSTO.
Key words:globular clusters: individual (M71)
1. INTRODUCTION
The Galactic globular cluster (GGC) M71—NGC 6838— ([Fe/H] = −0.78 dex, Harris 1996) is a very interesting stellar system since it belongs to the small sample of metal-rich GCs present in our Galaxy (Harris 1996) and in the Local Group (Cezario et al.2013). Moreover, it is located relatively close; its distance is smaller than 4 kpc(Grundahl et al.2002). This means that M71 is a fundamental laboratory for constraining the evolution of old, metal-rich, low-mass stars(Hodder et al.1992). The absolute age of M71 can also play a key role in the occurrence of a bifurcation in the age–metallicity relation (AMR) of inner and outer halo GGCs recently suggested by Dotter et al. (2011). Moreover, M71, together with a few more metal-rich GGCs (47 Tuc, NGC 6528, NGC 6553), plays a fundamental role in the calibration of spectrophotometric indices adopted to constrain the age, the metallicity, and the shape of the initial mass function of unresolved stellar populations in early-type galaxies (Boselli et al. 2009; Cappellari et al. 2012; Conroy & van Dokkum2012; Spiniello et al.2012; Conroy et al.2013).
The main drawback of M71 is that it is affected by a large reddening with a mean value12 of áE B V( - ñ = 0.323 ±)
0.017 mag (Schlegel et al. 1998) and by a differential reddening with a mean value of ádE B V( - ñ = 0.035 ±) 0.015 mag, which extends up to a maximum value of
E B V( )
d - = 0.074 mag (Bonatto et al.2013; for the reddening values see also Kron & Guetter 1976; Frogel et al. 1979; Hodder et al.1992; Kraft & Ivans2003). This is mainly due to the fact that M71 is located at very low Galactic latitude (l = 56◦. 75, b= −4◦. 56).
The literature concerning the age estimates of M71 is quite rich. By comparing optical CCD photometry with the oxygen enhanced models of Bergbush & VandenBerg (1992), Hodder et al. (1992) found that M71 has an age in good agreement with the 14 ± 2 and 16 ± 2 Gyr isochrones. They also found that M71 is coeval with 47 Tuc, while, using the same theoretical models, Geffert & Maintz (2000) suggested for M71 an older age (18 Gyr). By calibrating the cluster distance with the Hipparcos field subdwarfs parallaxes, and by adopting a reddening of
E B V( - )= 0.28 mag, Reid (1998) found a true distance modulus of μ=13.19±0.15 mag and an absolute age of 8 ± 1 Gyr (as estimated from his Figure 10(a)). He also suggested that 47 Tuc, within the uncertainties, is coeval(10 ± 1 Gyr).
The Hipparcos catalog was also used with Stroëmgren photometry by Grundahl et al. (2002), who derived a true 12
The mean value has been calculated using the online tool available athttp:// irsa.ipac.caltech.edu/applications/DUST/.
distance modulus of μ= 12.84 ± 0.04 ± 0.113
mag by adopting E B V( - )= 0.28 mag. By comparing the M71 data with the isochrones from VandenBerg et al.(2000), the authors also provided an absolute age of 12 Gyr and found the same age for 47 Tuc.
After the transformation of the Clem et al. (2008) M71 fiducial sequence to the SDSS bands with the equations provided by Tucker et al. (2006), and assuming E B V( - ) = 0.28 mag, An et al. (2009) found a distance modulus of μ= 12.86 ± 0.08 mag and μ = 12.96 ± 0.08 mag, respec-tively, according to the metallicity scale provided by Kraft & Ivans(2003) and Carretta & Gratton (1997).
To further improve the temperature sensitivity around the main sequence turn-off (MSTO), Brasseur et al. (2010) adopted optical–near-infrared (NIR) colors and, using a true distance modulus of μ= 13.16 mag and a mean cluster reddening of E B V( - )= 0.20 mag, they found an absolute age of 11 Gyr. This age estimate was based on a new set of cluster isochrones computed by VandenBerg et al. (2012). More recently, Vandenberg et al.(2013, hereafterV13), using homogeneous optical photometry based on WFC/Advanced Camera for Surveys (ACS; on board the HST) images, provided accurate relative ages for 55 Galactic globulars. They adopted an improved vertical method and a new approach to fit horizontal branch(HB) stars with predicted zero-age horizontal branch models. They found for M71 an absolute age of 11.00 ± 0.38 Gyr.
In a more recent paper, by investigating the age of 61 GCs, Leaman et al. (2013, hereafter LVM13) found that for abundances [Fe/H] ⩾ 1.8 dex, the GCs obey two different AMRs. In particular, they found that one-third of the entire sample is, at a fixed cluster age, systematically more metal-rich by 0.6 dex. Moreover, they suggest that the bulk of the metal-rich sequence formed in situ in the Galactic disk, while a significant fraction of the metal-poor globulars formed in dwarf galaxies that were subsequently accreted by the Milky Way. However, the current scenario concerning the absolute age distribution of GCs is far from being settled. In a similar investigation, Marin-Franch et al.(2009), using homogeneous photometry for a sample of 64 globulars, found that the bulk of GCs are coeval, their spread in age being smaller than 5%, and do not display an AMR. They also found a small group of systematically younger clusters that display an AMR similar to the globulars associated with the Sagittarius dwarf galaxy. To take account of the observed age distribution, they suggested that the old globulars formed in situ, while the young ones formed in dwarf galaxies that were later accreted.
V13 and LVM13did not include in their sample reddened bulge GCs, but on the basis of the AMR relation they found for metal-rich clusters, they predicted steadily decreasing ages for more metal-rich bulge clusters (see their Section 7.3). In particular, for the prototype metal-rich bulge cluster NGC 6528 they predicted an age of 10 Gyr. On the other hand, Lagioia et al. (2014), using WFC/ACS and UVIS/WFC3 images that cover a time interval of 10 years, performed an accurate proper motion separation between field and cluster stars in NGC 6528. On the basis of optical photometry they found that NGC 6528 is old(12 Gyr) and coeval with 47 Tuc.
The above evidence indicates that we still lack solid constraints on the age distribution of metal-rich GCs. In this
investigation we address the absolute age of M71 by adopting optical ground-based (SDSS) bands collected with MegaCam at the Canadian–France–Hawaii Telescope (CFHT). The layout of the paper is as follows. In Section2 we present the data set and the strategy adopted for data reduction. In Section 3 we discuss the approach we adopted to identify candidate cluster and field stars. The theoretical framework adopted to estimate the absolute age of M71 is presented in Sections4and5, while in Section6we discuss the absolute age estimates based on the classical main sequence(MS) turn-off and on the main sequence knee(MSK). Finally, in Section 7
we summarize the results and outline future perspectives.
2. OBSERVATIONS AND DATA REDUCTION To investigate the absolute age of M71 we used the images from the MegaCam(36 Charge Coupled Devices, CCD; total field of view (FOV): 1° × 1°; scale: 0″. 187/pixel) mounted on the CFHT. The data set includes 50 dithered images14 taken with the u g r i z¢ ¢ ¢ ¢ ¢ (SDSS) bands (Fukugita et al. 1996). We retrieved five shallow and five deep images per filter from the Canadian Astronomy Data Centre with the following exposure times(ETs):ET( )u¢ = 30, 500 s;ET( ,g r¢ ¢ = 5, 250 s;) ET( )i¢
= 5, 300 s; and ET( )z¢ = 15, 500 s. The mean seeing ranges
from ∼1.0 (u g z¢ ¢ ¢) up to ∼1.3 (i r, , ¢ ¢) arcsec. The data were, pre-processed with the ELIXIR programs (Magnier & Cuillandre 2004). The globular M71 covers a small sky area, and indeed its tidal radius is rt= 8 ′. 9 (Harris1996); therefore,
we only used the 20 innermost CCDs for a total FOV of 0◦. 6 × 1◦. 0. For each frame we provided accurate point-spread
function photometry using DAOPHOT IV and ALLSTAR (Stetson1987), and we used DAOMATCH/DAOMASTER to scale individual chips on a common geometrical reference system. Once we obtained the global catalog (master list of stars) of the entire data set we ran ALLFRAME (Stetson1994) simultaneously over the entire set of images. We obtained a list of 370,000 stars with at least one measurement in four different photometric bands. To calibrate the instrumental magnitudes, we used the local standard stars (∼6000) provided by Clem et al.(2007). To validate the adopted transformations, Figure1
shows the comparison in four different CMDs between the current photometry and the ridge lines (red solid lines) provided by Clem et al. (2008). They agree quite well not only along the red giant branch(RGB), but also along the MS. The anonymous referee noted that for r′-band magnitudes fainter than ∼22 mag (r g¢ ¢ - ¢ CMD; r, r ¢ ~ 20.5mag for the
r¢ ¢ - ¢ CMD) the ridge lines provided by Clem attain,u g
colors that are slightly bluer(redder for the r u¢ ¢ - ¢ CMD), g
than observed. The difference is mainly caused by the different approaches adopted to perform the photometry, in selecting candidate cluster stars, and in the calibration to standards. Our approach is based on simultaneous photometry on shallow and deep u g r¢ ¢ ¢ ¢ ¢ images. This allowed us to reach a better, , , ,i z
photometric precision in the faint magnitude limit. Stars plotted in Figure 1 have been selected according to the cluster radial distance (60 r 250arcsec), and to photometric quality parameters (sg¢- ¢r =0.07mag, c »1,∣sharp∣<1). Data plotted in this figure indicate that the lower MS is better defined and less affected by the field star contamination (see 13
We used the Cardelli et al.(1989) law to unredden the original value of
MV= 13.71 mag.
14
The current optical images were acquired during two nights: 2004 July 8 and 13; proposal IDs: 04AC03, 03AC16; P.I.: J. Clem; observing program: “CFHT Star Cluster Survey.”
Figure 12 in Clem et al. 2008). We adopted the same local standard stars provided by Clem et al. (2007) and followed a similar procedure (Clem et al. 2008) to transform the instrumental magnitudes into standard magnitudes. Unfortu-nately, we cannot perform a detailed comparison among the different calibration equations, since their zero points and coefficients of the color terms are not available.
The intrinsic errors in magnitude and in color are plotted as red error bars. They take account of the photometric error and of the absolute calibration and attain values of the order of a few hundredths of magnitude down to the lower MS. This trend is also supported by the photometric error in the r′-band plotted in the rightmost panel of the same figure. It is of the order of a few hundredths of a magnitude down to the bending of the MS (r¢ ~23mag).
Finally, we performed an astrometric solution of the catalog using the UCAC4 catalog. The rms error of the positions is
55
s ~ 10−3arcsec.
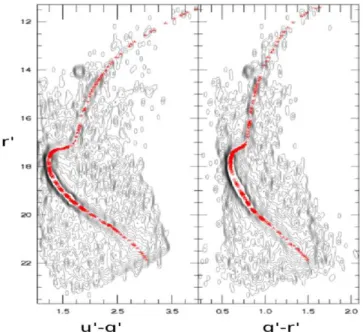
3. IDENTIFICATION OF FIELD AND CLUSTER STARS To separate candidate cluster and field stars we devised a new approach that fully exploits the multiband data set we are dealing with. We performed a preliminary radial selection and to avoid the crowded central regions we only selected stars located inside an annulus with r= 2′ and r = 5′centered on the cluster. On the basis of this sample we generated two isodensity maps in the r¢ ¢ - ¢ and in the r g,u g ¢ ¢ - ¢ CMDs (see, r
Figure 2). To properly constrain the cluster ridge line we
developed a numerical algorithm that pinpoints the peaks of the isocontour plots and provides a preliminary version of the cluster ridge line. Note that in the approach we devised, the overdensity caused by red HB stars was neglected. The preliminary ridge line is then fit with a bicubic spline and visually smoothed, in particular in the bright portion of the RGB. The analytical ridge lines are sampled at the same r′ magnitude levels(see Table1). The red lines plotted in the left and in the right panel of Figure2show the final version of the estimated ridge lines.
The two analytical ridge lines were used to generate a 3D plot color–color–magnitude diagram (CCMD)—r u¢ ¢ - ¢, g,
g¢ - ¢—of the cluster. Figurer 3shows the 3D ridge line(red solid line) together with the entire sample of stars with measurement in the the u g r¢ ¢ ¢ bands. We considered as, , candidate cluster stars those located within the 3D ridge line ±1σ, where σ is defined as two times the quadratic sum of the photometric errors in the three quoted bands.
The above approach has several indisputable advantages when compared with classical photometric methods in selecting field and cluster stars.
1. The selection in the CCMD takes advantage of the typical effective temperature correlation of stellar structures in a color–color plane. The current approach also takes advantage of the fact that we are simultaneously using photometric bands covering a broad range in central wavelengths and, in particular, the u′-band. This means a solid separation not only between stars and field galaxies, but also between field and cluster stars (Bono et al.
2010b). However, the color–color diagram approach is prone to degeneracy between dwarf field and giant cluster stars sharing very similar optical colors.
2. The selection in the CMD takes advantage of the typical correlation between cluster stars located at the same distance(apparent magnitude) and their color. However,
Figure 1. From left to right: four CMDs of M71 based on optical images collected with the MegaCam at CFHT. Data plotted in the different CMDs were selected using photometric quality parameters (c » , sharp1 ∣ ∣<1,
0.07
g r
s¢- ¢< ) and according to the radial distance 60″< <r 250″. The red lines display the fiducial lines provided by Clem et al. (2008), while the red bars plotted on the left side take account of the photometric error both in magnitude and in color. The sample of stars located at r′ ∼ 14.2, u¢ - ¢ ∼g
1.75 mag are cluster red HB stars. Data plotted in the rightmost panel display the photometric error in the r′-band.
Figure 2. Left: isodensity contours(black lines) of the entire data set in the r′,
u¢ - ¢ CMD. The ridge line of the candidate cluster stars is overplotted withg
the CMD approach is prone to spurious selection interlopers located at different distances, i.e., field stars associated either with the Galactic halo or to the Galactic disk stars. This means that after the selection of the stars located across the ridge line we need to take account of the fraction of field stars that have been erroneously classified as candidate cluster stars(see Di Cecco et al.2013). The approach based on the CCMD takes account of the advantages of both the color–color diagram and of the CMD selection criteria. To validate the approach we adopted, Figure4
shows the r¢ ¢ - ¢ CMD, before (left) and after (middle) the,g r
selection. The candidate field stars are plotted in the right panel. The magnitude and color distribution of the field stars supports the plausibility of the adopted selection criterion, since we recover the two typical peaks in g¢ - ¢ color at ∼0.6 andr
∼1.5 mag for field dwarf stars (Ivezic et al.2008). Data plotted in the middle panel display a smooth and well sampled CMD from the tip of the RGB down to the lower MS. Moreover, the presence of field stars in the same region of the CMD in which we would expect candidate cluster stars on the basis of the CMD further supports the approach we developed.
We highlight that the isodensity maps plotted in Figure 2
show a secondary peak at a magnitude slightly brighter (17
r¢
⩽ ⩽17.5 mag) and bluer (u¢ - ¢ ~g 1.2mag; g¢ - ¢ ~r 0.6 mag) than the ridge line of the candidate cluster stars. We performed several tests changing the ridge line either in the
Table 1
Ridgelines of M71 in the r¢ ¢ - ¢ and r g,u g ¢ ¢ - ¢ CMDs, r a
r′ sr¢ u¢ - ¢g su¢- ¢g g¢ - ¢r sg¢- ¢r
(mag) (mag) (mag) (mag) (mag) (mag)
11.49 0.01 3.94 0.04 1.58 0.12 11.69 0.01 3.70 0.04 1.47 0.04 11.89 0.01 3.48 0.07 1.38 0.09 12.09 0.01 3.30 0.06 1.32 0.10 12.21 0.01 3.21 0.06 1.28 0.06 12.33 0.01 3.13 0.04 1.25 0.04 12.50 0.01 3.02 0.03 1.21 0.03 12.66 0.01 2.92 0.08 1.18 0.05 12.82 0.01 2.83 0.06 1.15 0.04 13.02 0.01 2.72 0.03 1.11 0.03 13.22 0.01 2.62 0.04 1.08 0.03 13.46 0.01 2.52 0.03 1.05 0.04 13.70 0.01 2.42 0.03 1.01 0.03 13.94 0.01 2.32 0.03 0.98 0.02 14.18 0.01 2.24 0.02 0.96 0.02 14.42 0.01 2.16 0.02 0.93 0.02 14.67 0.01 2.09 0.02 0.91 0.02 14.91 0.01 2.03 0.02 0.89 0.02 15.15 0.01 1.98 0.02 0.87 0.02 15.39 0.01 1.94 0.02 0.86 0.02 15.63 0.01 1.89 0.02 0.84 0.02 15.91 0.01 1.85 0.02 0.83 0.02 16.05 0.01 1.83 0.02 0.82 0.02 16.19 0.01 1.81 0.02 0.82 0.02 16.33 0.01 1.80 0.01 0.81 0.02 16.51 0.01 1.78 0.01 0.81 0.01 16.63 0.01 1.76 0.01 0.80 0.01 16.71 0.01 1.75 0.01 0.80 0.01 16.77 0.01 1.74 0.01 0.80 0.01 16.83 0.01 1.74 0.01 0.80 0.01 16.87 0.01 1.73 0.01 0.79 0.01 16.91 0.01 1.72 0.01 0.79 0.01 16.95 0.01 1.72 0.01 0.79 0.01 16.99 0.01 1.71 0.01 0.78 0.01 17.03 0.01 1.70 0.01 0.78 0.01 17.07 0.01 1.69 0.01 0.77 0.01 17.11 0.01 1.68 0.01 0.76 0.01 17.15 0.01 1.66 0.01 0.75 0.01 17.17 0.01 1.64 0.01 0.74 0.01 17.19 0.01 1.61 0.01 0.73 0.01 17.21 0.01 1.58 0.01 0.72 0.01 17.23 0.01 1.53 0.01 0.71 0.01 17.25 0.01 1.48 0.01 0.70 0.01 17.27 0.01 1.44 0.01 0.69 0.01 17.29 0.01 1.41 0.01 0.68 0.01 17.31 0.01 1.38 0.01 0.67 0.01 17.33 0.01 1.35 0.01 0.65 0.01 17.35 0.01 1.33 0.01 0.65 0.01 17.37 0.01 1.32 0.01 0.64 0.01 17.39 0.01 1.31 0.01 0.63 0.01 17.43 0.01 1.29 0.01 0.62 0.01 17.47 0.01 1.27 0.01 0.62 0.01 17.51 0.01 1.26 0.01 0.61 0.01 17.55 0.01 1.25 0.01 0.61 0.01 17.57 0.01 1.24 0.01 0.60 0.01 17.59 0.01 1.24 0.01 0.60 0.01 17.61 0.01 1.24 0.01 0.60 0.01 17.63 0.01 1.24 0.01 0.60 0.01 17.65 0.01 1.23 0.01 0.60 0.01 17.67 0.01 1.23 0.01 0.60 0.01 17.71 0.01 1.23 0.01 0.60 0.01 17.75 0.01 1.23 0.01 0.60 0.01 17.79 0.01 1.23 0.01 0.60 0.01 Table 1 (Continued) r′ sr¢ u¢ - ¢g su¢- ¢g g¢ - ¢r sg¢- ¢r
(mag) (mag) (mag) (mag) (mag) (mag)
17.83 0.01 1.23 0.01 0.60 0.01 17.89 0.01 1.23 0.01 0.60 0.01 17.95 0.01 1.24 0.01 0.60 0.01 18.07 0.01 1.25 0.01 0.60 0.01 18.23 0.01 1.27 0.01 0.61 0.01 18.39 0.01 1.30 0.01 0.62 0.01 18.55 0.01 1.33 0.01 0.64 0.01 18.71 0.01 1.38 0.01 0.66 0.01 18.87 0.01 1.43 0.01 0.68 0.01 19.03 0.01 1.49 0.01 0.71 0.01 19.23 0.01 1.57 0.01 0.74 0.01 19.44 0.01 1.67 0.01 0.78 0.01 19.64 0.01 1.78 0.01 0.83 0.01 19.84 0.01 1.90 0.01 0.88 0.01 20.04 0.01 2.03 0.01 0.93 0.01 20.20 0.01 2.14 0.01 0.97 0.01 20.40 0.01 2.29 0.01 1.04 0.01 20.60 0.01 2.43 0.01 1.11 0.01 20.88 0.01 2.59 0.01 1.20 0.01 21.12 0.01 2.73 0.01 1.28 0.01 21.36 0.01 2.87 0.01 1.35 0.01 21.56 0.02 2.97 0.01 1.41 0.01 21.76 0.02 3.07 0.02 1.46 0.02 21.84 0.02 3.11 0.02 1.48 0.02 Note. a
The sampling in magnitude and in color along the r′, u¢ - ¢ and r′, gg ¢ - ¢r
ridge lines is not uniform. The sampling increases in the regions in which there are relevant changes in the slope (main sequence turn-off, base of the red giant). σ marks the uncertainty either in magnitude or in color (summed in quadrature).
r¢ ¢ - ¢ or in the r g,u g ¢ ¢ - ¢ density map and checking the, r
impact on the CCMD. We found that this blue plume mainly includes candidate field stars. This finding is supported by the smooth distribution of the cluster MSTO stars in Figure1and by the presence of the blue plume stars in the CMD of the candidate field stars plotted in the left panel of Figure 4. We thank the anonymous referee for drawing our attention on this group of stars.
4. THEORETICAL FRAMEWORK AND CLUSTER ISOCHRONES
To estimate the cluster age, we used the evolutionary tracks and the cluster isochrones of the Pisa Stellar Evolution Data Base15 for low-mass stars, computed using the FRANEC stellar evolutionary code (Degl’Innocenti et al. 2008; Tognelli et al. 2011). The input physics and the physical assumptions adopted to construct the evolu-tionary tracks have already been discussed in Dell’Omo-darme et al.(2012), while an analysis of the main theoretical uncertainties affecting stellar tracks and isochrones is provided in Valle et al.(2013a,2013b). Among the available grids of models, we take account of those computed with an α-enhanced chemical mixture ([α/Fe] = +0.3) and the recent solar heavy-element mixture by Asplund et al.(2009, As09). Recent spectroscopic estimates give for M71 an iron abundance of [Fe/H] = −0.82 ± 0.02 dex (Carretta et al.
2009, Ca09). This abundance is based on a reference solar iron abundance oflog(FeI)= 7.54. To transform it into the Asplund et al. (2009) solar iron abundance (log(Fe) = 7.50), we used the following relationship:
[Fe H] [Fe H] log (Fe) log (Fe) [Fe H] 0.04.
(1)
As09 Ca09 Ca09 As09
Ca09
= +
-= +
This means an iron abundance for M71 of[Fe/H] = −0.78 dex, and by assuming an α-enhancement of [α/Fe] = +0.3 dex, a global metal abundance per unit mass of Z= 0.0037, and a
primordial helium abundance of Y= 0.256. The closest metallicities for α-enhanced isochrones currently available in the Data Base are: Z= 0.002, Y = 0.252; Z = 0.003, Y = 0.254; and Z= 0.004, Y = 0.256. The helium abundances as a function of the metal abundances were estimated using a linear helium-to-metal enrichment ratio ofD D = 2 (Fukugita &Y Z
Kawasaki2006). The above chemical compositions imply iron abundances of [Fe/H] = −1.04, [Fe/H] = −0.87, and [Fe/ H] = −0.74 dex, respectively. The adopted sets of evolutionary models bracket, within the errors, the observed iron abundance of M71.
The two adopted grids of evolutionary models cover a typical range in mass of low-mass stars, namely
M = 0.30–1.10 M. Moreover, they were constructed by adopting three different values of the mixing length parameter: ml= 1.7, 1.8, and 1.9. The corresponding cluster isochrones cover the age range from 8 to 15 Gyr. The luminosities and the effective temperatures provided by the evolutionary models were transformed into magnitudes and color indexes using the synthetic spectra by Brott & Hauschildt (2005) for 2000 K
Teff 10,000
⩽ ⩽ K and by Castelli & Kurucz (2003) for
T
10,000 K eff50,000K. The transformations into the observational plane follow the prescriptions discussed in Girardi et al.(2002).
To compute the AB magnitudes in the u g r i z¢ ¢ ¢ ¢ ¢ photometric system we used the USNO40 Response Functions16with an air mass of 1.6. This is the air mass value at which the observations of the local standard stars in M71 provided by Clem et al.(2007) were performed.
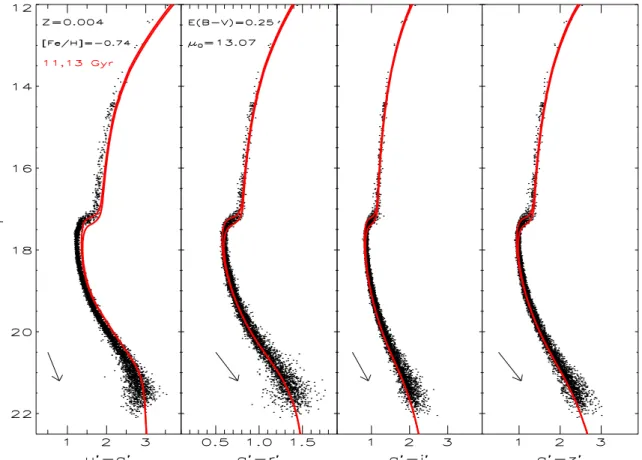
Figure 5 shows the comparison between candidate cluster stars and the set of isochrones constructed assuming Z= 0.003,
Y= 0.254, and ml = 1.9. The cluster isochrones were plotted by adopting a true distance modulus of μ= 13.07 mag and a
Figure 4. Left: r′, g¢ - ¢ CMD of the entire photometric catalog. Stars plottedr
in this CMD were selected by photometric error(sg<0.05,sr<0.05) and cluster radial distance (10″< < 450″). Middle: same as the left, but forr
candidate cluster stars. The blue dots display cluster red HB stars. Right: same as the left, but for candidate field stars.
Figure 3. r′, u¢ - ¢, gg ¢ - ¢ CCMD of M71. The blue dots are the candidater
cluster stars selected along the 3D ridge line (red line). The red dots are candidate field stars.
15
http://astro.df.unipi.it/stellar-models/
16
They are available athttp://www-star.fnal.gov/ugriz/Filters/response.html; for more details see Smith et al.(2002).
cluster reddening of E B V( - )= 0.25 mag. The adopted values agree quite well with similar estimates available in the literature (see Table2). The selective absorptions in the individual bands were estimated by assuming a ratio of absolute to selective extinction of RV= 3.1 and the empirical reddening law by
Cardelli et al.(1989). The extinction ratios were computed by adopting the effective wavelengths of the u g r i z¢ ¢ ¢ ¢ ¢ photometric system provided by Smith et al. (2002). For the five adopted bands we found the following selective absorption ratios:
Au¢ AV= 1.58, Ag¢ AV= 1.20, A Ar¢ V= 0.87, A Ai¢ V= 0.66,
and Az¢ AV= 0.49 (see also Di Cecco et al. 2010). The black
arrows plotted in the bottom left corners display the reddening vectors in the four different CMDs. The two red lines display the cluster isochrones for 11 and 13 Gyr. Theory and observations agree quite well not only along the evolved sequences (RGB; subgiant branch, SGB), but also along the MS. There is mild evidence that cluster isochrones in the lower MS(r¢ ⩽20.5mag) become slightly bluer than observed stars in r′, g¢ - ¢ (panel (b)), r′, gr ¢ - ¢ (panel (c)), and in r′,i g¢ - ¢ (panel (d)), but the agreement across the turn-offz
regions is quite good in the four different CMDs. Similar discrepancies between observed and predicted colors have also been found in the optical and NIR bands (Kucinskas et al. 2005). The only exception is the r′, u′-g′ CMD (panel (a)), in which the observed stars in the MSTO region (r¢ ~17.8mag) are a few hundreds of magnitudes bluer than predicted. A similar discrepancy was also found by An et al. (2009) using α-enhanced cluster isochrones computed with
YREC code(Sills et al.2000; Delahaye & Pinsonneault2006) and transformed into the observational plane by adopting MARCS stellar atmosphere models (Gustafsson et al. 2008).
Figure 5. From left to right: comparison between theory and observations in different CMDs of M71. Black dots display candidate cluster stars selected using photometric error and cluster radial distance. The red lines display two α-enhanced cluster isochrones at fixed metal content (Z = 0.003, Y = 0.254) and ages of 11 and 13 Gyr, respectively. The true distance modulus and the cluster reddening adopted to overplot evolutionary prescriptions are also labeled. The reddening in the different bands was estimated using the semi-empirical Cardelli relation. The black arrows show the reddening vectors in the different CMDs for an arbitrary change in cluster reddening.
Table 2
Absolute Ages, Distance Moduli, Reddening Estimates, and Iron Abundances for M71
DMVa E B V( - )b Agec [Fe/H]d Note
(mag) (mag) (Gyr)
13.70 0.28 14± 2; 16 ± 2 −0.78 H92 14.09± 0.15 0.28 8± 1 −0.70 R92 13.60± 0.10 0.27± 0.05 18 −1.02 G00 13.71± 0.04 ± 0.1 0.28 12 −0.70 G02 13.78 0.20 11 −0.80 B10 13.69 0.24 11.00± 0.38 −0.82 V13 13.84 0.25 12± 2 −0.78 MSTO K K 12± 1 −0.78 DKneeTO
Note.H92, Hodder et al.(1992),R92, Reid(1998),G00, Geffert & Maintz (2000), G02, Grundahl et al. (2002), B10, Brasseur et al. (2010), V13, Vandenberg et al.(2013). MSTO: age estimate based on the main sequence turn-off;DKneeTO : age estimate based on the difference in magnitude between the
MSTO and knee.
a
Apparent distance modulus and its error when estimated by the quoted authors.
bAdopted cluster reddening. cAbsolute cluster age. d
They suggested that the main culprit could be missing opacities in the model atmospheres at short wavelengths, as well as the color transformation for the highly reddened cluster M71. Current findings support the discrepancy, but the comparison also shows good agreement along the MS(r¢ ⩽20mag), thus suggesting that the mismatch between theory and observations might also be due to marginal changes in the adopted chemical composition.
To further constrain the above working hypothesis, we performed the same comparison, but by adopting a slightly more metal-rich chemical composition(Z = 0.004, Y = 0.256). Data plotted in Figure 6 clearly show that the discrepancy between theory and observations increases. This applies not only to the MSTO region where the difference is of the order of 0.3 mag, but also along the RGB/SGB and the MS, and indeed the isochrones attain colors that are systematically bluer than observed. Moreover, it is worth mentioning that the increase of 0.13 dex in iron abundance also causes a clear discrepancy along the SGB region in the other CMDs(panels (b)–(d)) and does not improve the agreement in the lower MS.
Current evidence further supports the strong sensitivity of the u′ band to the metal content and suggests that the mild discrepancy found in the color of the TO region of the r′,
u¢ - ¢ CMD might also be affected by the adopted abundanceg
of α-elements and/or of CNO elements.
5. CONSTRAINING THE NATURE OF THE KNEE IN THE LOWER MS
The occurrence of a well-defined knee in the low-mass regime of the MS has already been brought forward in the
literature. It has already been detected in several old (ω Cen, Pulone et al.1998; M4, Pulone et al.1999; Milone et al.2014, NGC 3201 Bono et al. 2010a; 47 Tuc, Lagioia et al. 2014; NGC 2808, Milone et al. 2012a) and intermediate-age (Sarajedini et al. 2009) stellar systems and in the Galactic bulge (Zoccali et al. 2000) using NIR CMDs. Current evolutionary prescriptions indicate that this feature is mainly caused by the collisionally induced absorption of H2 at NIR
wavelengths(Saumon et al. 1994). The shape of the bending marginally depends on the metal content, but the magnitude of the knee is essentially independent of cluster age and of metallicity.
The above theoretical and empirical evidence suggests that the magnitude difference between the MSK and the MSTO, i.e., DTOKnee, is a robust diagnostic to constrain the absolute
cluster age. The key advantages of the new approach are that the above difference in magnitude is independent of uncertain-ties affecting both the distance and the reddening of the stellar system. Recent empirical evidence indicates that this new approach provides cluster ages that are a factor of two more precise when compared with the classical method of the MSTO (Sarajedini et al.2009; Bono et al.2010a).
In passing, we also note that theDTOKneemethod appears more robust than the traditional horizontal (difference in color between the RGB, typically 2.5 mag brighter than the MSTO, and the MSTO) and vertical (difference in magnitude between the HB luminosity level, typically at the RR Lyrae instability strip, and the MSTO) methods (Buonanno et al.1998; Stetson et al. 1999; Marin-Franch et al. 2009; V13). According to theory, MS stellar structures with a stellar mass of M~ 0.5–0.4
Mare minimally affected by uncertainties in the treatment of Figure 6. Same as Figure5, but the comparison is with two more metal-rich(Z = 0.004, Y = 0.256) α-enhanced cluster isochrones.
convection, since the convective motions are nearly adiabatic (Saumon & Marley2008). The same outcome does not apply to cool HB stars and SGB stars adopted in the vertical and horizontal methods, respectively. Moreover, the MSK can be easily identified in all stellar systems with a well-populated MS. It is independent of the uncertainties affecting the estimate of the HB luminosity level when moving from metal-poor (blue and extreme HB morphology) to metal-rich (red HB morphology) GCs (Calamida et al.2007; Iannicola et al.2009;
V13). Morover, theDKneeTO method is also independent of the
theoretical uncertainties plaguing the color–temperature trans-formations required in the horizontal method to constrain the cluster age.
In this context it is worth mentioning that both the vertical and the horizontal method are robust diagnostics of optical CMDs. Recent accurate and deep NIR CMDs show that HB stars display a well-defined slope when moving from hot and extreme HB stars to cool red HB stars(Del Principe et al.2006; Coppola et al. 2011; Milone et al.2013; Stetson et al. 2014). The same outcome applies to the CMDs based on near-UV and far-UV bands (Ferraro et al. 2012). This means that the identification of the HB luminosity level required by the vertical method is hampered by the exact location in color of the anchor along the HB. Moreover, the difference in color between the MSTO and an anchor along the RGB, required by the horizontal method, is hampered by the fact that the RGB becomes almost vertical in NIR bands. This means that the difference in color is steadily decreasing(Coppola et al.2011; Stetson et al.2014).
Finally, the minimal dependence on the metal content allow us to tightly correlate theDTOKneedirectly to the absolute age of
the stellar system. This means that the new approach provides absolute age estimates, while the horizontal and the vertical methods do provide estimates of the relative age.
5.1. The Impact of Collision-induced Absorption (CIA) on the
Knee of the Lower MS
To further constrain, on an empirical basis, the robustness of the DTOKnee to estimate the absolute age of GCs, we also
investigated the bending in the optical bands (Bono et al.
2010a) and in particular in the u′ and g′ bands. The reason is twofold.(1) Detailed atmosphere models taking account of the CIA opacities of both H2–H2 and H2–He indicate that CIA
induces a strong continuum depression in the NIR region of the spectrum (Borysow et al. 1997, 2000; Borysow 2002). The same outcome applies to the UV region of the spectrum for surface gravities and effective temperatures typical of cool MS stars (see Figures 5 and 6 in Borysow et al. 1997). It is interesting to note that the above effect is also anticorrelated with the iron abundance. The increase in the iron abundance causes, at low effective temperatures, an increase in the molecular opacities (see Figure 7 in Borysow et al. 1997), leading to a weaker impact of the CIA on the continuum. (2) Interestingly enough, a recent deep and accurate optical–UV CMD already showed the presence of a well-defined knee in the low-mass regime of the MS. An et al. (2008) clearly identified a well-defined knee in the lower MS of two old open clusters: NGC 2420 and M67 (see their Figure 16). Similar evidence was also found in the V, B−I CMD of M4 (Stetson et al.2014). The lack of clear evidence of a knee in the lower MS can be associated with either the use of V, R, and I bands in
which the knee is less evident or to the fact that the photometry is not deep/accurate enough to properly identify the knee.
To properly constrain the impact that CIA has on the UV flux, and in particular on the blue magnitude and colors, we performed a specific test. We adopted an old (12 Gyr) cluster isochrone and selected three stellar structures with stellar masses ranging from 0.30 to 0.45 M. The surface gravities and the effective temperature of the selected models are listed in Table3. Using these values as input parameters, we computed two specific sets of atmospheric models (spectra), one that neglects and one that takes account of the CIA opacities.
Data plotted in Figure 7 show that CIA has a substantial impact on the emerging flux of high-gravity, low effective temperature stellar structure.
In the color–magnitude region common to the two sets, the models that take account of CIA(see the red line in Figure7) are, at a fixed stellar mass, ∼0.1 mag fainter than those without CIA opacity, with the differences increasing as the effective temperature decreases. Note also that, at a fixed luminosity, the inclusion of CIA produces models ∼0.05 mag bluer than the models without CIA. The difference becomes more evident in the very low-mass regime and at longer wavelengths.
In this context it is worth mentioning that the above atmosphere models either taking account of or neglecting the CIA opacity rely on the input physics adopted in the latest version of the PHOENIX BT-Settl atmosphere structures (Allard et al. 2011). These models, when compared with previous atmosphere models computed by Brott & Hauschildt (2005), present two differences: (a) the former use the solar mixture provided by Asplund et al.(2009), while the latter use the solar mixture provided by Grevesse et al.(1993); (b) the former models include a more complete list of CIA opacities. In particular, they take account of molecular hydrogen (H2),
molecular nitrogen(N2), methane, and carbon dioxide (CO2).
The main difference with previous models is in the use of opacities provided by Abel et al. (2011) that provide less absorption at high temperatures when compared with earlier computations by Fu et al. (1996). A more detailed list of the adopted CIA opacities used in the current BT-Settl atmosphere models is given in Table4together with their references.
Note that the current isochrones have been transformed into the observational plane using the homogeneous set of atmo-sphere models provided by Brott & Hauschildt (2005, see Section 4 for more details). To constrain the difference between the magnitudes and colors based on the Brott & Hauschildt (2005) and Allard et al. (2011) sets of atmosphere models, we performed a test. We transformed the best-fit cluster isochrone (12 Gyr) and chemical composition ([Fe/H] = −0.87 dex, [α/ Fe] = +0.3) also using the recent Allard et al. (2011) spectra.17 To overcome problems in the adopted solar mixtures, the two sets of atmosphere models were interpolated at fixed metallicity([Fe/H] = −0.87 dex). We found that the difference in the r′ magnitude is negligible, and indeed, it is of the order of 1% at MSTO and becomes at most of the order of a few hundredths of magnitude in the region across the MSK. We performed the same experiment, but the atmosphere models were interpolated at fixed global metallicity Z. The difference between the two sets of atmosphere models was, once again, minimal, thus suggesting that new atmosphere models have a minimal impact on the conclusions of the current investigation. 17
Allard et al.(2011) spectra are available athttp://phoenix.ens-lyon.fr/Grids/ BT-Settl/.
A more detailed investigation of the impact that CIA and molecular line opacities have on UV, optical, and NIR colors over a broad range of metal abundances will be addressed in a forthcoming paper.
their Figures 5 and 8).
Therefore, we decided to take advantage of this evidence and to estimate the absolute age of M71 using both the classical MSTO method and the newDTOKnee method. The latter method appears very promising since the vertical method might be more prone to possible systematic uncertainties in the metal-rich regime. The HB morphology of metal-metal-rich GCs is typically characterized by a well-defined group of red stars. These stars in several optical and optical–NIR CMDs appear tilted (Raimondo et al. 2002; Milone et al. 2012b; Lagioia et al. 2014, V13). Moreover, metal-rich GCs—like M71— harbor either no RR Lyrae or at most a few (only one in 47 Tuc). If present they are quite often either evolved (Bono et al.2003) or peculiar (Pritzl et al.2000). The vertical method is typically anchored to the mean magnitude of the RR Lyrae cluster. Therefore, the application to metal-rich clusters is— once again—difficult, since a theoretical/empirical correction is required. The homogeneity of the diagnostic adopted to estimate the absolute age is a crucial issue in this context, since we are interested in constraining possible differences in age between metal-poor and metal-rich GCs.
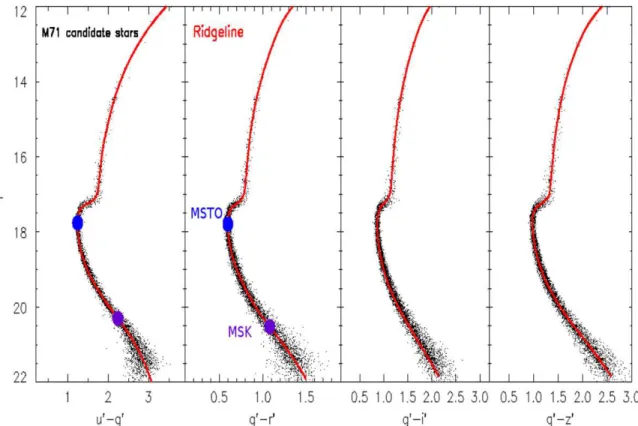
The approach adopted to estimate the observed magnitudes of both MSTO and MSK has already been discussed in detail by Bono et al.(2010a) in their investigation of NGC 3201. In the following, we briefly outline the main steps of the quoted approach. The observed ridge line of the r¢ ¢ - ¢ CMD was,g r
equally sampled(D =r¢ 0.01 mag) using a cubic spline, and then the MSTO and the MSK magnitudes were estimated to be the points showing the minimum curvature along the MS ridge line. We found that the MSTO is located at r¢ =17.790.01 mag and the MSK at r¢ =20.660.01mag. Note that the uncertainties account for the photometric errors and for errors in the ridge line and the location of the above points (see Figure8).
To estimate the absolute age of M71 with the classical MSTO method we adopted the more metal-poor (Z = 0.003,
Y= 0.254) set of isochrones, since they account for the observed stars in the different CMDs. Note that the marginal difference in color between observations and theory—in the r′,
u¢ - ¢ CMD—has a minimal impact on the absolute ageg
estimate, since we are only using the magnitude of the MSTO. Data plotted in our Figure5indicate an absolute age for M71 of the order of 12 Gyr. To properly estimate the age and the errors affecting the ages based on the MSTO, we followed the approach suggested by Renzini & Fusi Pecci (1988; see also Buonanno et al. 1998). We selected the r′-band absolute
Figure 7. Comparison between cluster isochrones(12 Gyr) transformed into the observational plane adopting stellar atmosphere models either including (red line) or neglecting (black line) CIA opacity.
Table 4
Collisional Induced Absorption Opacities Included in the Phoenix BT-Settl Atmosphere Models(Allard et al.2011)
CIA References H2–H2 1, 2 H2-He 3, 4 H2-H 5 He−H 6 H2-CH4 7, 8 H2–N2 9, 10 N2–CH4 11, 12 N2-N2 13, 14 CH4–CH4 15 CO2–CO2 16, 17 H2-Ar 18, 19 CH4-Ar 20, 21
References.(1) Borysow (2002), (2) Abel et al. (2011), (3) Borysow et al. (1989), (4) Borysow et al. (1997), (5) Gustafsson & Frommhold (2003), (6) Gustafsson & Frommhold(2001), (7) Borysow & Frommhold (1986b), (8) Borysow et al.(1986), (9) Borysow & Frommhold (1986a), (10) Dore et al. (1986), (11) Borysow & Tang (1993), (12) Birnbaum et al. (1993), (13) Borysow & Frommhold(1986c), (14) Borysow & Frommhold (1987a), (15) Borysow & Frommhold (1987b), (16) Gruszka & Borysow (1997), (17) Gruszka & Borysow(1998), (18) Meyer & Frommhold (1986), (19) Borysow & Moraldi (1994), (20) Dore & Filabozzi (1990), (21) Borysow & Moraldi(1993).
magnitude of the MSTO based on cluster isochrones for ages ranging from 8 to 14 Gyr. These estimates were performed on three sets of r′, g¢ - ¢ isochrones computed assumingr
different chemical compositions, namely: Z= 0.002, Y = 0.252; Z= 0.003, Y = 0.254; and Z = 0.004, Y = 0.256. Note that we adopted this CMD because these are the bands in which both theory and observations are more precise. On the basis of the quoted estimates we performed a linear regression among age, metallicity, and r′-band absolute magnitude of the MSTO. We found the following relation:
t M log [Gyr] ( 1.06 0.06) (0.51 0.01) (0.09 0.01) [Fe H] (2) rTO = - + ´ - ´ ¢
where t is the absolute age in Gyr and the other symbols have their usual meaning. Using the above relation we estimated an absolute age for M71 of 12m2 Gyr (see the top panel of Figure9). The error budget of this determination takes account of photometric errors in the magnitude of the MSTO (s ~r¢
0.01–0.02 mag), in the cluster reddening (sE B V( - )~
0.05 mag), in the true distance modulus (s ~m 0.15 mag), and
in the chemical composition (s[M H] ~0.1dex). The current estimate is, within the errors, in good agreement with the absolute ages for M71 available in the literature(see Table2). The agreement is quite good with recent estimates based both on ground-based (Grundahl et al.2002; Brasseur et al.2010) and on space (V13) photometry together with up-to-date cluster isochrones(VandenBerg et al.2012).
To estimate the absolute age with the method ofDTOKnee, we adopted the same sets of cluster isochrones (Z = 0.003) we used for the MSTO method. However, the cluster isochrones
with ages ranging from 8 to 14 Gyr were equally sampled using a cubic spline. The same algorithm adopted to estimate the observed MSTO and the MSK on the ridge lines was also adopted on the splined isochrones. The observed and predicted differences in magnitude (DKneeTO ) between the MSK and the
MSTO(r r¢ ¢ - ¢) are plotted in the bottom panel of Figure, g 9. The predicted DTOKnee at a fixed metal content plotted in this Figure 8. From left to right: optical CMDs of candidate cluster stars. Stars plotted in the different CMDs were selected according to photometric error and cluster radial distance. The red lines display the ridge lines, while the two large blue filled circles plotted in the r g¢ ¢ - ¢ CMD mark the position of both the MSTO and, r
the MSK.
Figure 9. Top: predicted absolute magnitude of the MSTO as a function of cluster age. The MSTO was selected in r′, g¢ - ¢ isochrones constructed byr
adopting three different α-enhanced chemical compositions(see the labeled values). The observed unreddened MSTO value is 4.07 mag and it is shown (by the vertical bar) considering the uncertainties of the photometry and of the distance modulus and reddening. The horizontal bar shows the estimated uncertainty on the age. Bottom: same as the top, but for theDTOKneeparameter
(2.87 mag). The vertical bar only takes account of the photometric error. The horizontal bar shows the estimated uncertainty on the age.
TO
independent of uncertainties affecting both the distance modulus and the cluster reddening. Moreover, the difference in magnitude—DTOKnee—is also minimally affected by
uncer-tainties in the absolute photometric zero points. This means that this approach can also provide very accurate estimates of the relative ages of stellar systems.
In this context, it is worth mentioning that the coefficient of the age indicator attains, as expected, very similar values between MSTO andDTOKnee. This is a consequence of the fact
that the above diagnostics rely on the same age indicator: the MSTO. On the other hand, the dependence on the iron abundance is larger forDTOKnee than for the MSTO(0.3 versus
0.1 dex). The difference is independent of the adopted magnitude (r′) and color (g¢ - ¢). We performed severalr
tests using the same cluster isochrones and we found that the metallicity dependence is strongly correlated to the definition of the MSK(maximum versus minimum curvature). Moreover, we also found that the metallicity dependence of the age diagnostic (DTOKnee) becomes similar to the MSTO using the
difference in color instead of the difference in magnitude. The above evidence suggests that the precision of the different age diagnostics is a complex balance among photometric and spectroscopic precision age sensitivity together with uncertain-ties affecting distance moduli and reddening corrections. We plan to provide a detailed mapping of the sensitivity of optical, optical–NIR, and NIR CMDs in a forthcoming investigation.
7. SUMMARY AND FINAL REMARKS
We performed accurate and deep multiband (u g r i z¢ ¢ ¢ ¢ ¢) photometry of the metal-rich Galactic, , , , globular M71 (NGC 6838). The images were collected with MegaCam at CFHT and cover one square degree around the center of the cluster. The image quality and the strategy adopted to perform the photometry on both shallow and deep exposures allowed us to provide precise photometry in all the bands from the tip of the RGB to five magnitudes fainter than the MSTO. The extended data set of local standards provided by Clem et al. (2007) allowed us to fix the absolute zero point of the above bands with a precision that is, on average, better than 0.02 mag.
The selected cluster is projected onto the Galactic bulge. This means that absolute age estimates are hampered by the contamination of field bulge stars. To overcome this thorny problem, we devised a new approach based on the(r′, u¢ - ¢,g g¢ - ¢) CCMD. First we derived accurate ridge lines ofr
crucial role in the comparison between theory and observations.
We also investigated the impact that the CIA opacity has in the occurrence of the MSK in the Sloan bands. We found that CIA affects not only NIR magnitudes, but also blue bands such as the u′ and g′ bands. The sensitivity of the short wavelength regime on the CIA opacity was predicted by Borysow et al. (1997) and is now soundly confirmed by both theory and observations.
The comparison between theory and observation is quite good over the entire magnitude range covered by observations in the different CMDs. There is evidence of a mild difference— a few hundredths of magnitude—between cluster isochrones and observations. However, it is not clear whether the difference is due either to the adopted atmosphere models or to the adopted reddening law.
We estimated the absolute age of M71 using two different diagnostics. Using the MSTO and the cluster isochrones in the
r¢ ¢ - ¢ CMD, we found an age of 12 ± 2 Gyr. The error,g r
takes account of uncertainties in cluster distance, reddening, and iron abundances together with photometric uncertainties. We performed the same estimate using the knee method(Bono et al. 2010a), i.e., the difference in magnitude between the MSTO and the MSK, in the same CMD. We found a cluster age that is identical to the age based on the MSTO, but the uncertainty is a factor of two smaller. The difference is mainly due to the fact that the adopted diagnostic—DTOKnee—is
independent of uncertainties in cluster distance and reddening. However, it is more prone to uncertainties affecting cluster iron abundance.
The above age estimates support, within the errors, recent age estimates of metal-rich Galactic globular clusters. One of the most metal-rich Galactic globular cluster—NGC 6528— was investigated by Lagioia et al.(2014) using deep ACS and WFC3 images. Using the MSTO and a similar set of cluster isochrones they found an absolute age of 11 ± 1 Gyr. The absolute age of this cluster was independently confirmed by Calamida et al. (2014) using, for the same cluster, accurate ground-based Stroëmegren and NIR photometry (t = 11 ± 1 Gyr). The outcome applies to the age estimates of metal-rich bulge clusters provided by Zoccali et al. (2003,
2004), by Dotter et al. (2011), and by Bellini et al. (2013). The scenario emerging from the above empirical evidence is that metal-rich Galactic globular clusters appear to be, within the errors, coeval with metal-poor globulars (Di Cecco et al.
clusters do not show a clear evidence of an age–metallicity relation. This is a preliminary conclusion, since we still lack homogeneous age estimates of a sizeable sample of metal-rich clusters with a precision better than 1 Gyr. The fact that a significant fraction of metal-rich clusters are located inside or projected onto the Bulge calls for new precise and deep NIR photometry. Together with the obvious bonus concerning the reduced impact of uncertainties in the cluster reddenings and the possible occurrence of differential reddening, there is also the advantage of fully exploiting the precision of the new diagnostic(DTOKnee).
Finally, we would like to stress that the above findings also appear very promising concerning the solid evidence of a dichotomic age distribution of Galactic globular clusters. This evidence was brought forward by Salaris & Weiss(2002) and was subsequently soundly confirmed by Marin-Franch et al. (2009) and, more recently, by Vandenberg et al. (2013) and Leaman et al.(2013). The use of theDTOKneeparameter appears
even more promising in this context. The reason is twofold.(a) Empirical evidence indicates that the morphology of the MSK is well-defined when moving from the metal-rich (NGC 6528, Sarajedini et al.2007, E. P. Lagioia et al. 2015, in preparation), to the metal-intermediate(Bono et al.2010a), to the metal-poor regime(M15, Monelli et al.2015). (b) Relative ages based on
TO Knee
D are less prone to systematics, since the MSK is independent of cluster age and mildly affected by changes in helium content. The vertical method that is based on the difference between the HB luminosity level and the MSTO is more prone to the quoted possible systematics. Indeed, the HB luminosity level is affected by both cluster age and helium content.
The suggested experiment appears to be supported, with the unique opportunity in the near future to use adaptive optics systems at the 8 m class telescope with superb image quality and spatial resolution (Fiorentino et al. 2014; Schreiber et al.2014).
This investigation was partially supported by PRIN-MIUR (2010LY5N2T) “Chemical and dynamical evolution of the Milky Way and Local Group galaxies” (P.I.: F. Matteucci). It is a pleasure to acknowledge the anonymous referee for very pertinent suggestions on the early version of our paper. A.D.C. thanks the ASI Science Data Center, and in particular Dr. Lucio Angelo Antonelli, for supporting this investigation; G.B. thanks the Carnegie Observatory visitor program for support as a science visitor. This research used the facilities of the Canadian Astronomy Data Centre operated by the National Research Council of Canada with the support of the Canadian Space Agency. This publication makes use of data products from the Two Micron All Sky Survey, which is a joint project of the University of Massachusetts and the Infrared Processing and Analysis Center/California Institute of Technology, funded by the National Aeronautics and Space Administration and the National Science Foundation.
REFERENCES
Abel, M., Frommhold, L., Li, X., & Hunt, K. L. C. 2011, JChPh,134, 6101 Abel, M., Frommhold, L., Li, X., & Hunt, K. L. C. 2012,JChPh,136, 044319 Allard, F., Homeier, D., & Freytag, B. 2011, ASPC,448, 91
An, D., Johnson, J. A., Clem, J. L., et al. 2008,ApJS,179, 326 An, D., Pinsonneault, M. H., Masseron, T., et al. 2009,ApJ,700, 523 Anderson, J., Sarajedini, A., Bedin, & Luigi, R. 2008,AJ,135, 2055 Asplund, M., Grevesse, N., Sauval, A. J., & Scott, P. 2009,ARA&A,47, 481
Bellini, A., Piotto, G., Milone, A. P., et al. 2013,ApJ,765, 32 Bergbush, P. A., & VandenBerg, D. A. 1992,ApJS,81, 163 Birnbaum, G., Borysow, A., & Buechele, A. 1993, JChPh,99, 3234 Boesgaard, A. M., King, J. R., Cody, A. M., et al. 2005,ApJ,629, 83 Bonatto, C., Campos, F., & Oliveira, K. S. 2013, MNRAS, in press
(arXiv:1307.3935)
Bono, G., Caputo, F., Castellani, V., et al. 2003,MNRAS,344, 1097 Bono, G., Stetson, P. B., & VandenBerg, D. A. 2010a,ApJL,708, L74 Bono, G., Stetson, P. B., & Walker, A. R. 2010b,PASP,122, 651 Borysow, A. 2002,A&A,390, 779
Borysow, A., Borysow, J., & Fu, Y. 2000,Icar,145, 601 Borysow, A., & Frommhold, L. 1986a,ApJ,303, 495 Borysow, A., & Frommhold, L. 1986b,ApJ,304, 849 Borysow, A., & Frommhold, L. 1986c,ApJ,311, 1043 Borysow, A., & Frommhold, L. 1987a,ApJ,320, 437 Borysow, A., & Frommhold, L. 1987b,ApJ,318, 940
Borysow, A., Frommhold, L., & Dore, P. 1986, JChPh,85, 4750 Borysow, A., Frommhold, L., & Moraldi, M. 1989,ApJ,336, 495 Borysow, A., Jorgensen, U. G., & Zheng, C. 1997, A&A,324, 185 Borysow, A., & Moraldi, M. 1993, JChPh,99, 8424
Borysow, A., & Moraldi, M. 1994, MolPh,81, 1277 Borysow, A., & Tang, C. 1993,Icar,105, 175
Boselli, A., Boissier, S., Cortese, L., et al. 2009,ApJ,706, 1527
Brasseur, C. M., Stetson, P. B., & VandenBerg, D. A. 2010,AJ,140, 1672 Brott, I., & Hauschildt, P. H. 2005, in Proc. Gaia Symp.(ESA SP-576), The
Three-Dimensional Universe with Gaia, ed. C. Turon, K. S. O’Flaherty & M. A. C. Perryman(Noordwijk: ESA), 565
Buonanno, R., Corsi, C. E., Pulone, L., et al. 1998, A&A,333, 505 Calamida, A., Bono, G., & Stetson, P. B. 2007,ApJ,670, 400 Calamida, A., Sahu, K. C., Anderson, J., et al. 2014,ApJ,790, 164 Cappellari, M., McDermid, R. M., Alatalo, K., et al. 2012,Natur,484, 485 Carretta, E., Bragaglia, A., Gratton, R., et al. 2009,A&A,508, 695 Cardelli, J. A., Clayton, G. C., & Mathis, J. S. 1989, IAUS,135, 5 Carretta, E., & Gratton, R. G. 1997, A&AS,121, 95
Castelli, F., & Kurucz, R. L. 2003, in IAU Proc. 210th Symp., Modelling of Stellar Atmospheres, ed. N. Piskunov, W. W. Weiss & D. F. Gray (Cambridge: Cambridge Univ. Press), A20
Cezario, E., Coelho, P. R. T., Alves-Brito, A., et al. 2013, A&A,549, 60 Clem, J. L., VandenBerg, D. A., & Stetson, P. B. 2007,AJ,134, 1890 Clem, J. L., VandenBerg, D. A., & Stetson, P. B 2008,AJ,135, 682 Conroy, C., & van Dokkum, P. G. 2012,ApJ,760, 71
Conroy, C., van Dokkum, P. G., & Graves, G. J. 2013,ApJ,L763, 25 Coppola, G., Dall’Ora, M., Ripepi, V., et al. 2011,MNRAS,416, 1056 Degl’Innocenti, S., Prada Moroni, P. G., Marconi, M., & Ruoppo, A. 2008,
Ap&SS,316, 25
Delahaye, F., & Pinsonneault, M. H. 2006,ApJ,649, 529
Dell’Omodarme, M., Valle, G., Degl’Innocenti, S., & Prada Moroni, P. G. 2012,A&A,540, A26
Del Principe, M., Piersimoni, A. M., & Storm, J. 2006,ApJ,652, 362 Di Cecco, A., Becucci, R., Bono, G., et al. 2010,PASP,122, 991 Di Cecco, A., Zocchi, A., Varri, A. L., et al. 2013,AJ,145, 103 Dore, P., Borysow, A., & Frommhold, L. 1986, JChPh,84, 5211 Dore, P., & Filabozzi, A. 1990, CaJPh,68, 1196
Dotter, A., Sarajedini, A., & Anderson, J. 2011,ApJ,738, 74 Eggen, O. J., Lynden-Bell, D., & Sandage, A. R. 1962,ApJ,136, 748 Ferraro, F. R., Lanzoni, B., & Dalessandro, E. 2012,Natur,492, 393 Fiorentino, G., Lanzoni, B., & Dalessandro, E. 2014,ApJ,783, 34 Frogel, J. A., Persson, S. E., & Cohen, J. G. 1979,ApJ,227, 499 Fu, Y., Borysow, A., & Moraldi, M. 1996, PhRvA,53, 201 Fukugita, M., Ichikawa, T., Gunn, J. E., et al. 1996,AJ,111, 1748 Fukugita, M., & Kawasaki, M. 2006,ApJ,646, 691
Geffert, M., & Maintz, G. 2000, A&AS,144, 227
Gennaro, M., Prada Moroni, P. G., & Degl’Innocenti, S. 2010,A&A,518, A13 Girardi, L., Bertelli, G., Bressan, A., et al. 2002,A&A,391, 295
Grevesse, N., Noels, A., & Sauval, A. J. 1993, A&A,271, 587 Grundahl, F., Stetson, P. B., & Andersen, M. I. 2002, A&A,395, 481 Gruszka, M., & Borysow, A. 1997,Icar,129, 172
Gruszka & Borysow, A. 1998, MolPh,93, 1007
Gustafsson, B., Edvardsson, B., Eriksson, K., et al. 2008,A&A,486, 951 Gustafsson, M., & Frommhold, L. 2001,ApJ,546, 1168
Gustafsson, M., & Frommhold, L. 2003,A&A,400, 1161 Harris, W. E. 1996,AJ,112, 1487
Hodder, P. J. C., Nemec, J. M., Richer, H. B., & Fahlman, G. G. 1992,AJ, 103, 460
Kucinskas, A., Hauschildt, P. H., Ludwig, H.-G., et al. 2005,A&A,442, 281 Iannicola, G., Monelli, M., Bono, G., et al. 2009,ApJL,696, L120
Raimondo, G., Castellani, V., Cassisi, S., et al. 2002,ApJ,569, 975 Reid, N. 1998,AJ,115, 204
Renzini, A., & Fusi Pecci, F. 1988,AR&A,26, 199 Salaris, M., & Weiss, A. 2002,A&A,388, 492
Sarajedini, A., Bedin, L. R., & Chaboyer, B. 2007,AJ,133, 1658 Sarajedini, A., Dotter, A., & Kirkpatrick, A. 2009,ApJ,698, 1872 Saumon, D., Bergeron, P., Lunine, J. I., et al. 1994,ApJ,424, 333
VandenBerg, D. A., Bergbusch, P. A., & Dowler, P. D. 2006,ApJS,162, 375 Vandenberg, D. A., Brogaard, K., Leaman, R., & Casagrande, L. 2013,ApJ,
775, 134
VandenBerg, D. A., Swenson, F. J., Rogers, F. J., et al. 2000,ApJ,532, 430 Zoccali, M., Barbuy, B., Hill, V., et al. 2004,A&A,423, 507
Zoccali, M., Cassisi, S., & Frogel, J. A. 2000,ApJ,530, 418 Zoccali, M., Renzini, A., Ortolani, S., et al. 2003, A&A,399, 931