Publisher’s version / Version de l'éditeur:
Vous avez des questions? Nous pouvons vous aider. Pour communiquer directement avec un auteur, consultez la première page de la revue dans laquelle son article a été publié afin de trouver ses coordonnées. Si vous n’arrivez pas à les repérer, communiquez avec nous à [email protected].
Questions? Contact the NRC Publications Archive team at
[email protected]. If you wish to email the authors directly, please see the first page of the publication for their contact information.
https://publications-cnrc.canada.ca/fra/droits
L’accès à ce site Web et l’utilisation de son contenu sont assujettis aux conditions présentées dans le site LISEZ CES CONDITIONS ATTENTIVEMENT AVANT D’UTILISER CE SITE WEB.
The 12th International Conference on Fire and Materials 2009 [Proceedings], pp.
1-12, 2009-01-26
READ THESE TERMS AND CONDITIONS CAREFULLY BEFORE USING THIS WEBSITE. https://nrc-publications.canada.ca/eng/copyright
NRC Publications Archive Record / Notice des Archives des publications du CNRC :
https://nrc-publications.canada.ca/eng/view/object/?id=91c50f79-5891-4e35-8d08-aa8fc16daada https://publications-cnrc.canada.ca/fra/voir/objet/?id=91c50f79-5891-4e35-8d08-aa8fc16daada
NRC Publications Archive
Archives des publications du CNRC
This publication could be one of several versions: author’s original, accepted manuscript or the publisher’s version. / La version de cette publication peut être l’une des suivantes : la version prépublication de l’auteur, la version acceptée du manuscrit ou la version de l’éditeur.
Access and use of this website and the material on it are subject to the Terms and Conditions set forth at
Smoldering of a flexible polyurethane foam sofa
http://irc.nrc-cnrc.gc.ca
S m o l d e r i n g o f a f l e x i b l e p o l y u r e t h a n e f o a m s o f a
N R C C - 5 0 5 7 2
B i j l o o s , M . ; L o u g h e e d , G . D .
2 0 0 9 - 0 1 - 2 6
A version of this document is published in / Une version de ce document se trouve dans:
12th International Conference on Fire and Materials, San Francisco, CA, January 26-28, 2009, pp. 12
The material in this document is covered by the provisions of the Copyright Act, by Canadian laws, policies, regulations and international agreements. Such provisions serve to identify the information source and, in specific instances, to prohibit reproduction of materials without written permission. For more information visit http://laws.justice.gc.ca/en/showtdm/cs/C-42
Les renseignements dans ce document sont protégés par la Loi sur le droit d'auteur, par les lois, les politiques et les règlements du Canada et des accords internationaux. Ces dispositions permettent d'identifier la source de l'information et, dans certains cas, d'interdire la copie de documents sans permission écrite. Pour obtenir de plus amples renseignements : http://lois.justice.gc.ca/fr/showtdm/cs/C-42
SMOLDERING OF A FLEXIBLE POLYURETHANE
FOAM SOFA
Martin Bijloos and G.D. Lougheed National Research Council Canada
ABSTRACT
A series of room-scale and full-scale experiments were conducted to investigate a fire incident involving a smoldering sofa. The sofa consisted of a 711 mm long by 508 mm high by 406 mm thick block of polyurethane foam covered with a lightweight cotton fabric. In the fire incident, the sofa was in contact with a faulty electrical baseboard heater. During the investigation by firefighters, the sofa was moved and transitioned to a flaming fire resulting in extensive flaming through the exterior window and the doorway to the room within 5-10 s.
Experiments were carried out in an ISO 9705 standard room where a block of flexible polyurethane foam, obtained from the sofa manufacturer and covered with standard sofa fabric, was placed against a 700 W electrical baseboard heater. Temperatures were monitored at the foam/electrical baseboard interface and other locations in the room. Time resolved FTIR spectroscopy was used to analyze the decomposition products leading up to fuel depletion or self-ignition. GC-MS measurements were also carried out to help in the identification of compounds in the FTIR spectra. A complex mixture of compounds were identified and quantified. In this paper, the results of the room-scale experiments and the gas analysis are discussed.
INTRODUCTION
Flexible polyurethane (FPU) foam has integrated itself into society as a necessity. It is present in a great number of consumer products (i.e. chairs, sofas, beds, cushions, etc.). While the end product poses negligible health risks1 when used according to the manufacturer’s instructions, it is a source of combustible material in dwellings.
The literature provides a number of reports on the flammability of FPU in indoor environments2,3,4,5. The toxicity of the thermal decomposition products of FPU has also received a lot of attention from fire researchers6,7,8. However, another hazardous aspect of the thermal decomposition of FPU is the production of many volatile organic compounds (VOCs) with relatively low flammability limits8. Under the right conditions, the presence of these gases can potentially create an ignitable atmosphere.
A series of room-scale and full-scale experiments were conducted to investigate a fire incident involving a smoldering sofa. The objectives of this study included: 1) Investigation of the parameters that affect the smoldering process of an FPU foam sofa pushed against an electrical baseboard heater in a room environment. 2) Investigation of the parameters that affect the distribution of smoke in the room. 3) Determination of the thermal decomposition products produced by the smoldering FPU foam.
The sofa consisted of a 711 mm long by 508 mm high by 406 mm thick block of polyurethane foam covered with a lightweight cotton fabric. In the fire incident, the sofa was in contact with a faulty electrical baseboard heater. During the investigation by firefighters, the sofa was moved and transitioned
to a flaming fire resulting in extensive flaming through the exterior window and the doorway to the room within 5-10 s.
This paper summarizes the results of the room-scale tests in which time resolved FTIR spectroscopy was used to analyze the decomposition products leading up to fuel depletion or self-ignition. GC-MS measurements were also carried out to help in the identification of compounds in the FTIR spectra. A complex mixture of compounds were identified and quantified.
EXPERIMENTAL Materials and setup
The room scale tests were carried out in an ISO 9705 standard room. The dimensions of the room were 2.4 m wide, 3.6 m long and 2.4 m high. The room had a single doorway, 0.9 m wide and 2.0 m high in one of the 2.4 m wide walls. The walls were lined with gypsum board.
A 500 mm long, 700 W electrical baseboard heater was used as the heating source. The heater was installed at the base and centered on the wall opposite the doorway of the room (see Figure 1). The safety systems in the heater were removed and the heater was rewired. The new configuration allowed the heater and thus the temperature to be controlled by a variac.
A block of FPU foam obtained from the sofa manufacturer and covered with standard sofa cotton fabric was placed against the heater (see Figure 2). The FPU block dimensions were 711 mm long, 508 mm high and 406 mm thick. This represented approximately 1/3 of the sofa involved in the fire incident.
The gap between the FPU block and the wall was covered with ceramic fiber insulation. This limited heat loss. Also, a cotton textile material was suspended from the ceiling against the back wall to simulate a curtain.
Instrumentation
The room was fitted with seven thermocouples to monitor the temperatures at various locations (Figure 1). Five thermocouples were located 25 mm from the ceiling at the centre and quarter-points of the compartment. Another thermocouple was installed 25 mm from the top of the room opening at its centre. The remaining thermocouple was sandwiched between the sofa section and the baseboard heater. A thermocouple tree was suspended from the ceiling above and centered on the FPU foam block. The thermocouple tree was made of eight thermocouples spaced at 50 mm intervals starting approximately 50 mm from the ceiling.
The smoke from the smoldering FPU foam sofa was extracted at two locations in the room. The first location was ~305 mm above the centerline of the FPU foam block and 100 mm from the back wall of the room. The second location was on the centerline of the room 1.3 m from the door opening and 100 mm below the ceiling. The outdoor air was also sampled as a reference. An MKS 2030 FTIR Multi-Gas Analyzer was used to analyze the gas samples from the three locations. A manifold with automatically controlled valves alternated between the three extraction points at a frequency of 30 s or 1 min. The FTIR Multi-Gas Analyzer gas cell was kept at a temperature of 190°C. The pumping system, manifold, and heated lines were all kept at a temperature of ~150°C. The gases were extracted at a rate of ~4 L/min.
Figure 1. Sketch of room test facility (not to scale) Thermocouple tree Thermocouple Thermocouple on heater Heate
Figure 2. Typical foam setup
r FPU Sample line
RESULTS & DISCUSSION
The Thermal Decomposition of a Commercial FPU with an Electrical Baseboard Heater
A thermal decomposition mechanism for FPU has been reported9,10. The Thermo-Gravimetric Analyzer (TGA) analyses in these studies indicated a two step mechanism in a nitrogen atmosphere. The first step occurred within a temperature range from ~200°C to ~350°C and consisted of melting the foam into a liquid. The second step was the decomposition of the liquid at temperatures above ~350°C. Cone calorimeter tests were also presented10. These tests indicated a similar process in ambient air with the combustion of products evolved from the melting of the foam into a tar producing a first peak heat release rate and a second peak by the combustion of the tar. The first step of this mechanism is ascribed to the smoldering (oxidative pyrolysis) of an FPU foam.
Experiments were carried out to produce smoldering conditions using an electrical baseboard heater. The smoldering/decomposition of the FPU was produced when it was placed directly on the floor of the room and pushed against the heater mounted to the wall. The gap between the foam and the wall had to be covered with a 25mm thick ceramic fiber insulation to prevent heat losses. Without the insulation over the gap, the temperatures at the foam/heater interface were limited to ~200°C using the 700 W heater. Higher temperatures were obtained in tests with the full sofa using a 1500 W baseboard heater.
Based on a visual inspection and the smell in the room, the heater/foam sofa interface was found to produce negligible amounts of smoke below about 250°C. Above this temperature, smoldering occurred. These results are in agreement with the literature8 that indicates FPU foams decompose rapidly above 250°C.
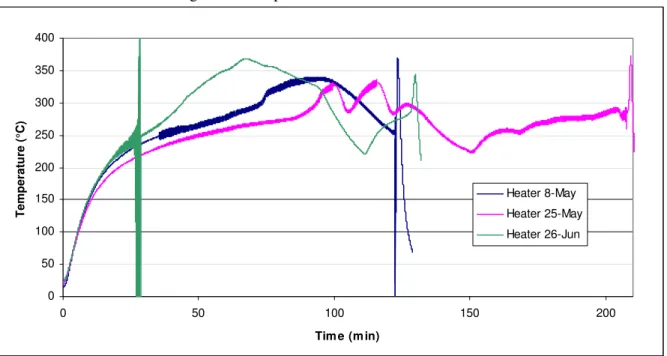
Figure 3 shows the temperatures measured at the foam/heater interface with time for three typical experiments. An initial steady increase in temperature was observed up to ~250°C. An increase in the rate of temperature rise occurred above 250°C. The heat released during the decomposition of the foam was a likely cause of this second temperature rise.
Figure 3. Temperature at sofa/heater interface.
0 50 100 150 200 250 300 350 400 0 50 100 150 200 Tim e (m in) Temper atur e (°C ) Heater 8-May Heater 25-May Heater 26-Jun
While the general trend was similar, variations were observed between the tests. These variations could be due to the intrinsic properties of each baseboard heater as the heaters were destroyed in each test. However, the repeatability of the temperature profile up to ~200°C suggests that the baseboard heater played a minor role in the observed variations.
Differences in the contact between the heater and the sofa section are considered to be the more likely source of variations from test to test. In spite of the care taken to install the heater and produce a good heater/sofa contact in each test, differences in the test setups could result in temperature profile variations. It was found that the heater/sofa interface temperature began to drop when the foam lost contact with the heater as the foam shrunk during the smoldering process. In certain tests, it was necessary to push the foam against the heater to maintain the temperature in the decomposition zone. This produced a secondary temperature rise (as seen in Heater 25-May profile, Figure 3).
Smoke Generation and Distribution
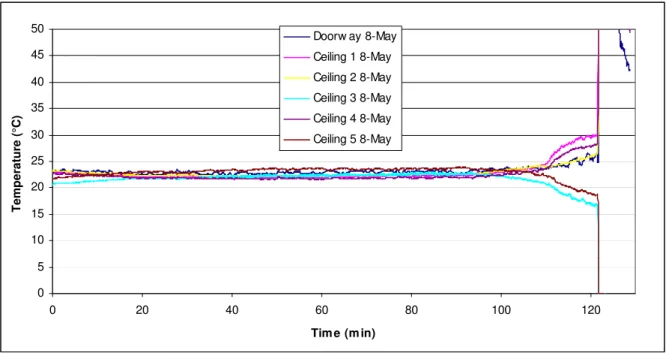
To determine the effect of accumulated smoldering gases from the foam on the temperature in the test room, measurements were taken at the ceiling, doorway and above the foam. Initial tests were carried out with the doorway of the room fully open. In these tests, a considerable amount of smoke escaped through the doorway. The smoke remaining in the room was also found to mix over the height of the room. As a result, the temperature increase at the ceiling level was minimal until the later part of the experiment when the foam self-ignited or was moved to initiate a flaming fire (see Figure 4).
Figure 4. Temperatures at the ceiling and doorway.
0 5 10 15 20 25 30 35 40 45 50 0 20 40 60 80 100 120 Tim e (m in) Temper atur e (°C ) Doorw ay 8-May Ceiling 1 8-May Ceiling 2 8-May Ceiling 3 8-May Ceiling 4 8-May Ceiling 5 8-May
Additional tests were carried out to retain more smoke. The top ¼, ½ and ¾ of the doorway was covered in these tests. An initial increase in temperature at the ceiling by the baseboard heater was observed for tests carried out at lower (20-30°C) ambient temperatures; the ambient temperature was not controlled in the testing environment. At higher ambient temperatures, a temperature rise due to the heater was not observed. This suggests that stratification of the smoke would be dependent on the ambient temperature. Otherwise, these tests produced similar temperature profiles to the ones depicted in Figure 4. Finally, partially covering the upper portion of the doorway did not result in a noticeable reduction of the mixing
of the smoke over the height of the room. The mixing of the smoke was likely due to the airflow into the room through the bottom portion of the doorway.
It was not possible to produce a stratified smoke distribution in the test room such as the one described by the firefighters in the apartment fire incident. However, two main parameters of the real incident were not reproduced in the room scale experiments. The buildup of gases in the apartment fire incident occurred over a minimum of 20 h. The relatively fast buildup of gases generated in the mock-up room experiments (typically 2-3 hours) may have caused significant air movement and mixing. Also, the apartment was a completely closed environment with a limited number of leakage routes; the smoke would have leaked mainly through light fixtures and gaps around doors and windows. In comparison, the doorway leakage in the mock-up room experiments was substantial.
Chemical Composition of the Smoke
The firefighters that responded to the apartment smoldering sofa fire incident witnessed extensive flaming through the window and doorway to the room within 5-10 s after moving the sofa. This suggested the presence of a flammable gas mixture in the apartment. The smoke accumulated in the test room was continuously sampled through an FTIR spectrometer to determine its chemical composition as a function of time.
extensive flaming through the window and doorway to the room within 5-10 s after moving the sofa. This suggested the presence of a flammable gas mixture in the apartment. The smoke accumulated in the test room was continuously sampled through an FTIR spectrometer to determine its chemical composition as a function of time.
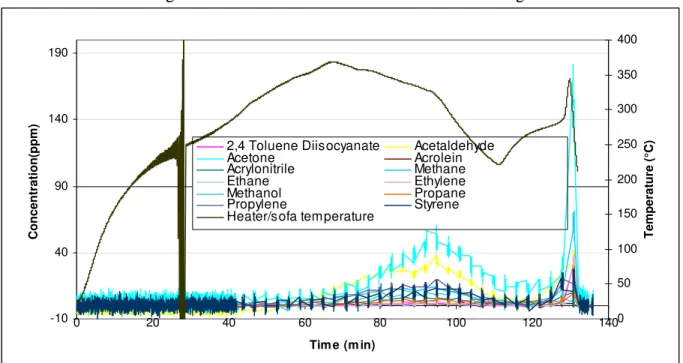
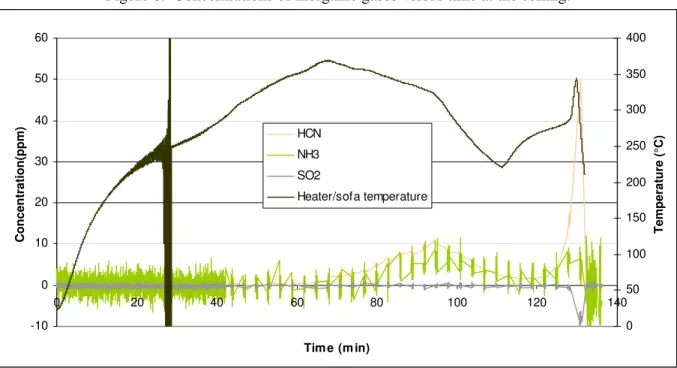
The time-resolved concentrations of VOCs identified during a typical smoldering test in the test room are depicted in Figure 5. Inorganic compounds are shown separately in Figure 6 for clarity. The onset of gas detection for all species occurred during the second rise in temperature, above ~250°C. This corresponded closely to the point in time when the first wisps of smoke were observed in the room. The smoldering process produced VOCs and other gases “mainly” in the form of a visible smoke; certain species were perceived as odors much earlier than the measured onset of gas evolution.
The time-resolved concentrations of VOCs identified during a typical smoldering test in the test room are depicted in Figure 5. Inorganic compounds are shown separately in Figure 6 for clarity. The onset of gas detection for all species occurred during the second rise in temperature, above ~250°C. This corresponded closely to the point in time when the first wisps of smoke were observed in the room. The smoldering process produced VOCs and other gases “mainly” in the form of a visible smoke; certain species were perceived as odors much earlier than the measured onset of gas evolution.
Figure 5. VOC concentrations versus time at the ceiling. Figure 5. VOC concentrations versus time at the ceiling.
-10 40 90 140 190 0 20 40 60 80 100 120 140 Tim e (m in) Concentration(ppm) 0 50 100 150 200 250 300 350 400 Temperature (°C)
2,4 Toluene Diisocyanate Acetaldehyde
Acetone Acrolein Acrylonitrile Methane Ethane Ethylene Methanol Propane Propylene Styrene Heater/sofa temperature
Figure 6. Concentrations of inorganic gases versus time at the ceiling. -10 0 10 20 30 40 50 60 0 20 40 60 80 100 120 140 Tim e (m in) Concentration(ppm) 0 50 100 150 200 250 300 350 400 Temperature (°C) HCN NH3 SO2 Heater/sofa temperature
During the tests, a faint fruity odor was perceived in the early stages of the smoldering. This later developed into an acrid fruity odor that became so irritating that respirators were required even a fair distance away from the test room. It is difficult to determine what specific compounds are responsible for the odors perceived; structure-odor-relationship models are not always reliable in predicting the odor of a compound or mixtrure11,12. However, a good match was made when comparing the odor experienced in the tests with that reported for pure TDI vapors13. The odor of pure TDI vapor is described as a sharp fruity smell. While the tests indicated very little TDI present in the gas mixture, the odor threshold for 2,4 TDI is only 0.17 ppm13. The literature also reports the presence of small amounts (0.425 ppm) of TDI above the odor threshold when TDI based FPU foams are thermally decomposed in a room scale scenario7. Consequently, it is suggested that TDI was an important contributor to the odors perceived during the smoldering of the FPU foam sofa.
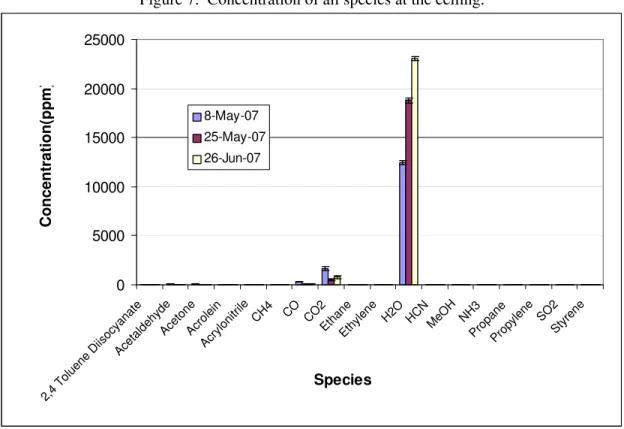
The concentrations of species present in the smoke were obtained by averaging 8 seconds of time-resolved data during the peak gas evolution. Figure 7 shows the concentrations of all species identified. Water vapor was the dominant species followed by carbon dioxide and carbon monoxide. A significant variation of the water concentration was observed from test to test. The main source of water was from the ambient air. Since ambient conditions in the test environment were not controlled, the humidity in the air could vary significantly from day to day.
Figure 8 depicts all species except water, carbon dioxide and carbon monoxide. The variations observed from test to test were the result of ambient water fluctuations and other test parameters including test duration and heating profile.
The literature provides limited information on the gas mixture produced by smoldering FPU foams. Typically, reports have been made on the thermal decomposition of FPUs in inert atmospheres such as nitrogen9,14. Other studies in air focused on the concentration of toxicants such as isocyanate and
hydrogen cyanide6,7. However, a review by Orzel8 has addressed the thermal decomposition of FPUs in an inert atmosphere and air. The species identified in this study fit the reported gas mixtures produced by the smoldering of FPU foams.
Figure 7. Concentration of all species at the ceiling. 0 5000 10000 15000 20000 25000 2,4 Tolu ene Diis ocyan ate Acet aldehy de Acet one Acro lein Acry lonit rile CH4 CO CO 2 Etha ne Ethylene H2O HCNMeOH NH3 Pro pane Prop ylene SO2 Styre ne Species Concentration(ppm ) 8-May-07 25-May-07 26-Jun-07
Figure 8. Concentration of selected species at the ceiling.
0 10 20 30 40 50 60 70 80 90 2,4 Toluen e Diis ocyanat e Acet aldehy de Acet one Acr olei n Acry lonit rile CH4 EthaneEthylene HC N MeOH NH3 Prop ane Propylene SO2 Styr ene Species Concentration(ppm) 8-May-07 25-May-07 26-Jun-07
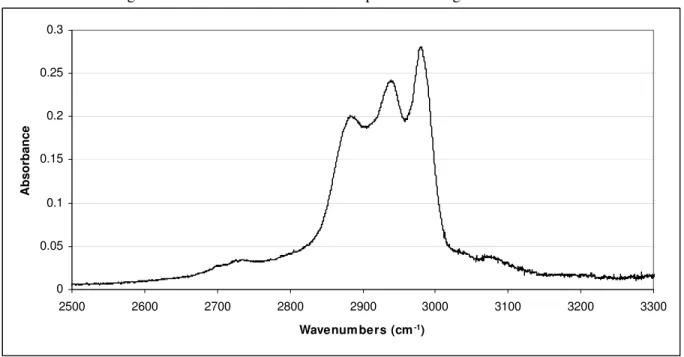
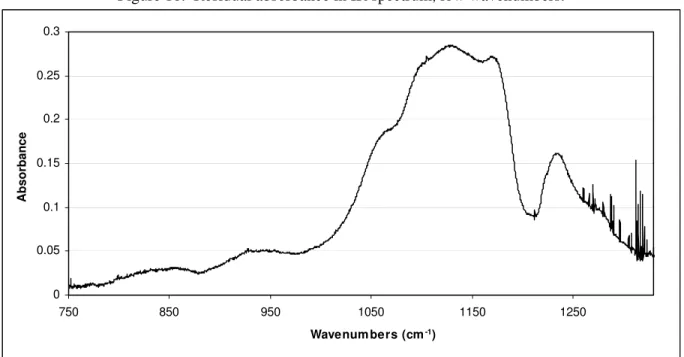
It was not possible to identify all of the chemical species present in the IR spectral data due to the limited scope of the compound library used. Figure 9 and 10 show the residual spectrum obtained by subtracting all identified chemical species from the sample spectrum. At higher wavenumbers, strong absorption bands are observed at 2983, 2939 and 2890 cm-1. These bands indicate the presence of mainly aliphatic hydrocarbons. Absorptions in the range 2850-2700 cm-1 can be ascribed to the C-H stretching of methyl groups attached to an oxygen or nitrogen atom. At lower wavenumbers, the strong bands from 1250 cm-1 to 1000 cm-1 suggest the presence of ethers, amines and alcohols. Absorptions from 1000 cm-1 down to 800 cm-1 indicate the presence of small amounts of tri-substituted benzenes and alkenes. There is also a bit of absorption at just above 3000 cm-1 in the range where aromatic C-H stretching is observed.
Based on the previous breakdown of the residual IR spectrum, it is suggested that some lower molecular weight polyethers, amines, polyols and tri-substituted benzenes were produced in the first step of the thermal decomposition of the FPU under study. GC-MS measurements did not provide an exact identification of all species but provided evidence of the presence of C6 to C11 hydrocarbons most likely in the form of ethers and alcohols. They also indicated the presence of tri-substituted benzenes.
Pearce et al9 have suggested a two route mechanism for the first step of the thermal decomposition of FPU foams. The major products were TDI, regenerated polyol, Di-Amino Toluenes (DAT) and double-bond terminated polyethers. The latter qualitatively fit with the unknown species suggested from the IR residual spectrum shown in Figures 9 and 10.
It was also shown by Pearce et al14 that TDI and DAT react almost instantaneously to form polyurea most likely in the form of an aerosol. Their results provided evidence that the polyurea aerosol is the yellow smoke observed during the thermal decomposition of FPUs. While no direct measurements were carried out to provide evidence of the presence of polyurea aerosol in this study, a whitish to yellowish-brown colored smoke was observed. In addition, the sampling pump filters installed upstream of the FTIR would clog after a few tests. Upon removing the clogged filters, a hard dark brown residue was found on their surface. The presence of a polyurea aerosol in the test room smoke could not be ruled out.
Figure 9. Residual absorbance in IR spectrum at high wavenumbers.
0 0.05 0.1 0.15 0.2 0.25 0.3 2500 2600 2700 2800 2900 3000 3100 3200 3300 Wavenum bers (cm-1) Absorbance
Figure 10. Residual absorbance in IR spectrum, low wavenumbers. 0 0.05 0.1 0.15 0.2 0.25 0.3 750 850 950 1050 1150 1250 Wavenum bers (cm-1) Absorbance
Lower Flammability Limit of the Gas Mixture
Based on the concentration measurements from the previous section, a percent composition of VOCs was obtained.
These results are shown in
Figure 11. Twelve compounds were identified and measured. The dominant compounds with relative percentages ~5% or higher were acetone, acetaldehyde, propylene, styrene, methane, methanol and acrylonitrile. Even though the concentrations of the VOCs varied from test to test (see Figure 8), the results summarized in Figure 9 indicate good repeatability between tests. This means that the relative quantities of VOCs in the smoke layer were similar in each experiment. It was possible to obtain an estimate of the lower flammability limit of the gas mixture based on the measured concentrations of identified VOCs.The lower flammability limits (LFL) of the VOCs and other flammable species identified in the tests are shown in Table 115. Most of the species that were produced in the smoldering tests have lower flammability concentrations of 1-5% volume in air.
The relation between the lower flammability limit of a gas mixture and the percent volume concentration of each species present is as follows:
(
)
∑
= = n 1 i fi i m LFL C 100 LFL [1]where Cfi is the volume percent of fuel gas i in the fuel gas mixture. The LFL of the gas mixture present
in the mock-up room tests was estimated to be approximately 2.6% volume in air.
The concentrations of VOCs shown previously were well below the LFL of the gas mixture extracted from the test room. Indeed, the smoke/gases were distributed over the height of the room and there were substantial losses through the doorway. Nevertheless, the LFL estimate indicates that under certain conditions it would be possible to produce a flammable gas mixture.
Figure 11. Percent composition of VOCs at the ceiling. 0 5 10 15 20 25 30 35 2,4 To luen e D iiso cyan ate Acet alde hyd e Acet one Acro lein Acryl onitr ile CH4 Eth ane Eth ylene MeOH Prop ane Prop ylen e Styr ene Species Relative % 8-May-07 25-May-07 26-Jun-07
Table 1. Lower Flammability Limits of VOCs and other flammable species. Combustible Lower Flammability Limit
(Volume percent) 2,4 Toluene Diisocyanate NA Acetaldehyde 4.0 Acetone 2.6 Acrolein 2.8 Acrylonitrile 3.0 Methane 5.0 Carbon monoxide 12.5 Ethane 3.0 Ethylene 2.7 Methanol 6.7 Ammonia 15.0 Propane 2.1 Propylene 2.4 Styrene 1.1
CONCLUSION
The smoldering process of an FPU foam sofa in contact with an electrical baseboard heater was investigated. It was not possible to produce a stratified layer of smoke such as was observed by the firefighters involved in the smoldering sofa incident. There was substantial leakage through the door opening of the test facility. The smoldering process produced in the tests was also a lot faster (2-3 h) than what was observed in the real incident (above 20 hours). However, the results indicated the presence of a flammable mixture of gases with an estimated LFL of 2.6. This LFL does not take into account the presence of other species found to be present in the smoke (i.e. polyethers, amines and polyols). The presence of a polyurea aerosol might also play a role. Nevertheless, the addition of these other species to the mix could potentially lower the LFL estimated in this paper.
REFERENCES
1Hillier, K. et al., Cellular Polymers, Vol. 22, No. 4, 2003, p.237-259 2
Le Bras, Michel et al., Polymer Degradation and Stability, Vol. 88, 2005, p.28-34
3
Lefebvre, Jérôme et al., Polymer Testing, Vol. 23, 2004, p.281-290
4
Chao, C. Y. H. and J. H. Wang, Combustion and Flame, Vol. 127, 2001, p.2252-2264
5
Vanspeybroek, R. et al., Fire and Materials, Vol. 17, 1993, p.167-172
6
Blomqvist, Per et al., SP Fire Technology, Report 2005:29, 2005, 51p.
7
Blomqvist, Per et al., Fire and Materials, Vol. 27, 2003, p.275-294
8
Orzel, R.A. et al., Journal of the American College of Toxicology, Vol. 8, No. 6, 1989, p. 1139-1175
9
Ravey, M. and Eli M. Pearce, Journal of Applied Polymer Science, Vol. 63, 1997, p.47-74
10Lefebvre, Jérôme et al., Journal of Fire Sciences, Vol. 21, 2003, p.343-367 11Rossiter, Karen J., Chemical Reviews, Vol. 96, 1996, p.3201-3240
12Turin, Luca and Fumiko Yoshii, Structure-Odor Relationships, in Handbook of Olfaction and Gustation,
New York : M. Dekker, 2003
132,4 Toluene Diisocyanate properties, The U.S. Environmental Protection Agency Web Site, 2000 14Ravey, M. et al., Journal of Applied Polymer Science, Vol. 68, 1998, p.231-254
15Beyler, C., Flammability Limits of Premixed and Diffusion Flames, in Society of Fire Protection
Engineers Handbook, National Fire Protection Association, Quincy MA, 2002
16Silverstein, R. M. et al., Spectrometric Identification of Organic Compounds Fith Edition, John Wiley &