Publisher’s version / Version de l'éditeur:
Vous avez des questions? Nous pouvons vous aider. Pour communiquer directement avec un auteur, consultez la
première page de la revue dans laquelle son article a été publié afin de trouver ses coordonnées. Si vous n’arrivez pas à les repérer, communiquez avec nous à [email protected].
Questions? Contact the NRC Publications Archive team at
[email protected]. If you wish to email the authors directly, please see the first page of the publication for their contact information.
https://publications-cnrc.canada.ca/fra/droits
L’accès à ce site Web et l’utilisation de son contenu sont assujettis aux conditions présentées dans le site LISEZ CES CONDITIONS ATTENTIVEMENT AVANT D’UTILISER CE SITE WEB.
RTO-AVT-168 Symposium on Morphing Vehicles [Proceedings], 2009
READ THESE TERMS AND CONDITIONS CAREFULLY BEFORE USING THIS WEBSITE.
https://nrc-publications.canada.ca/eng/copyright
NRC Publications Archive Record / Notice des Archives des publications du CNRC :
https://nrc-publications.canada.ca/eng/view/object/?id=e8d072dc-bff0-438c-adb5-21f9cacc651c https://publications-cnrc.canada.ca/fra/voir/objet/?id=e8d072dc-bff0-438c-adb5-21f9cacc651c
This publication could be one of several versions: author’s original, accepted manuscript or the publisher’s version. / La version de cette publication peut être l’une des suivantes : la version prépublication de l’auteur, la version acceptée du manuscrit ou la version de l’éditeur.
Access and use of this website and the material on it are subject to the Terms and Conditions set forth at
Towards drag reduction on a morphing wing by transition detection
and delay using kulite sensors and smart material actuators
Popov, Andrei Vladimir; Botez, Ruxandra Mihaela; Grigorie, Teodor lucian;
Mamou, Mahmoud; Mebarki, Youssef; Jahrhaus, Brian; Khalid, Mahmood
Towards drag reduction on a morphing wing by transition detection and
delay using kulite sensors and smart material actuators
Andrei Vladimir Popov, Ruxandra Mihaela Botez and Lucian Teodor Grigorie ETS, LARCASE, Notre Dame West, Montreal, Que., Canada, H3C-1K3 Mahmoud Mamou, Youssef Mébarki
,
Brian Jahrhaus and Mahmood KhalidNational Research Council Canada, Ottawa Ontario, Canada, K1A 0R6
ABSTRACT
In this paper, wind tunnel experiment was performed for boundary layer transition control on a morphing wing. Surface pressure fluctuations were measured using Kulite transducers at high sampling rate. A controller, linking the Kulites signals fluctuation to the smart material actuators, is incorporated to the control system, where the signals are analyzed and the transition location is detected. Several wind tunnel test runs for various Mach numbers and angles of attack were performed in the 6 × 9 ft2 wind tunnel at the Institute for Aerospace Research at the National Research Council Canada. A rectangular finite aspect ratio wing, having a morphing airfoil cross section due to a flexible skin installed on the upper surface of the wing, was instrumented with sixteen Kulite transducers. The Mach number was varied from 0.2 to 0.3 and the angle of attack between -1o and 2o. Unsteady pressure signals were recorded and analyzed and a thorough comparison, in terms of mean pressure coefficients and their standard deviations, was performed against theoretical predictions using the XFoil computational fluid dynamics code. The unsteady pressure signals were analyzed through FFT spectral decomposition for detecting the Tollmien-Schlichting waves frequencies that trigger transition. In addition, infra red measurements were performed to asses the performance of the Kulite transducers in detecting the transition location and serve as an additional validation of the XFoil code in predicting the transition location .
NOMENCLATURE
- angle of attackc - chord
Cp - pressure coefficient
N - N factor = ln (A/A0)
RMS - root mean square, standard deviation of a noised signal SMA - shape memory actuators
PAPER NBR - 2 RTO-MP-AVT-168 changing its shape, thickness and camber, according to local flow fluctuations measurements, to maintain large laminar regions (less friction) on the entire wing surface. As laminar flow exhibits less friction than the turbulent one, a substantial viscous drag could be achieved, which leads to some appreciable percentages in fuel consumption. [1].
The airborne modification of an aircraft wing airfoil shape can be realized continuously to maintain laminar flow over the wing surface as flight conditions change. To achieve such a full operating concept, a development of a closed control system is required to connect the flow fluctuations over the wing surface to the deformation mechanism (actuators) [2].
The design proposed consists of a rectangular wing model that incorporates two parts. One fixed part (the lower surface of the wing) is rigid and sustains all the resistance forces acting during service and another part (the upper surface of the wing) is flexible and consists in a flexible skin that changes its shape through electrically controlled mechanical actuators. The morphing of the extrados will lead to aerodynamical changes in the flow over the upper surface of the wing.
The flow fluctuation signals can be detected by conventional pressure transducers such as Kulite sensors. Linked to a controller system, the collected data would be treated in real time aiming to identify the location of transition and then sending a signal to the actuator system to adjust the wing surface to delay the transition location. Several measurement techniques for transition detection were developed in the past using various pressure transducers such as microphones [3], hot films [4-7] and piezoelectric [8]. The Kulite transducers have many advantages such as they are relatively small, have very good precision and accuracy and they can be mounted within a cavity with a tiny hole exposed to the flow [9].
In this paper, the possibility of the technological realization of a morphing wing, to be tested in a wind tunnel, is analyzed. The methodology describing the analyses of the unsteady pressure signals measured through the Kulite transducers in order to determine the transition location on the upper surface of the wing is shown. The transition point positions found by this method are compared to theoretical values calculated using the free licensed computational fluid dynamics code XFoil [10]. Finally, the results recorded during the wind tunnel test using infrared technique are shown, in terms of transient temperature distribution over the wing surface. The transition location is determined by analyzing the temperature gradient over wing.
2.0
EXPERIMENTAL SETUP DESCRIPTION
The wind tunnel tests were performed at the Institute for Aerospace Research at the National Research Council Canada. The purpose of these tests was to assess the performance of the kulite sensors in detecting small pressure variations on a wing model with a morphing skin to improve flow laminarity over the wing surface.
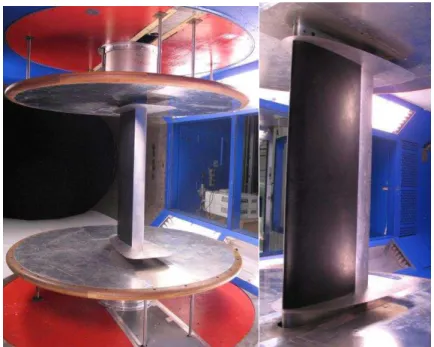
The wing is rectangular in plan form and has a span of 4 ft and a chord of 1.64 ft. The wing consists of two parts. One part is rigid and very stiff built with an aluminium alloy and design to support all the aerodynamic loads and the other part is flexible and consists in a flexible skin installed on the upper surface of the wing. The flexible skin shape is controlled by smart material actuators at two controlling points, such that any optimized shape for a given flow conditions can be achieved by adjusting the vertical displacement of the SMA’s (see Fig. 1-3).
As reference airfoil shape, the laminar airfoil WTEA [11] was considered, and the optimised airfoils were previously designed by modifying the reference airfoil for each airflow condition as a combination of angles of attack and Mach numbers. Each optimized airfoil shape is characterized by the closet transition location to the trailing edge. Thirty optimised airfoils designed for the airflow cases combinations of Mach
numbers 0.2, 0.225, 0.25, 0.275, 0.3 and angles of attack -1, -0.5, 0, 0.5, 1 and 2 deg.
Figure 1: Views of the wing model with the flexible skin on the upper surface
Figure 2: View of the upper part of the wing model showing the interior of the flexible skin, shape memory actuators and optical and kulite sensors instalments
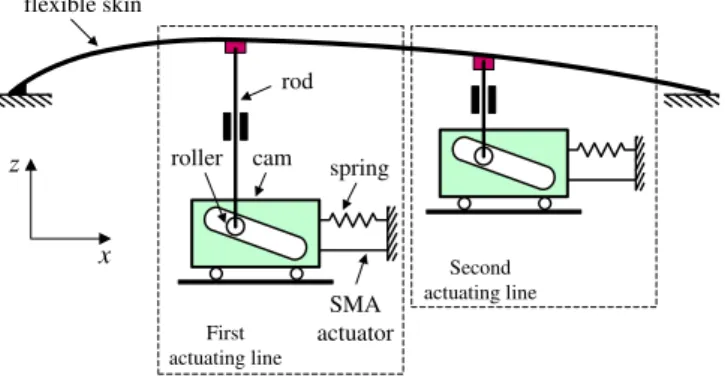
PAPER NBR - 4 RTO-MP-AVT-168 x z flexible skin spring SMA actuator rod roller cam First actuating line Second actuating line
Figure 3: Schematics of the flexible skin mechanical actuation, showing the mechanical principle of morphing The flexible skin span the wing upper surface and occupies 75% chord starting from the leading edge. The skin is made of composite material with a thickness of 2 mm allowing sufficient deformation while conserving its structural integrity. At the mid-span of the wing, the model is instrumented with sixteen Kulite transducers installed on a diagonal line at an angle of 15 degrees with respect to the mid-chord line. The transducers were distributed non uniformly over 60% of the chord to accommodate the SMA actuators supporting struts (see Fig. 2). The transducers were numbered from 1 through 16 starting from the leading edge. The distribution was chosen adequately to avoid any flow contamination or taps interference. The transducers diagonal line angle is chosen to be bigger than the angle of an eventual formed of turbulence wedge [12].
The Kulite sensors XCQ-062 series types have dimensions of 0.066 in diameter and 0.375 in length plus a flexible metallic reference tube of 0.016 in outside diameter and 1 in length. They also have a 5 psi differential pressure range with infinitesimal resolution and a natural frequency range up to 150 kHz. The data acquisition sampling rate was set to 10 kHz per channel.
The model was installed vertically in the wind tunnel and for each airflow condition combination of angles of attack and Mach numbers a “run” was recorded for 30 seconds. The first set of runs was performed for all airflow conditions using the wing model with actuators in “zero” position i.e., which characterize the reference airfoil. The run is followed by a set of runs for all airflow conditions using the wing model with the actuators in the “optimised” position. Finally, several runs were performed using the wing model with the actuators in a fixed position to validate the pressure measurements, for transition location detection, with the infrared observation. .
3.0
WIND TUNNEL DATA ANALYSES
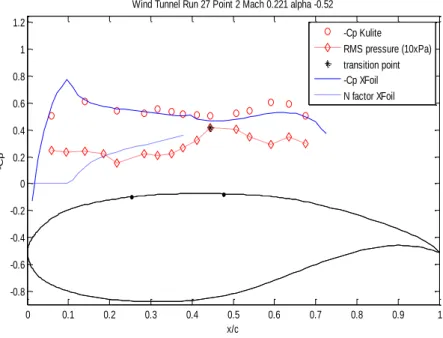
After model disassembly, the Kulite transducers #2 and #4 were found to be defective and their mean pressure information was removed from the pressure coefficients distribution plots. The unsteady signal they recorded was still analysed and the results of this analysis is shown in the following paragraphs. In Figure 4, the pressure coefficient Cp distribution plot over the upper surface of the reference airfoil is
shown. The measured Kulite mean pressure data are compared to the XFoil code predicted results. Also in the figure, the N-factor and the root mean square (RMS) pressure coefficient of each Kulite sensor signal are displayed. The N-factor is used by XFoil code as a criterion to determine the chordwise transition location, using a freestream turbulence of 0.14%. .
0 0.1 0.2 0.3 0.4 0.5 0.6 0.7 0.8 0.9 1 -0.8 -0.6 -0.4 -0.2 0 0.2 0.4 0.6 0.8 1 1.2 x/c -C p
Wind Tunnel Run 27 Point 2 Mach 0.221 alpha -0.52 -Cp Kulite RMS pressure (10xPa) transition point -Cp XFoil N factor XFoil
Figure 4: Measured kulite transducers vs. theoretical XFoil Cp values over the upper surface of the reference airfoil, showing good agreement between theoretical curve and experimental points in the Cp curve as well as the transition point location predicted through e^N method and RMS experimental measurements. In this case it is considered as the transition location the sensor that measured the highest RMS level i.e. sensor # 11.
The unsteady signal, analysed through Fast Fourier Transform FFT spectral decomposition, is shown in Figure 5. It is observed that the sensor #11 exhibits a high signal amplitudes in the neighbourhood of the 4 kHz frequency, which is an indication of the Tollmien-Schlichting waves occurrence that trigger the transition on the sensor location and subsequently the turbulent flow in the downstream of the sensor location. For the downstream sensors, the amplitudes of the pressure signal variations decrease but remain always greater than the pressure variations in the laminar flow. As a quantifier of the pressure signal variations amplitudes, the RMS which is the standard deviation of the pressure signal values with respect to the mean value for a high pass filtered signal at 1 kHz is used.
PAPER NBR - 6 RTO-MP-AVT-168 0 1000 2000 3000 4000 5000 0 0.2 0.4 0.6 0.8 1x 10 -3 Frequency (Hz) P re s s ( P a )
Wind Tunnel Run 27 Point 3 Mach 0.221 alpha -0.52
Kulite #1 Kulite #2 Kulite #3 Kulite #4 Kulite #5 0 1000 2000 3000 4000 5000 0 0.2 0.4 0.6 0.8 1x 10 -3 Frequency (Hz) P re s s ( P a ) Kulite #6 Kulite #7 Kulite #8 Kulite #9 Kulite #10 Kulite #11 0 1000 2000 3000 4000 5000 0 0.2 0.4 0.6 0.8 1x 10 -3 Frequency (Hz) P re s s ( P a ) Kulite #12 Kulite #13 Kulite #14 Kulite #15 Kulite #16
Figure 5: FFT spectral decomposition of the 16 kulite sensors channels, showing that channel # 11 has the highest signal amplitudes in the neighborhood of 4 kHz
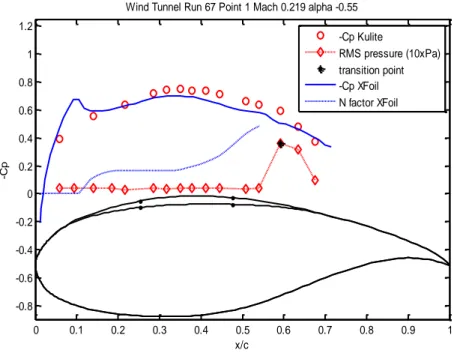
0 0.1 0.2 0.3 0.4 0.5 0.6 0.7 0.8 0.9 1 -0.8 -0.6 -0.4 -0.2 0 0.2 0.4 0.6 0.8 1 1.2 x/c -C p
Wind Tunnel Run 67 Point 1 Mach 0.219 alpha -0.55
-Cp Kulite
RMS pressure (10xPa) transition point -Cp XFoil N factor XFoil
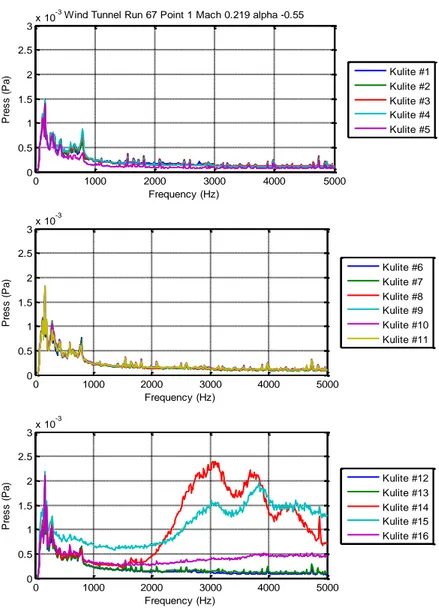
Figure 6: Measured Kulite transducers vs. theoretical XFoil pressure coefficient values over the upper surface of the optimized airfoil, showing good agreement between theoretical curve and experimental points in the Cp curve as well as the transition point location predicted through e^N method and RMS experimental measurements. Also it is observed an improvement in the flow by morphing the upper surface through the reduction of the noise over the upper surface and retarding the transition occurrence to the location of the sensor # 14.
PAPER NBR - 8 RTO-MP-AVT-168 0 1000 2000 3000 4000 5000 0 0.5 1 1.5 2 2.5 3x 10 -3 Frequency (Hz) P re s s ( P a )
Wind Tunnel Run 67 Point 1 Mach 0.219 alpha -0.55
Kulite #1 Kulite #2 Kulite #3 Kulite #4 Kulite #5 0 1000 2000 3000 4000 5000 0 0.5 1 1.5 2 2.5 3x 10 -3 Frequency (Hz) P re s s ( P a ) Kulite #6 Kulite #7 Kulite #8 Kulite #9 Kulite #10 Kulite #11 0 1000 2000 3000 4000 5000 0 0.5 1 1.5 2 2.5 3x 10 -3 Frequency (Hz) P re s s ( P a ) Kulite #12 Kulite #13 Kulite #14 Kulite #15 Kulite #16
Figure 7: FFT spectral decomposition of the 16 Kulite sensors channels, showing that channel # 14 and subsequently channel # 15 have the highest signal amplitudes in the neighborhood of 3 and 4 kHz
4.0
RESULTS AND DISCUSSION
Each airflow condition was simulated in XFoil code to predict the pressure coefficient Cp distribution and transition point location on the upper surface of the airfoil. The critical value Ncr = 7.34 was used in the
simulation to match the turbulence level T = 0.14% measured in the wind tunnel using Mack’s correlation (1) [13].
Ncr 8.43 2.4 log( ) T (1)
distribution and pressures RMS (Fig. 2 and 4). The spectral analysis shows that the Tollmien-Schlichting waves occurred at 2 – 3 kHz up to 5kHz for Reynolds numbers of 2 – 3 x 10⁶
(Fig. 5 and 7). Also it was found that the magnitude of the pressure variations in the laminar flow boundary layer are of the order 5 x 10⁻⁴ Pa (7.25 x 10⁻⁸ psi). The transition between laminar flow and turbulent flow is shown by an increase of the pressure variations of the order 1 – 3 x 10⁻³ Pa (1.45 – 4.4 x 10⁻⁷ psi). In the turbulent flow, the pressure variations magnitude decreases at the same order value as in the laminar flow. In order to detect transition, a sensor able of measuring pressure with a resolution of about 2 x 10⁻⁴ Pa (3 x 10⁻⁸ psi or 20dB SPL) and a sampling rate of 10 kHz could be used.
5.0
TRANSITION DETECTION VALIDATION
To validate the measurements using kulite sensors, several measurements were performed using infra red camera that detects temperature distribution on the wing surface. These temperature maps show the laminar boundary layer region where the heat transfer coefficient is relatively low and the turbulent boundary layer region where the coefficient is very high owing to turbulence mixing. The transition from laminar to turbulent flow is characterized by a strong temperature gradient between the two regions. In Fig. 8 the temperature map on the upper surface of the model – the flexible skin – is shown. On the infra-red picture, owing to thermal mass and electrical excitation, two vertical lines – of the two SMA actuators that are installed along the span (on the positions 0.25 x/c and 0.47 x/c) and two rows of sensors arranged in a V shape could be clearly observed (see Fig. 9 and 11). The upper row are the 16 kulite sensors and the lower row are the 16 optical sensors that were tested in the same time with the kulite sensors. The optical sensors proved to be blind to the small pressure variations in the boundary layer due to the precision and resolution inadequacy.
Figure 8: Temperature map using infrared camera on the upper surface showing two turbulent wedges due to leaking sensors, also being visible the natural transition between laminar and turbulent flow
PAPER NBR - 10 RTO-MP-AVT-168
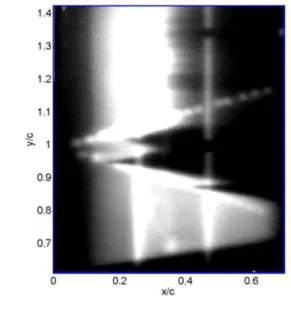
Figure 9: Temperature map using infrared camera on the upper surface of the model for a flow of Re = 2.55 x 10⁶, Mach = 0.224 and angle of attack = - 0.53 deg, showing three turbulent wedges due
to three leaking sensors, one kulite sensor and two optical sensor and the transition location at 0.4 x/c.
In Fig. 9 there are two zones, the lighter zone show the laminar flow and the darker zone show the turbulent flow. The line differentiating between the lighter and darker zone is the region where transition occurs (0.35 – 0.4 x/c). In this picture, three V turbulence wedges are shown which indicate three leaking sensors – Kulite sensor #4 and optical sensors #3 and #10.
The test were performed on an airfoil obtained by the actuator #1 deflection of 0.4 mm and actuator #2 deflection of 1.5 mm. The airfoils were scanned afterwards in this position as well as in “zero” position corresponding to the reference airfoil. The scanned airfoils were used in the pressure coefficient Cp
distribution and N-factor distribution computation using the XFoil code (see Fig. 10).
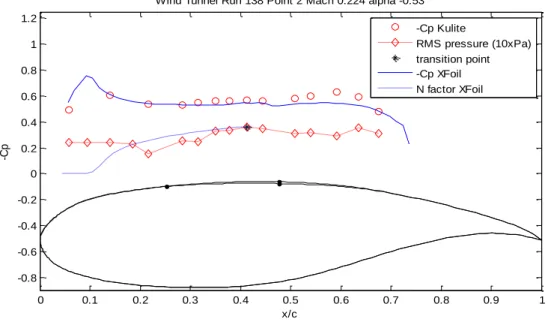
Figure 10 shows the Cp curve distributions calculated by the XFoil code, the Cp curve distribution
measured by the Kulite sensors and the N-factor curve computed by XFoil compared to the pressure RMS of the Kulite sensors pressure signals. The maximum RMS value of the Kulite sensors pressure signal is considered to be an indication of the transition occurrence. In this case, the sensor #10 (installed on the 0.41 x/c position) shows the maximum value of the RMS.
0 0.1 0.2 0.3 0.4 0.5 0.6 0.7 0.8 0.9 1 -0.8 -0.6 -0.4 -0.2 0 0.2 0.4 0.6 0.8 1 1.2 x/c -C p
Wind Tunnel Run 138 Point 2 Mach 0.224 alpha -0.53 -Cp Kulite
RMS pressure (10xPa) transition point -Cp XFoil N factor XFoil
Figure 10: Measured by Kulite transducers vs. theoretical XFoil Cp values over the upper surface of the model for airflow of Re = 2.55 x 10⁶, Mach = 0.224 and angle of attack = - 0.53 deg, showing a good agreement between theoretical curve and experimental points in the Cp curve as well as the transition point location predicted through e^N method and RMS experimental measurements. Also it is observed transition occurrence to the location of the sensor # 10 which agrees with the IR map.
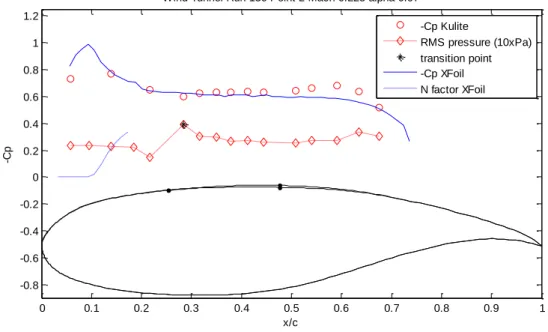
Figures 11 and 12 show another test visualised with infra-red camera for validation purposes in which the Reynolds number was 2.55 x 10⁶, Mach = 0.225 and = 0.97o. Fig. 11 shows the same but negative infra-red picture, the dark zones indicate the laminar flows while the lighter zones indicate turbulent flows. In the picture the transition occurs in the same position as the first SMA actuator, which is confirmed in Figure 12 through the RMS analysis. In Fig. 12 the maximum RMS value belongs to the sensor #6 which is installed at the position 0.28 x/c.
PAPER NBR - 12 RTO-MP-AVT-168
Figure 11: Temperature map using infrared camera on the upper surface of the model for a flow of Re = 2.55 x 10⁶, Mach = 0.225 and angle of attack = 0.97 deg
0 0.1 0.2 0.3 0.4 0.5 0.6 0.7 0.8 0.9 1 -0.8 -0.6 -0.4 -0.2 0 0.2 0.4 0.6 0.8 1 1.2 x/c -C p
Wind Tunnel Run 136 Point 2 Mach 0.225 alpha 0.97 -Cp Kulite
RMS pressure (10xPa) transition point -Cp XFoil N factor XFoil
Figure 12: Measured by kulite transducers vs. theoretical XFoil pressure coefficient values over the upper surface of the model for an airflow of Re = 2.55 x 10⁶, Mach number = 0.225 and angle of attack = 0.97 deg
6.0
SUMMARY
The method of detecting transition using Kulites sensors proved to be very efficient and in good agreement with the theoretical prediction using e^N method as well as experimental validation by IR image processing. The transition point localisation by calculating the max RMS of a sensors array distributed chordwise will be used in the future design of a morphing wing closed loop controller.
7.0
ACKNOWLEDGMENTS
We would like to thank the Consortium of Research in the Aerospatial Industry in Quebec (CRIAQ), Thales Avionics, Bombardier Aerospace, and the National Sciences and Engineering Research Council (NSERC) for the technological and financial support that made this research possible. We would also like to thank George Henri Simon for initiating CRIAQ 7.1 project and Philippe Molaret from Thales Avionics Inc. and Eric Laurendeau from Bombardier Aerospace for their collaboration on this work.
8.0
REFERENCES
[1] Zingg, D. W., Diosady, L., and Billing, L., “Adaptive Airfoils for Drag Reduction at Transonic Speeds,” AIAA paper 2006-3656, 2006.
[2] Popov, A., V., Labib, M., Fays, J., Botez, R.M., “Closed loop control simulations on a morphing laminar airfoil using shape memory alloys actuators”, AIAA Journal of Aircraft, Vol. 45, No. 5, 2008, pp. 1794-1803.
[3] Rioual, J.-L., Nelson, P. A., and Fisher, M. J., “Experiments on the Automatic Control of Boundary-Layer Transition,” Journal of Aircraft, Vol. 31, No. 6, pp. 1416-1418.
[4] Mangalam, S. M., “Real-Time Extraction of Hydrodynamic Flow Characteristics Using Surface Signature,” IEEE Journal of Oceanic Engineering, Vol. 29, No. 3, pp. 622-630, July 2004.
[5] Krishnan, V., Sundaram, S., and Viswanath, P. R., “Transition Related Studies on Two Low-Drag Airfoils,” Current Science, Vol. 70, No. 6, pp. 829-833, Sept. 2000.
[6] Khalid, M., “The Use of Hot-Film Technique for Boundary Layer Studies on a 21% Thick Airfoil,” Aeronautical Note NAE-AN-45,NRC No. 27892, Ottawa, May 1987.
[7] Haussmann, F., and Schroder, W., “Coated Hot-Film Sensors for Transition Detection in Cruise Flight,” Journal of Aircraft, Vol. 43, No. 2, March–April 2006.
[8] Nitsche, T., Mirow, P., and Dorfler, T., “Investigations on Flow Instabilities on Airfoils by Means of Piezofoil-Arrays,” Laminar-Turbulent Transition IUTAM Symposium Toulouse, France 1989, Springer–Verlag, Berlin/Heidelberg, 1990, pp. 129–135.
[9] Kulite pressure transducer XCQ-062 series data specifications
http://www.kulite.com/pdfs/pdf_Data_Sheets/XCQ-062.pdf
[10] Drela, M., “Implicit Implementation of the Full e^N Transition Criterion,” AIAA paper 2003–4066, 2003.