HAL Id: cea-01406870
https://hal-cea.archives-ouvertes.fr/cea-01406870
Submitted on 1 Dec 2016
HAL is a multi-disciplinary open access
archive for the deposit and dissemination of
sci-entific research documents, whether they are
pub-lished or not. The documents may come from
teaching and research institutions in France or
abroad, or from public or private research centers.
L’archive ouverte pluridisciplinaire HAL, est
destinée au dépôt et à la diffusion de documents
scientifiques de niveau recherche, publiés ou non,
émanant des établissements d’enseignement et de
recherche français ou étrangers, des laboratoires
publics ou privés.
Driving Spin Excitations by Hydrostatic Pressure in
BiFeO3
J. Buhot, C. Toulouse, Y. Gallais, A. Sacuto, R. de Sousa, D. Wang, L.
Bellaiche, M. Bibes, Alain Barthélémy, A. Forget, et al.
To cite this version:
J. Buhot, C. Toulouse, Y. Gallais, A. Sacuto, R. de Sousa, et al.. Driving Spin Excitations by
Hydrostatic Pressure in BiFeO3. Physical Review Letters, American Physical Society, 2015, 115 (26),
�10.1103/PhysRevLett.115.267204�. �cea-01406870�
J. Buhot1,∗ C. Toulouse1, Y. Gallais1, A. Sacuto1, R. de Sousa2, D. Wang3, L. Bellaiche4,
M. Bibes5, A. Barth´el´emy5, A. Forget6, D. Colson6, M. Cazayous1,† and M-A. Measson1‡ 1Laboratoire Mat´eriaux et Ph´enom`enes Quantiques, UMR 7162 CNRS,
Universit´e Paris Diderot, Bˆat. Condorcet 75205 Paris Cedex 13, France
2
Department of Physics and Astronomy, University of Victoria, Victoria, B.C., Canada, V8W 2Y2
3
Electronic Materials Research Laboratory - Key Laboratory of the Ministry of Education, and International Center for Dielectric Research,
Xi’an Jiaotong University, Xi’an 710049, China
4
Physics Department and Institute for Nanoscience and Engineering, University of Arkansas, Fayetteville, Arkansas 72701, USA
5
Unit´e Mixte de Physique CNRS/Thales, 1 av. A. Fresnel, Campus de l’Ecole Polytechnique, F-91767 Palaiseau, France et Universit´e Paris-Sud, 91405 Orsay, France
6
Service de Physique de l’Etat Condens´e, CEA Saclay, IRAMIS, SPEC (CNRS URA 2464), F-91191 Gif sur Yvette, France
Optical spectroscopy has been combined with computational and theoretical techniques to show how the spin dynamics in the model multiferroic BiFeO3 responds to the application of hydrostatic
pressure and its corresponding series of structural phase transitions from R3c to the Pnma phases. As pressure increases, multiple spin excitations associated with non-collinear cycloidal magnetism collapse into two excitations, which show jump discontinuities at some of the ensuing crystal phase transitions. Effective Hamiltonian approach provides information on the electrical polarization and structural changes of the oxygen octahedra through the successive structural phases. The extracted parameters are then used in a Ginzburg-Landau model to reproduce the evolution with pressure of the spin waves excitations observed at low energy and we demonstrate that the structural phases and the magnetic anisotropy drive and control the spin excitations.
PACS numbers: 77.80.Bh, 75.50.Ee, 75.25.+z, 78.30.Hv
Multiferroic insulators have non-collinear magnetic or-der that drives ferroelectricity, and ferroelectric oror-der that controls magnetism. This demonstrated cross-correlation between electric and magnetic effects shows great promise for the development of magnonic devices whose goal is to use magnetic excitations as a low en-ergy substitute of conventional electronics [1–3]. The spin-lattice interaction plays a decisive role in mediating the combined ferroic properties of multiferroic materials. When induced by epitaxial mismatch or chemical sub-stitutions, strain provides a handle for the complex in-terplay between magnetic and electronic properties and their coupling to structural distortions [4–6]. At present, the mechanisms linking spin excitation to structural de-formation remain hardly accessible, whereas their fine control is highly desirable to build these new technolo-gies.
Bismuth ferrite (BiFeO3) plays an important role in
multiferroics research as it is one of the few materi-als that has coexisting ferroelectricity and magnetism at room temperature [7] with an unusual combination of properties such as large above band gap voltages [8], photovoltaic effect [9] and conductive domain walls [10]. At ambient pressure, it becomes ferroelectric below ' 1100 K, with one of the largest known electrical po-larization (that is, P = 100 µC/cm2). Below 640 K, it
exhibits an antiferromagnetic-like spiral of the cycloidal
type with wavevector Q0 = 2π/64nm [11]. This spiral
transforms into a canted homogenous antiferromagnetic state under epitaxial strain [4, 6] or chemical doping [5]. Hydrostatic pressure is known to induce dramatic changes in BiFeO3’s ferroelectricity and crystal
struc-ture. The large electric polarization either disappears or becomes weak above ≈ 5 GPa, and a total of six struc-tural phase transitions have been observed up to 50 GPa [12, 13].
In this Letter, we combine an advanced high-pressure technique ideally suited to probe simultaneously spin and phonon excitations with Landau-Ginzburg and effective Hamiltonian calculations to elucidate the coupling be-tween spin excitations and structure in the prototypi-cal multiferroic BiFeO3. We determine how
pressure-induced structural transitions drive the magnetic order from a non-collinear to an homogeneous magnetic state. We performed Raman spectroscopy measurements on single crystals of bulk BiFeO3under hydrostatic pressure
up to 12 GPa in a membrane diamond anvil cell. We have developped an original optical experimental setup in or-der to track low energy excitations down to 7 cm−1 un-der extreme conditions (See Supplemental Material). We have thus been able to follow simultaneously the phonon modes and the magnetic excitations under a broad range of hydrostatic pressure.
Figure 1 a) shows the phonon modes and the spin
2 0 5 10 15 20 25 30 35 40 45 50 0 50 100 150 200
0.99 GPa
BiFeO3 Ψ−1 Ψ−2 Ψ+1 Ψ+1 Ψ+0 Φ+2 Φ−1 Φ−2R
am
an
in
te
nsi
ty
(a
rb
.
un
its)
Raman shift (cm
-1)
? Φ+ 1 Spin wave modesPhonon modes R am an in te ns ity ( a. u .) Raman shift (cm-1 ) Spin wave modes x z extra-cyclon modes : ψ y P1
q
[10-1] (-12-1) period λ=62 nm cyclon modes : Φa)
b)
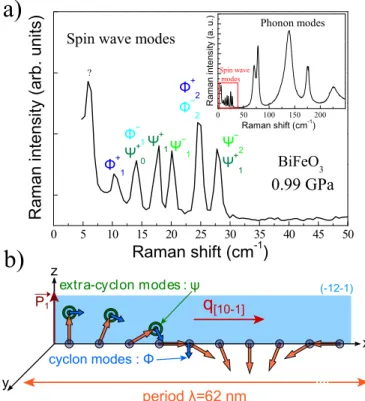
FIG. 1: a) Raman spectrum of spin wave excitation modes at low energy in BiFeO3 under 0.99 GPa and at 300 K. The
assignment of these spin excitation modes is in agreement with Refs. [26, 27]. The first spin wave excitation peak at 7 cm−1 (denoted by ”?”) has not been assigned (See text). Inset: Large energy scale Raman spectrum of phonon modes b) Magnetic incommensurate cycloid in BiFeO3 and the two
sets of spin wave excitations φ and ψ as in-plane cyclon and extra-cyclon modes, respectively. The electrical polarization vector P is along [111] and the cycloid propagating along [1,0,-1] lies in the (-1,2,-1) plane.
tations measured at low pressure. The frequency and the optical selection rules of the phonons modes are charac-teristic of the rhombohedral (R3c) phase [14]. The series of narrow peaks (with linewidth ∼ 1 cm−1) in Fig. 1 a) are the fingerprint of the cycloidal spin excitations at zero wavevector [15]. The spin excitations in BiFeO3can
be decomposed into cyclon (φn) and extra-cyclon (ψn)
modes, corresponding to oscillations in and out of the cy-cloid plane, respectively (Fig. 1 b) [15–17]. The first spin wave excitation peak at 7 cm−1 has not been assigned because it can either be attributed to the Φ+0 mode or can result from small domains in the sample with weak magnetization [18].
As indicated by the change in the phonon modes (See Fig 2 a and Supplemental Material), we observe four structural transitions occurring at about 3.5, 5.5, 7.75 and 11 GPa, from a rhombohedral (R3c) to an or-thorhombic (Pnma) phase through three oror-thorhombic structures (O1, O2, O3), in agreement with previous high
energy Raman scattering and X-ray studies [12]. Thanks to our observation of the new phonon modes occurring
below 100 cm−1, all structural transitions can be tracked, especially the transitions between the O2and O3phases.
0 2 4 6 8 10 12 0,002 E n ergy (c m -1) Pressure (GPa) 0 2 4 6 8 10 12 50 100 150 200 R3c O1 O2 O3 Pnma -0,002 R3c Pnma Pna21 Pca21 0,000 Re lat ive en er gy (Ha rt re e/ 5 at om s) Pressure (GPa)
a)
b)
FIG. 2: a) Evolution of the energies of selected phonon modes in the 40-200 cm−1range. Several modes appear or disappear at the structural transitions. b) Effective Hamiltonian simu-lations of the structure : the plotted lines corresponds to the enthalpies of four different structures as a function of pres-sure, relative to the enthalpy of the R3c phase. As pressure increases we observe the sequence of phase transitions R3c → Pna21 → Pca21 → Pnma.
To support the structural description of BiFeO3
un-der pressure, we performed a theoretical study of the crystalline structure using the effective Hamiltonian ap-proach developed in Refs. [19, 20]. As shown in Fig. 2 b), at low pressure the crystalline structure is rhombo-hedral and belongs to the R3c space group; when the pressure increases, we find several transitions towards or-thorhombic structures with complex oxygen octahedra tilts belonging to the space groups Pna21 and Pca21.
These complex structures belong to the family of nan-otwin phases predicted in Ref. [20] that have energies close to those of the R3c and Pnma states. Finally, at the highest pressures, theory predicts a transition to the orthorhombic structure belonging to the Pnma space group. One can thus notice that all but one of the mea-sured structural phases are reproduced in the calcula-tions. This missing phase is likely another intermedi-ate and stable nanotwin configuration that may have a slightly higher enthalpy in the present effective Hamil-tonian calculations. This theoretical study also provides information on the electrical polarization and structural changes of the oxygen octahedra through the successive
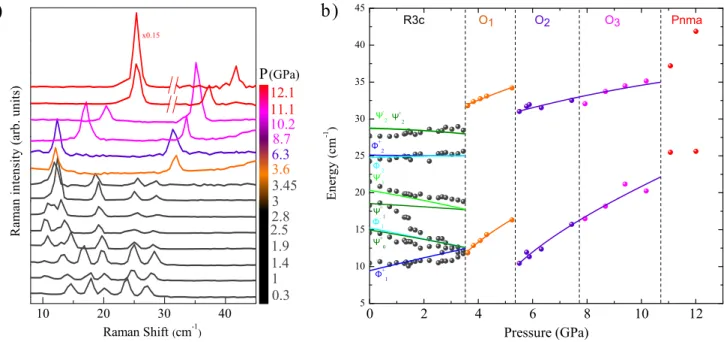
10 20 30 40 x0.15 P 0 2 4 6 8 10 12 Pressure (GPa) 5 10 15 20 25 30 35 40 45 Ψ+ 0 Φ -1 Ψ+1 Ψ+ 2 Ψ-2 Φ -2 Ψ -1 Φ+ 2 E ne rg y ( cm -1 ) Φ+ 1 R am an in te ns it y (a rb . u ni ts ) Raman Shift(cm-1) (GPa)
a)
b)
12.1 11.1 10.2 8.7 6.3 3.6 3.45 3 2.8 2.5 1.9 1.4 1 0.3 O3 O2 R3c O1 PnmaFIG. 3: a) Low energy part of some of the Raman spectra showing the behaviour of the magnetic excitations under pressure. b) Energy of the spin wave excitations in BiFeO3from 0 to 12 GPa reported as a function of pressure. Lines are fits using our
theoretical model (See text) and some structural parameters obtained from computations. Vertical dash lines mark the four structural transitions.
structural phases. These extracted parameters will be shown to be crucial to reproduce the evolution with pres-sure of the spin waves excitations observed at low energy.
Figure 3 a) shows the low-energy part of the Raman spectra obtained at different pressures, and Fig. 3 b) de-picts the corresponding spin excitation energies as a func-tion of the applied pressure. At low pressure, below the first structural transition at 3.5 GPa, we observe that some spin excitations harden while other soften with a clear tendency for the three lowest energy modes to merge towards 12 cm−1. Otherwise, the width of these peaks remains constant under pressure which indicates good hy-drostaticity. Above 3.5 GPa, the crystal structure enters the first orthorhombic phase and only two spin excita-tions are observed, signaling the sudden disappearance of the spin cycloid at the first structural transition. The presence of two spin excitations in the O1 phase shows
that in this pressure range, BiFeO3’s magnetic order is
a simple two-sublattice antiferromagnet. The spin exci-tations harden as the pressure increases. A jump dis-continuity is observed at the O1–to–O2 phase transition
whereas the hardening is continuous through the O2–to–
O3phase transition.
In order to describe these results we propose a modified model for the coupling between magnetism and
ferroelec-tricity in BiFeO3 [19, 21] H = 1 2 X i,δ ( J Si· Si+δ+ [C (ui× δ) + D (ωi− ωi+δ)] ·Si× Si+δ ) − KX i (ui· Si) 2 , (1)
with the sum running over all sites i of the pseudo cubic lattice formed by the Fe3+ ions, with δ being the unit
vector linking each site to its six nearest neighbours. The vector Si describes the Fe3+ spin at site i, while the
vectors uiand ωi represent structural distortions around
this site. More precisely and as schematized in Fig. 4, ui
is the local mode describing the electric dipole moment at site i (the ionic contribution to the electrical polarization, P , is proportional to huii), and ωi is a pseudovector
describing oxygen octahedra tilting at site i (the direction of ωi is the axis about which the oxygen octahedron of
site i tilts, while its magnitude is the value of the angle associated with such tilt [22].
All interaction energies in Eq. (1) are expected to be pressure dependent. The exchange interaction J > 0 is known to scale inversely proportional to the tenth power of the distance between the Fe spins [23], and to increase linearly with pressure in each structural phase [12]. The pressure dependence of the other model parameters is not known. The parameter C is the spin-current interaction responsible for cycloidal order in BiFeO3, and the
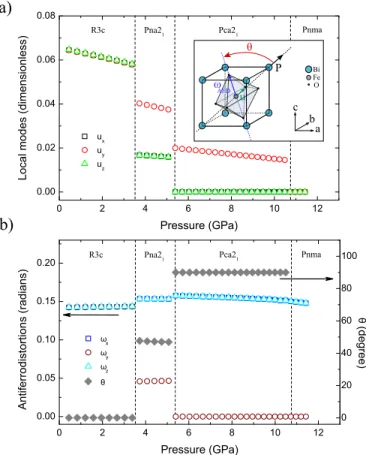
4 0 2 4 6 8 10 12 0.00 0.05 0.10 0.15 0.20 Pca21 A nt iferrod is to rti on s (rad ia ns ) Pressure (GPa) ωx ωy ωz Pnma Pna21 R3c 0 20 40 60 80 100 θ θ (de gre e)
a)
u ωAFD P θ Bi Fe a b c O 0 2 4 6 8 10 12 0.00 0.02 0.04 0.06 0.08 Pnma Pca21 Pna21 Loc al m od es (dim en si on les s) Pressure (GPa) ux uy uz R3cb)
FIG. 4: a) Calculated average local mode hui (directly pro-portional to P) for each phase as a function of pressure. Inset: schematic representation of the local mode u, the polarization P and the antiferrodistortive vector ωAF Ddescribing the
tilt-ing of BiFeO3’s oxygen octahedra in the pseudo-cubic
struc-ture of BiFeO3. The Dzyaloshinskii-Moryia interaction vector
points along ωAF D. b) Calculated antiferrodistortive vector
ωAF D (left scale) and the θ angle between hui and ωAF D
(right scale) as a function of pressure.
[19, 24]. Both C and D arise from the Dzyaloshinskii-Moriya interaction, with C, D ∝ ηSOJ , with ηSO being
the spin-orbit energy splitting of the heaviest lattice ion, Bi3+. Finally, the last term of Eq. (1) models single ion anisotropy, with the anisotropy axis pointing along the local mode vector ui, with K ∝ η2SO as shown in a
mi-croscopic calculation [21].
At ambient pressure and room temperature, BiFeO3
has the R3c structure with the same local mode, u, at all sites i, pointing along [111] and giving rise to P . In addition, the oxygen octahedra adopts an antiferrodis-tortive order, with ωi = ωAF D/2 in one sublattice and
ωi+δ= −ωAF D/2 in the other, with ωAF Dalso pointing
along [111]. This structural configuration combined with Eq. (1) gives rise to the magnetic cycloidal order shown in Fig. 1 b). When the effective anisotropy
Keff = Ku2−
D2ω2AF D
12J (2)
is positive, the ground state of Eq. (1) is an anharmonic
cycloid, with spin excitations splitting into waves of even (+) and odd (−) symmetry with respect to space inver-sion along the cycloid wavevector Q (See Supplemental Material). This splitting is found to be essential to de-scribe the modes [25–27]; for example, at ambient pres-sure, the φ±1 modes are split by 5.5 cm−1[27]. From our model calculations, we expect the evolution with pressure of the splitted modes to track the pressure dependence of J , u, and ωAF D (See Supplemental Material).
Our effective Hamiltonian calculations predict that u decreases with increasing pressure and ωAF D remains
nearly constant in each phase (Fig. 4), as consistent with the known fact that (small) pressure typically reduces ferroelectricity [28]. In Fig. 3 b), the pressure trend of the spin excitations is well reproduced by our simple two parameters model. Only one of them depends on pres-sure (See Supplemental Material).
With pressures above about 3.5 GPa, a structural phase transition has occured, and only two spin exci-tations with frequencies to be denoted by ωhighand ωlow
are observed. Equation (1) predicts a transition to a (canted) homogeneous antiferromagnet when
π2 8 < J |Keff| (Cu)2 ∝ 1 J − ω2 AF D u2 , (3)
so we infer that either J decreases or ωAF D/u increases
during the transition R3c → O1. Both behaviours are
consistent with our effective Hamiltonian calculations. Obviously if P becomes zero right at the O1phase
bound-ary, a transition towards an homogeneous antiferromag-netic state would appear associated with a single spin waves peak. This scenario is inconsistent with the mea-surements and the structural calculations. Indeed, u is not zero in the nanotwin phases as evidenced in Fig. 4 a). We combine the two theoretical models to reproduce the spin wave excitations in the orthorhombic phases. Equation (1) is able to explain the observed magnon data provided that two conditions are satisfied: K < 0 and θ 6= 0, where θ is the angle between hui and ωAF D
shown in Fig. 4. Only under these two conditions do we get ωhigh >
√
2 ωlow with ωlow > 0 as observed
experi-mentally in the homogeneous magnetic phases.
Turning again to our effective Hamiltonian calcula-tions, we see that θ becomes nonzero only after the tran-sition R3c → Pna21; and that θ has a jump
disconti-nuity in the transition Pna21 → Pca21 (Fig. 4). We
do not define θ for the non-polar phase Pnma. Using the effective Hamiltonian calculations of θ for Pna21and
Pca21 to model magnons in the O1 and O2–O3 phases,
respectively, we are able to reproduce the pressure de-pendence of the two spin wave excitations in the O1, O2
and O3(Fig. 3 b)). Therefore, the jumps observed at the
R3c → Pna21 (O1) and the Pna21 (O1) → Pca21 (O2)
structural transitions are directly linked to θ.
In the Pnma phase, we observe two modes at 25 cm−1 and ∼ 40 cm−1 (Fig 3 a)). The first one has quite large
spectral weight (10 times larger than all other magnon peaks), and does not seem to change frequency with in-creasing pressure. The second peak is quite similar to the magnon peaks in other phases. It may be that these first and second peaks are related to the so-called X5+
and R5+ antipolar modes known to occur in the
non-polar Pnma phase [29, 30]. Future work is needed to verify such hypothesis because the model of Eqs. (1)-(3) is presently developed to understand results of the polar R3c, O1, O2 and O3phases.
In summary, via the combination of original Raman scattering experiment and computational and theoretical techniques, we report the magnetic excitations of BiFeO3
as a function of pressure up to 12 GPa, showing for the first time that the material undergoes a series of mag-netic phase transitions linked to structural changes. As pressure increases above 3.5 GPa , the non-collinear cy-cloidal magnetism tranforms into a canted homogeneous antiferromagnet. At the ensuing crystal phase transitions at 5.5, 7.75 and 11 GPa, the two remaining spin excita-tions show jump discontinuities. Effective Hamiltonian approach provides information on the electrical polar-ization and structural changes of the oxygen octahedra through the successive structural phases. The extracted parameters are then used in a Ginzburg-Landau model to reproduce the evolution with pressure of the spin waves excitations observed at low energy in all the structural phases. We demonstrate that the structural phases and the magnetic anisotropy drive and control the spin ex-citations. Pressure reveals several hytherto unexplored regimes in the prototypical multiferroic BiFeO3 and can
help stabilize unstable structural distortions leading to promising novel metastable phases. The control of the crystallographic lattice by ultrafast optical excitations may result in high-speed magnonic thanks to the simul-taneous coherent driving of both lattice and magnetic excitations between different ferroelectric and magnetic phases.
Acknowledgements
C.T., J.B., M.-A. M. and M.C. would like to acknowl-edge support from the French National Research Agency (ANR) through DYMMOS and PRINCESS projects and the General Directorate for Armament (DGA). J.B. and M.-A. M. thank P. Munsch and G. Le Marchand for high-pressure technical support (IMPMC, UPMC, Paris 6). R.d.S. acknowledges support from the Natural Sciences and Engineering Research Council of Canada, through its Discovery program. D.W. and L.B. thank the financial support of NSF grant DMR-1066158.
∗
Present address High Field Magnet Laboratory, Insti-tute for Molecules and Materials, Radboud University
Nijmegen, Toernooiveld 7, 6525 ED Nijmegen, Nether-lands
†
Corresponding Author [email protected]
‡
Corresponding Author [email protected]
[1] P. Rovillain et al., Nature Mater. 9, 975 (2010). [2] Y. Kajiwara et al., Nature 464, 262-267 (2010).
[3] S.O. Demokritov and A.N. Slavin, Magnonics: From fundamentals to applications (Springer-Verlag, Berlin), (2013).
[4] F. Bai et al. Appl. Phys. Lett. 86, 032511 (2005). [5] V.A. Khomchenko et al., Journal of Applied Physics 103,
no.2, 024105 (2008).
[6] D. Sando et al., Nature Mater. 12, 641 (2013).
[7] G. Catalan and J. F. Scott, Adv. Mater. 21, 2463-2485 (2009).
[8] S. Y. Yang et al., Nature Nanotechnol. 5, 143 (2010). [9] M. Alexe and D. Hesse, Nature Commun. 2, 256 (2011). [10] J. Seidel et al., Phys. Rev. Lett. 107, 126805 (2011). [11] I. Sosnowska, T. Peterlin-Neumaier and E. Steichele, J.
Phys. C 15, 4835-4846 (1982).
[12] M. Guennou et al., Phys. Rev. B. 84, 174107 (2011). [13] S. G´omez-Salces et al., Phys. Rev. B 85, 144109 (2012). [14] C. Beekman, A. A. Reijnders, Y. S. Oh, S.W. Cheong,
and K. S. Burch, Phys. Rev. B 86, 020403(R) (2012). [15] M. Cazayous et al. Phys. Rev. Lett. 101, 037601 (2008). [16] R. de Sousa and J. E.Moore, Phys. Rev. B 77, 012406
(2008).
[17] M. K. Singh, R. Katiyar and J. F. Scott, J. Phys. Con-dens. Mat. 20, 252203 (2008).
[18] D. Wang, J. Weerasinghe and L. Bellaiche, Phys. Rev. Lett. 109, 067203 (2012).
[19] D. Rahmedov, D. Wang, J. ´I˜niguez and L. Bellaiche, Phys. Rev. Lett. 109, 037207 (2012).
[20] S. Prosandeev, D. Wang, W. Ren, J. ´I˜niguez and L. Bel-laiche, Adv. Funct. Mater. 23, 234 (2013).
[21] R. de Sousa, M. Allen and M. Cazayous, Phys. Rev. Lett. 110, 267202 (2013).
[22] I. A. Kornev, L. Bellaiche, P. E. Janolin, B. Dkhil and E. Suard, Phys. Rev. Lett. 97, 157601 (2006).
[23] L. E. Gontchar, and A. E. Nikiforov, Phys. Rev. B 66, 014437 (2002).
[24] R. de Sousa, Proc. SPIE 8813, Spintronics VI, 88131L (2013).
[25] D. Talbayev, S.A. Trugman, S. Lee, H.T. Yi, S.-W. Cheong and A.J. Taylor, Phys. Rev. B 83, 094403 (2011). [26] R. S. Fishman, J. T. Haraldsen, N. Furukawa and S.
Miyahara, Phys. Rev. B 87, 134416 (2013).
[27] U. Nagel et al., Phys. Rev. Lett. 110, 257201 (2013). [28] I. A. Kornev et al., Phys. Rev. Lett. 95, 196804 (2005). [29] L. Bellaiche and J. ´I˜niguez, Phys. Rev. B 88, 014104
(2013).
[30] O. Di´eguez, O. E. Gonzalez-Vazquez, J. C. Wojdel and J. ´I˜niguez, Phys. Rev. B 83, 094105 (2011).