Supplement of The Cryosphere, 11, 1015–1033, 2017 http://www.the-cryosphere.net/11/1015/2017/ doi:10.5194/tc-11-1015-2017-supplement © Author(s) 2017. CC Attribution 3.0 License.
Supplement of
Reconstructions of the 1900–2015 Greenland ice sheet surface
mass balance using the regional climate MAR model
Xavier Fettweis et al.
Correspondence to:Xavier Fettweis ([email protected])
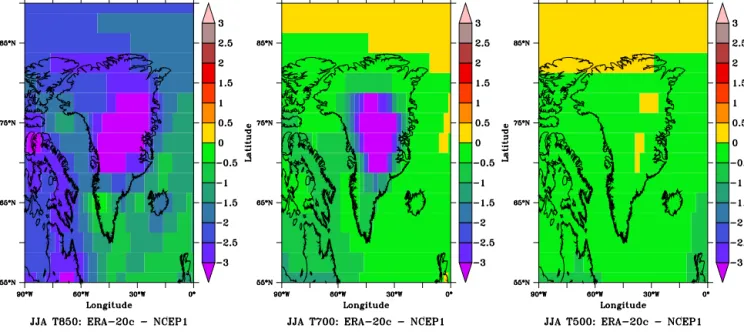
Figure S1. Differences of the JJA 850, 700 and 500 hPa temperature over 1948-2010 between ERA-20C and NCEPv1. Units are Celsius degrees.
Figure S2. Differences of the Annual 850, 700 and 500 hPa temperature over 1948-2010 between ERA-20C and NCEPv1. Units are Celsius degrees.
Figure S3. Differences of the JJA 850, 700 and 500 hPa temperature over 1948-2010 between 20CRv2 and NCEPv1. Units are Celsius degrees.
Figure S4. Differences of the Annual 850, 700 and 500 hPa temperature over 1948-2010 between 20CRv2 and NCEPv1. Units are Celsius degrees.
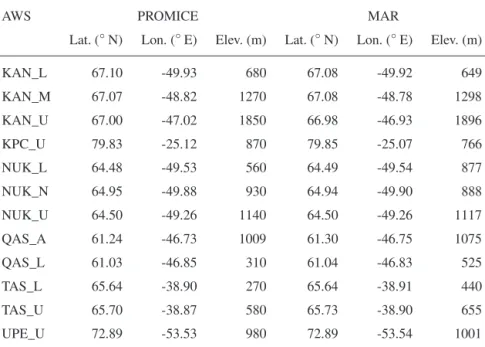
Table S1. Localisation (Latitude, longitude and elevation) of the 12 AWS’s from the PROMICE network used here to validate MAR. The location of the corresponding MAR grid cell is also listed.
AWS PROMICE MAR
Lat. (◦N) Lon. (◦E) Elev. (m) Lat. (◦N) Lon. (◦E) Elev. (m)
KAN_L 67.10 -49.93 680 67.08 -49.92 649 KAN_M 67.07 -48.82 1270 67.08 -48.78 1298 KAN_U 67.00 -47.02 1850 66.98 -46.93 1896 KPC_U 79.83 -25.12 870 79.85 -25.07 766 NUK_L 64.48 -49.53 560 64.49 -49.54 877 NUK_N 64.95 -49.88 930 64.94 -49.90 888 NUK_U 64.50 -49.26 1140 64.50 -49.26 1117 QAS_A 61.24 -46.73 1009 61.30 -46.75 1075 QAS_L 61.03 -46.85 310 61.04 -46.83 525 TAS_L 65.64 -38.90 270 65.64 -38.91 440 TAS_U 65.70 -38.87 580 65.73 -38.90 655 UPE_U 72.89 -53.53 980 72.89 -53.54 1001 5
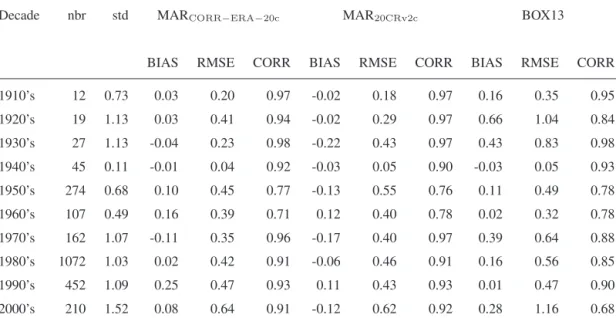
Table S2. Same as Table 3 in the manuscript but for each decade over 1910–2010. The numbers of observations (nbr) as well as the standard deviation (std) of observations are also listed.
Decade nbr std MARCORR−ERA−20c MAR20CRv2c BOX13
BIAS RMSE CORR BIAS RMSE CORR BIAS RMSE CORR 1910’s 12 0.73 0.03 0.20 0.97 -0.02 0.18 0.97 0.16 0.35 0.95 1920’s 19 1.13 0.03 0.41 0.94 -0.02 0.29 0.97 0.66 1.04 0.84 1930’s 27 1.13 -0.04 0.23 0.98 -0.22 0.43 0.97 0.43 0.83 0.98 1940’s 45 0.11 -0.01 0.04 0.92 -0.03 0.05 0.90 -0.03 0.05 0.93 1950’s 274 0.68 0.10 0.45 0.77 -0.13 0.55 0.76 0.11 0.49 0.78 1960’s 107 0.49 0.16 0.39 0.71 0.12 0.40 0.78 0.02 0.32 0.78 1970’s 162 1.07 -0.11 0.35 0.96 -0.17 0.40 0.97 0.39 0.64 0.88 1980’s 1072 1.03 0.02 0.42 0.91 -0.06 0.46 0.91 0.16 0.56 0.85 1990’s 452 1.09 0.25 0.47 0.93 0.11 0.43 0.93 0.01 0.47 0.90 2000’s 210 1.52 0.08 0.64 0.91 -0.12 0.62 0.92 0.28 1.16 0.68