Genetic Correlations Between Body Weight of Cocks and Production Traits in Laying Hens, and
Their Possible Use in Breeding Schemes C. HAGGER
Institute of Animal Sciences, Swiss Federal Institute of Technology, ETH-Zentrum, WEN, CH-8092 Zurich, Switzerland
ABSTRACT Genetic and phenotypic (co)variances between body weight of
cocks (nm = 1,138), BWM, and production traits of hens (nf = 8,844), i.e., egg
number (EN), egg weight (EW), feed intake (FI), and body weight (BWF) were estimated by the restricted maximum likelihood method for an animal model. Six multivariate analyses were carried out to get all desired components. Resulting heritabilities were .292, .754, .682, .732, and .790 for EN, EW, FI, BWF, and BWM, respectively. Estimated genetic correlations between BWM and EN, EW, FI, and BWF, were -.161, .338, .645, and .841, respectively. The correspond-ing estimates between BWF and EN, EW, and FI, were -.036, .294, and .787, respectively. The additional expected selection response in traits of hens from including BWM into the selection criterion of cocks is given for a particular structure with full- and half-sister information and different correlations between BWM and traits of hens.
(Key words: sex differences, body weight, production traits, genetic
relation-ships, selection)
1994 Poultry Science 73:381-387 INTRODUCTION
In breeding schemes designed to im-prove sex-limited traits, e.g., egg produc-tion in poultry, traits of males are usually not included into the selection criteria. Male breeders are selected on information from their full- and half-sisters. If the genetic correlations between traits of fe-males and traits of fe-males were known, it would be possible to combine the informa-tion on both sexes into selecinforma-tion criteria in an optimal way. A fraction of the genetic variation in the selection criterion in the male sex could, thus, be exploited without the need of offspring information. The genetic variation between full- and half-sib males cannot be used in a breeding scheme, if their selection is based on full-and half-sister information only, because in this case, all male full-sibs would have identical selection criteria. Selection of
Received for publication July 19, 1993. Accepted for publication October 14, 1993.
males from offspring information would double the generation interval of cocks in layer breeding. In breeding schemes of laying chickens, only a limited number of males is usually raised. Therefore, record-ing some traits on them, e.g., body weight, could be done with little additional costs. It might even be of interest to investigate traits that are expensive to measure, e.g., feed intake and, thus, create the possibility to put direct selection pressure on it (Katie and Kolstad, 1992). One might also choose to raise more cocks to increase selection intensity to some extent. Including addi-tional information correctly into a selec-tion criterion usually increases its accuracy and, therefore, a higher selection response will be achieved. An attempt to include body weight of cocks into a layer breeding experiment has already been demon-strated by Hagger and Abplanalp (1988).
Knowledge of the genetic correlation between analogous traits of males and females, e.g., body weight, as well as their genetic and phenotypic variances provide information about the genetic similarity of 381
382
such traits. A genetic correlation clearly deviating from 1 would strongly indicate a genetic difference. If this is supported by the estimated correlation, treating the traits of the two sexes as two different traits of a selection criterion would definitely be preferable over their use as one trait with an adjustment for the sex difference of the means. This distinction would also be important if genetic correla-tions with other traits would be different between sexes or even show different signs, as found by Tixier-Boichard et al. (1992).
The introduction of the animal model (Quaas and Pollak, 1980) and increasing computing power enable the multivariate estimation of genetic (co)variances for sizable data sets. For this type of analysis it is a prerequisite that a minimum of the genetic relationships between animals of a population are known. This condition certainly poses no problems in poultry breeding operations or experiments be-cause complete pedigrees are known for many generations, m such a favorable case, it is relatively easy to estimate the genetic covariance between traits not ob-served on all animals, e.g., male body weight and egg weight. However, it has to be remembered that under the
circum-stances addressed, the maximum genetic relationship between informative pairs of animals is one half (full-sibs, sire-daughter, dam-son). Thus, a considerable number of informative animals is neces-sary to reduce the inherently large vari-ance of the estimated genetic correlations.
The aim of this investigation was to estimate genetic correlations between body weight of cocks and several produc-tion traits of hens using data from an experimental layer flock and to check the consequences of including this informa-tion into a selecinforma-tion scheme to improve sex-limited traits in hens.
MATERIALS AND METHODS Data
Data for the investigation arose from a selection experiment with the aim to geneti-cally improve the trait of income minus feed cost between 21 and 40 wk of age in brown
egg layers (Hagger, 1990,1992). The experi-ment consisted of two selection lines (repli-cates) and a control line of 20 male and 80 female breeders each. Hens were selected for five generations on their performance followed by two generations on a restricted best linear unbiased prediction (Quaas and Henderson, 1976) animal model breeding value for the same trait. The restriction built into the selection criterion was for no genetic change in average egg weight during the test period from 21 to 40 wk of age. An average selection intensity of 18.9% among hens was realized during the experi-ment. Males were selected randomly within half-sib families.
The base population consisted of 905 hens with known pedigree that were ob-tained from matings between 50 Rhode Island Red males and 303 White Plymouth Rock females. Full-sib hens of this popula-tion were, if possible, equally distributed to all three lines before the first selection. The same 20 males were used as sires for the first selected generation in all lines. This procedure created additional genetic ties between the lines. Later on, the lines were closed. Between two and three male chicks from each half-sib family were raised and saved until the end of the breeding period. Hens were kept in three-tier single cage batteries of 1,350 cm2 floor space from 14 wk of age on. Egg number and egg weight were recorded daily from onset of lay to 25 wk of age and on 6 d / w k thereafter until 60 wk. Egg production data were adjusted to 28-d periods for missing test days based on the hen's own information on rate of lay and egg weight. Individual feed consump-tion from ad libitum access was recorded continuously for all hens between 21 and 60 wk. All birds were weighed at 10,20,30,40, and 60 (hens only) wk. More details on husbandry of birds and the selection criterion are given elsewhere (Hagger, 1990, 1992).
Altogether, 8,844 hens that had survived to 40 wk and that had eaten less than 10 kg of feed/kg of egg mass produced and records of 1,138 cocks were included in this investigation. Data of hens were adjusted for effects of hatch and laying house within year prior to the analysis. Results are presented for some important traits that determine the economic success of egg
production in the test period of the experi-ment. These are: egg number to 40 wk (EN), average egg weight to 40 wk (EW), feed intake to 40 wk (FI), body weight at 40 wk of females (BWF) and of males (BWM).
Genetic Analyses
Genetic and phenotypic (co)variances were estimated multivariately with the restricted maximum likelihood (REML) method (Patterson and Thompson, 1971) for an animal model containing the fixed effect of generation and the random effects of animal and residual. The complete additive genetic relationship matrix back to the grandparents of the base population was available. For the estimation of the genetic covariances between traits of males and traits of females it is most informative if the genetic relationships between the males and females that were recorded are known and these individuals are close relatives. The genetic ties between the lines estab-lished at the beginning of the experiment in conjunction with the relationship matrix made it possible to combine the data from the three lines. Analyses for several combi-nations of the traits of interest had to be performed. If BWM is to be treated jointly with traits of females, one has to keep in mind that the residual covariance between pairs of these traits is zero. The same model was valid for all traits. The parameters estimated as outlined are the expected parameters of the first generation in the pedigrees, i.e., in the present case, the grandparents of the base population. The DFREML computer programs of Meyer (1991), which provide the necessary capa-bilities, were used.
Variance-covariance matrices between simple, untransformed traits, per defini-tion, have to be positive definite, i.e., all eigenvalues positive. Therefore, if multivar-iate selection is to be applied in a breeding scheme (e.g., a selection index), care should be taken that the matrices fulfill this condition (Hayes and Hill, 1980; Foulley and Ollivier, 1986). Matrices of (co)variance components estimated multivariately and simultaneously by the REML method are positive definite, but the condition may not hold if (co)variance components from several independent multivariate
estima-tions have to be combined to obtain the desired matrix. For such cases, methods exist to transform a matrix to the necessary form (Hayes and Hill, 1981; Mielenz and Wagenknecht, 1992). The genetic (co)vari-ance matrix for the traits EN, EW, FI, BWF, and BWM had to be assembled from components resulting from several analyses and, thus, had to be tested for the condition mentioned.
The consequences of including the per-formance of males (M) as a part of their selection criterion to improve a sex-limited trait of females (F) on expected response and accuracy of selection were investigated with the application of selection index theory (e.g., Falconer, 1982). If selection is for trait F and if the mean of m full-sisters, F5, and the mean(s) of one (several) half-sister group(s) (each of m full-half-sisters), H S Q , are available, the true breeding value of a male, H, can be estimated by a selection index, I1/[2] = ^ F S + b2H5i + [b3M] (one half-sister group). The additional increase of the correlation between true and estimated breeding value, rm, and the expected additional genetic gain, AG, in F from including M into the selection criterion of males, I, can now easily be found. To calculate b;, rM, and AG, the following (co)variances will be needed (additive in-heritance): Var(M) = aJM Var(FS) = Var(HSi) = ±<^F + m 2 Cov(M,FS) Cov(M,HSi) Cov(FS,HSi) Cov(HSi,HSj) Cov(H,M) Cov(H,FS) Cov(H,HSi) 1 - 2ffgMF 1 - 4ffgMF
- V
" 4 V - ^ " 4 V = ffgMF- V
" 2 VI V
where: <rfM and o?F = phenotypic vari-ances of M and F; otF = additive genetic variance of F; ag M F = additive genetic covariance between M and F.
RESULTS AND DISCUSSION
Means for the traits of the population used in the investigation, their phenotypic and genetic standard deviations, together with the number of recorded hens and cocks with complete records are given in Table 1. The values show that the mean performance of the three experimental lines used in this investigation was not far from the performance of commercially available brown egg layers. Cocks were on average more than 1 kg heavier at 40 wk than hens, with a 40% larger standard deviation of their body weight. Differ-ences between sexes in body weight and its standard deviation of the same magni-tude were observed by Bordas et al. (1992) in an experimental flock of Rhode Island Red chickens. The differences in means and standard deviations between body weight of the two sexes may be taken as indication for a genetic difference between the two traits. This remains true, even if the larger standard deviations of BWM are explained as a scale effect.
The estimated genetic (co)variances for the five traits are given in Table 2. These entries were assembled from six indepen-dent multivariate analyses. The resulting matrix turns out positive definite. Table 3 contains the estimated heritabilities of the traits on the diagonal, the phenotypic correlations above, and the genetic corre-lations below the diagonal. The values show that the genetic and the phenotypic
correlations between all combinations of female traits do not differ much from each other.
Slightly lower genetic and phenotypic correlations between BWF and FI were observed by Pauw et al. (1986) in White Leghorn hens. The heritabilities of the traits given are in the upper range of published estimates. This may partly be a consequence of the model and the estima-tion procedure employed. The heritability of BWM turned out slightly higher than the estimate for BWF. The genetic correla-tion between these two traits, although high, is substantially lower than 1.0; therefore, strongly indicating a genetic difference between the two traits. This observation is supported by a difference between the genetic standard deviation of the two traits, which is 45% higher for BWM than for BWF. The genetic correla-tions between BWM and EN, EW, and FI were all in the same direction and of similar size as the corresponding correla-tions of BWF with EN, EW, and FI.
It is remarkable that such high genetic correlations between BWM and EW and FI were found. From an analysis of full-sib means, Hagger and Abplanalp (1988) found a correlation between BWM and EW of .47 in an experimental flock of White Leghorns with large eggs. For combinations of residual feed intake of either cocks or hens with other traits of hens, Tixier-Boichard et al. (1992) also observed different signs for some of the corresponding pairs of genetic correla-tions. In such a case, including a male trait into a selection criterion, say an index, but using the same parameters as for the analogous female trait could lead to a cancellation of selection responses or even
TABLE 1 Means and phenotypic (sx) and genetic (<7X) standard deviations of egg number (EN), egg
weight (EW), and feed intake (FI) until 40 wk, and body weight of 8,844 females (BWF) and of 1,138 males (BWM) at 40 wk Statistical parameter EN EW FI BWF BWM 118.5 12.65 6.91 (g) 59.9 4.56 3.58 15.9 1.41 1.20 (kg) 2.30 .264 .234 3.43 .375 .339
TABLE 2. Genetic (co)variances of egg number (EN), egg weight (EW, grams), feed intake (FI, kilograms), female body weight (BWF, kilograms) and male body weight (BWM, kilograms)
EN EW FI BWF BWM EN EW FI BWF BWM 47.8 -6.61 2.36 -.0585 -.362 12.8 1.65 .246 .383 1.44 .220 .254 .0546 .0666 .115
drive a trait in an undesired direction. If, on the o t h e r h a n d , the e s t i m a t e d parameters for each of the two analogous traits were used, the index weight for the male trait would get the opposite sign of that of the female trait. The estimated genetic correlation between BWM and the selection criterion of females, i.e., income minus feed cost, was -.032 (Hagger, un-published data). The corresponding corre-lation in hens was stronger, -.162, and caused a pronounced correlated genetic reduction in BWF (Hagger, 1992).
The magnitude of the correlations found between BWM and female traits strongly suggest that including the infor-mation on a male trait into their selection criterion would be worthwhile to improve sex-limited traits of hens. The expected increase of selection response from selec-tion of males either with or without including their own body weight into the selection criterion was investigated by application of selection index theory. Indi-ces Ij for males were calculated for one female trait at a time using the means of five full-sisters and of three half-sister groups of five full-sisters each. For indices I2, the body weight of the selection candidates was also taken into account. The influence of the size of the genetic
correlation between BWM and the traits of females could be investigated also because different genetic correlations were found for the different combinations of the traits.
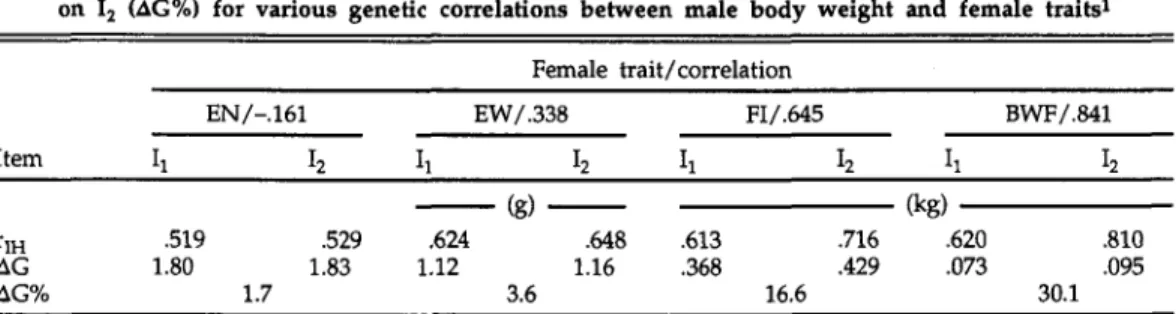
The parameters given in Tables 2 and 3 and a standardized selection differential of i = 1.0 were used for the calculations. Table 4 contains the correlations between the true and the estimated breeding values, rM / and the expected genetic changes in the female traits (AG) from selection of cocks on either of the two indices. From the results it is obvious that the additional genetic gains from selection on index I2 relative to the gains from selection on index lt are closely related to the genetic correlation between BWM and the traits of hens. With a genetic correla-tion of .338 (Table 4), as observed between BWM and EW, the relative additional gain in EW from selection of cocks only would be 3.6%, an increase that could be achieved with very little additional input, i.e., only taking once the body weight of cocks. For trait combinations with higher correlations, the additional gain increases substantially, but in all cases due to the same additional input. These calculations could be done for multitrait indices in the same way, but then economic weights would be needed for the traits in the
TABLE 3. Heritabilities (diagonal), phenotypic (above diagonal), and genetic (below diagonal) correlations of egg number (EN), egg weight (EW), feed intake (FI), female body weight (BWF)
and male body weight (BWM)
EN EW FI BWF BWM EN .292 -.267 .279 -.036 -.161 EW -.160 .754 .391 .294 .338 FI .330 .343 .682 .787 .645 BWF -.018 .241 .737 .732 .841 BWM -.077 .252 .466 .639 .790
TABLE 4. Correlation between true and estimated breeding values (rIH) of cocks for an index of full- and half-sister information (I-,) or for an index of full- and half-sister information
and own body weight (I2), expected selection responses in female offspring (AG) with
standardized selection differential i = 1, and relative superiority of selection on I2 (AG%) for various genetic correlations between male body weight and female traits1
Female trait/correlation
EN/-.161 EW/.338 FI/.645 BWF/.841
Item Ij I2 Ij I2 Ii I2 Ii I2
(g) (kg)
rI H .519 .529 .624 .648 .613 .716 .620 .810
AG 1.80 1.83 1.12 1.16 .368 .429 .073 .095 AG% 1.7 3.6 16.6 30.1
JEN = egg number; EW = egg weight; FI = feed intake; and BWF = female body weight.
aggregate genotype and they would in-fluence the results. The relative increase in selection response due to including male body weight into the male selection criterion would increase with decreasing numbers of available full- and half-sister available records. The amount of informa-tion on relatives could, therefore, be reduced to attain the same response as from selection on index Ia.
The expected additional genetic gains in Table 4 clearly show that taking the body weight of cocks and including this information into the selection procedure would be a means to improve the effi-ciency of a layer breeding scheme, once the necessary correlations of trait combi-nations between sexes are available. In this particular case, taking the same relation-ships between body weight of cocks and traits of hens as between body weight of hens and other traits of hens would probably not harm the selection decisions too much because the genetic correlation between both weights is high and the correlations to the other traits are in the same direction and of similar magnitude. However, if these relationships are clearly different, as found by Tixier-Boichard et al. (1992) for other traits, then using the same relationships for equivalent male and female traits to other female traits (Katie, 1992) would not be advisable. Therefore, it seems to be essential that correlations between male and female traits be esti-mated from adequate sets of data before traits of males can safely be included into
their selection indices to improve traits of females. Taking body weight of cocks would not be expensive. Justification for measurement of more expensive traits on cocks, e.g., feed consumption, needs fur-ther investigation. This problem has been studied by Katie (1992), but analogous traits of males and females were treated as the same trait.
ACKNOWLEDGMENTS
The excellent technical assistance of D. Steiger-Stafl and the continuous support of G. Stranzinger are gratefully ac-knowledged.
REFERENCES
Bordas, A., M. Tixier-Boichard, and P. Merat, 1992. Direct and correlated responses to divergent selection for residual food intake in Rhode Island Red laying hens. Br. Poult. Sci. 33: 741-754.
Falconer, D. S., 1982. Introduction to Quantitative Genetics. 2nd ed. Longman, London, England, and New York, NY.
Foulley, J. L., and L. Ollivier, 1986. A note on criteria of coherence for the parameters used to con-struct a selection index. J. Anim. Breed. Genet. 103:81-86.
Hagger, C., 1990. Response from selection for income minus food cost in laying hens, estimated via the animal model. Br. Poult. Sci. 31:701-713. Hagger, C., 1992. Two generations of selection on
restricted best linear unbiased prediction breed-ing values for income minus feed cost in laybreed-ing hens. J. Anim. Sci. 70:2045-2052.
Hagger, C., and H. Abplanalp, 1988. Selection with restriction in a poultry breeding scheme with different selection procedures in both sexes: Direct responses. Br. Poult. Sci. 29:251-263.
Hayes, J. F., and W. G. Hill, 1980. A reparametriza-tion of a genetic selecreparametriza-tion index to locate its sampling properties. Biometrics 36:237-248. Hayes, J. F., and W. G. Hill, 1981. Modification of
estimates of parameters in the construction of genetic selection indexes ("bending"). Biomet-rics 37:483-493.
Katie, J., 1992. Genetic and economic consequences of including residual food consumption in a multi-trait selection program for laying hens. Acta Agric. Scand. 42:63-70.
Katie, J., and N. Kolstad, 1992. Residual food consumption recorded on cocks from egg-laying strains. Proceedings XIX World's Poultry Con-gress, Amsterdam, September 20-24, Vol. 2: 206.(Abstr.)
Meyer, K., 1991. Estimating variances and covari-ances for multivariate animal models by re-stricted maximum likelihood. Genet. Sel. Evol. 23:67-83.
Mielenz, N., and M. Wagenknecht, 1992. Korrektur von geschatzten Varianz-Covarianz-Matrizen durch Optimierung im Raum der positiv
definiten Matrizen. Arch. Tierz. Dummerstorf 35:611-618.
Patterson, H. D., and R. Thompson, 1971. Recovery of interblock information when block sizes are unequal. Biometrika 58:545-554.
Pauw, R., J. Petersen, and P. Horst, 1986. Comparison of several indicators of food conversion effi-ciency in laying hens from genetic point of view. Pages 104-108 in: Proceedings VII Euro-pean Poultry Conference, Vol. 1. Paris, August 24-28. M. Larbier, ed. Tours, France.
Quaas, R. L., and C. R. Henderson, 1976. Selection criteria for altering the growth curve. J. Anim. Sci. 43:221.(Abstr.)
Quaas, R. L., and E. J. Pollak, 1980. Mixed model methodology for farm and ranch beef cattle testing programs. J. Anim. Sci. 51:1277-1287. Tixier-Boichard, M., D. Boichard, A. Bordas, and E.
Groeneveld, 1992. Genetic parameters of residual feed intake in adult males and females from a layer Rhode Island Red population. Proceedings XIX World's Poultry Congress, Amsterdam, September 20-24. Vol. 2: 209.(Abstr.)