HAL Id: hal-02130681
https://hal.archives-ouvertes.fr/hal-02130681
Submitted on 16 May 2019
HAL is a multi-disciplinary open access
archive for the deposit and dissemination of
sci-entific research documents, whether they are
pub-lished or not. The documents may come from
teaching and research institutions in France or
abroad, or from public or private research centers.
L’archive ouverte pluridisciplinaire HAL, est
destinée au dépôt et à la diffusion de documents
scientifiques de niveau recherche, publiés ou non,
émanant des établissements d’enseignement et de
recherche français ou étrangers, des laboratoires
publics ou privés.
navigate between two topographic styles?
Jérémie Ory, Guillaume Touya, Charlotte Hoarau, Sidonie Christophe
To cite this version:
Jérémie Ory, Guillaume Touya, Charlotte Hoarau, Sidonie Christophe. How to design a cartographic
continuum to help users to navigate between two topographic styles?. International Cartographic
Conference, Jul 2017, Washington, DC, United States. �hal-02130681�
How to design a cartographic continuum to help users to navigate
between two topographic styles?
Jérémie Ory,1 Guillaume Touya,1 Charlotte Hoarau,1 and Sidonie Christophe1
1. Univ. Paris-Est, LASTIG COGIT, IGN, ENSG, F-94160 Saint-Mandé, France ; [email protected]
Abstract: Geoportals and geovisualization tools provide to users various cartographic abstractions that describe dif-ferently a geographical space. Our purpose is to be able to design cartographic continuums, i.e. a set of in-between maps allowing users to navigate between two topographic styles. This paper addresses the problem of the interpola-tion between two topographic abstracinterpola-tions with different styles. We detail our approach in two steps. Firstly, we set-up a comparison in order to identify which structural elements of a cartographic abstraction should be interpolated. Secondly, we propose an approach based on two design methods for maps interpolation.
Keywords: geovisualization, cartographic continuum, topographic style, interpolation, map design, perception and cognition
1. Introduction and problems statement
The last two decades, next to the traditional maps producers, i.e. National Mapping Agencies from different countries, new maps producers gradually emerged: Google Maps, OpenStreetMap (OSM), Stamen, MapBox and so on. This diversification of maps producers naturally leads to the multiplication of cartographic abstractions with a different cartographic content and a particular visual appearance defined as a topographic style (Kent and Vuja-kovic, 2009; Jolivet, 2009; Beconyte, 2011; Christophe, 2012; Ory et al., 2015). These various cartographic abstrac-tions are provided to users in geovisualization applicaabstrac-tions in order to respond to theirs uses (Ruas, 2006; Bucher et al., 2007; Mericksay, 2011; Griffin and Fabrikant, 2012; Lafay et al., 2015; amongst others). According to their us-es, needs and preferencus-es, users switch from a cartographic abstraction to another. In this context, one of the major challenges consists in proposing innovative visualization methods to smooth and improve the navigation between two different cartographic abstractions with various styles on a geoportal.
We propose to design cartographic continuums, i.e. a set of in-between maps enabling users to navigate between two topographic styles. An important issue of this work is to define a method to design a continuum composed of in-between cartographic abstractions mixing two topographic styles. In this paper, we aim at identifying which struc-tural elements of a cartographic abstraction should be interpolated and how to design them to get a relevant carto-graphic continuum.
In the following, Section 2 provides the related work. In Section 3, we detail our approach to identify which structural elements of a map should be interpolated and how to design them in a cartographic continuum to navigate between two topographic styles.
2. Related work
Designing cartographic continuums between two topographic styles relate to several parts of map design: data matching, generalization, legend specifications and so on. This section describes some research that we believe to be closely related to our problems.
2.1 Characterizing discontinuities between various cartographic abstractions
To optimize the multi-scale navigation, Dumont et al. (2015) identify different sources of user disorientation such as symbolization and content discontinuities. The Figure 1 illustrates the symbolization discontinuities between three various topographic abstractions at the same scale depicting the same geographical space: Zürich in Switzer-land. According to the topographic map visualized, the salient objects seem different. On Google Maps representa-tion (A) the hydrologic surfaces seems the most salient objects. On OpenStreetMap (B) representarepresenta-tion the road net-work seems the most salient objects and on the Swisstopo representation (C) the buildings seems the most salient objects. These symbolization disparities are based on the legend specification choices, such as color, line width, tex-ture and so on (Jolivet, 2009, Kent and Vujakovic, 2009, Christophe, 2012, Ory et al., 2013).
Fig. 1. Three various topographic abstractions at the same scale: (A) Google Maps, (B) OpenStreetMap, (C) Swisstopo – (Dumont et al.,
2015).
ICC 2017: Proceedings of the 2017 International Cartographic Conference, Washington D.C. 3
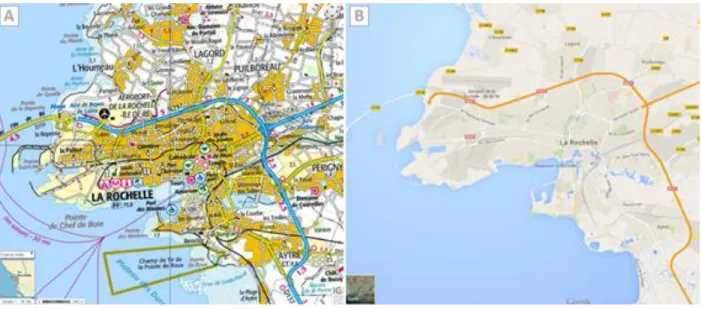
The Figure 2 illustrates the content discontinuities between two topographic abstractions, IGN-France (A) and Google Maps (B), which depicted the same geographical space: La Rochelle in France. A simplification of the level of details from the IGN-France to the Google Maps implies different map contents for the same displayed scale.
These symbolization and content discontinuities should be managed by a relevant approach to design a carto-graphic continuum between two topocarto-graphic abstractions.
2.2 Characterizing a topographic style
Ory et al. (2015) formalize the concept of a topographic style as a cartographic family with a visual signature composed of graphic signs perceived and recognized by users. From the results of a user study, Ory (2016) charac-terize two levels of a visual signature for IGN-France topographic style. The Figure 3 illustrates two levels of a vis-ual signature. The graphic signs content in the level (A) are both perceived and memorized by participants. The graphic sign content in level (B) are only perceived by participants. Ory (2016) relies on these two levels of visual signature to produce topographic maps with a recognizable style by users.
Fig. 3. (A) 1:25000 IGN-France topographic map, (B) 1st level of visual signature, (C) 2nd level of visual signature - (Ory, 2016).
The knowledge on the graphic signs recognized by users and the visual signature of a topographic style should be managed to design a cartographic continuum between two topographic styles.
2.3 Design method of the interpolation between vector data and orthoimage
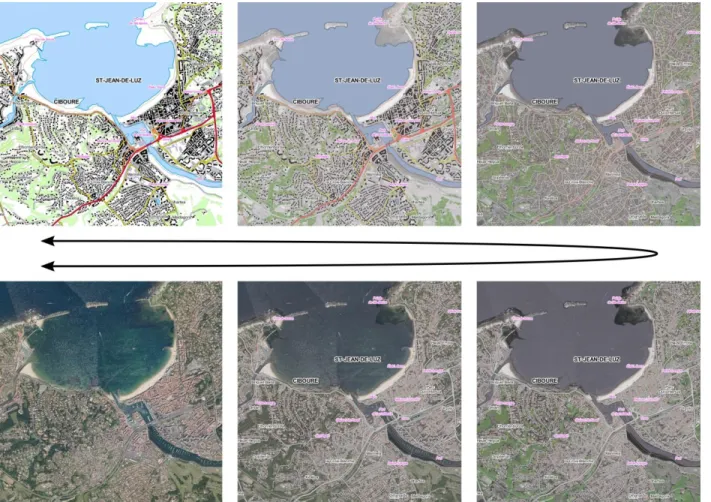
Hoarau and Christophe (2016) propose a global rendering method to mix efficiently topographic vector data and orthoimages. This method is based on natural appearance extraction, color and texture interpolation, and the control of the realism and abstraction levels, allowing to design a cartographic continuum composed of several in-between representations. The Figure 4 illustrates a cartographic continuum between a vector data set with IGN-France topo-graphic style and an orthoimage. The legibility of cartotopo-graphic objects is preserved all along the continuum, provid-ing efficient covisualizations of the two representations to the user. The cartographic continuum allows users to smoothly navigate between two different representations of a geographical space, or to stop on a legible and effec-tive in-between representation.
Fig. 4. Cartographic continuum between a topographic vector data with IGN-France style and an orthoimage based on method design
proposed by Hoarau and Christophe (2016).
2.3 Research challenges
From this related works, we take up three different challenges to successfully design a cartographic continuum between two topographic styles:
1. The transitions between consecutive in-between cartographic abstractions in the continuum should be ensuring continuity and smoothness during the navigation.
2. The two original topographic styles have to be recognized throughout the navigation in the cartographic con-tinuum.
3. The legibility of the different cartographic objects (e.g. color contrast) has to be preserved for each in-between representation.
To reach the three research challenges, we aim at identifying which structural element of a topographic map should be interpolated and how to design them on in-between representations, in order to get a relevant and efficient cartographic continuum between two topographic styles.
ICC 2017: Proceedings of the 2017 International Cartographic Conference, Washington D.C. 5
3. An exploratory approach to design a cartographic continuum between two topographic
styles
In this section, we detail our exploratory approach to design a cartographic continuum between two topographic styles: IGN-France and OSM standard Mapnik style. Our approach is declined two steps:
1. Identification of structural elements of the maps which should be interpolated.
2. Proposition of methods to design in-between representations for these structural elements.
3.1 A comparison method to identify the structural elements of a map which should be
interpolated
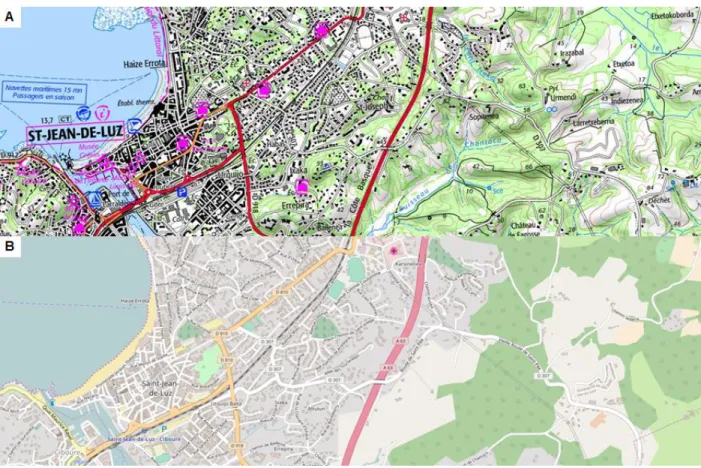
We select two topographic maps, a first one produced by the French NMA IGN-France illustrated by the Figure 5.A, a second one produced by OSM illustrated by the Figure 5.B. The two topographic maps depict the same geo-graphic context at the same scale: a French territory, St-Jean-de-Luz at the 1:25000 scale. Based on our knowledge on map design, we propose to visually compare with a systematical approach two map design processes: data selec-tion and legend specificaselec-tions, layer per layer, from the map A to the map B. We do not focus on other cartographic processes, such as data categorization or generalization for the sake of simplicity. To summarize, our approach con-sists in visually comparing two topographic maps, to analyze how they are designed and to identify some structural element which should be interpolated.
This comparison provides us a graphic detailed insight of two topographic styles. We observe particularly some dif-ferences allowing us to identify six kinds of maps structural elements should be interpolated. We group them into two categories:
1. The data selection
The Figure 6 illustrates the two maps structural elements, belonging data selection, identified by the visual com-parison of the two topographic styles IGN-France and OpenStreetMap:
– Shading: shaded is a major cartographic theme in the IGN-France maps while is not represented in the OSM
maps, as illustrated in Figure 5.
– Additional vector data: the IGN-France maps contain more cartographic themes than the OSM maps, as
contour lines and the intermittent streams illustrated by the Figure 5.
2. The legend specifications
The Figure 7 illustrates the four maps structural elements, belonging legend specifications, identified by the visu-al comparison of the two topographic styles IGN-France and OpenStreetMap:
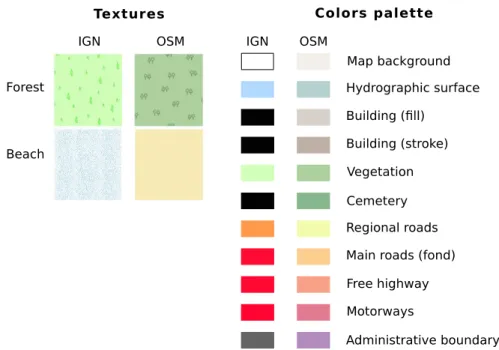
– Color: the two maps producers use two different color palettes to design the various cartographic themes.
Each color palette is illustrated on Figure 6.
– Texture: different kinds of texture are used by the two producers use to design cartographic objects
belong-ing land use. The textures used to design forests and beaches are illustrated on Figure 6.
– Line width: the two maps producers use different specifications of line width to design the cartographic
line-ar objects, such as roads network illustrated by Figure 5.
– Labelling style: the two maps producers use different typography specifications to design the labels, as
ICC 2017: Proceedings of the 2017 International Cartographic Conference, Washington D.C. 7
Fig. 6. Differences of texture and color specifications between IGN-France and OSM maps.
According to the first results, our approach seems relevant to identify structural elements of a map which should be interpolated. We have to notice that the results are dependent on the two topographic styles analyzed. It would be interesting to compare others topographic styles with the same approach to see if the structural elements are similar or different.
3.2 Methods to design in-between cartographic representations
In this section, we propose to use design methods to interpolate each structural element identified in the previous sub-section. The design methods have to comply with the research challenges briefly exposed in the sub-section 2.4, namely:
1. to ensure a smooth transition all along the cartographic continuum, 2. to allow users to recognize topographic style’s sources,
3. to ensure legibility of cartographic objects.
From the literature, we identified two methods allowing us to design in-between representations of a cartographic continuum:
1. A linear interpolation method: this method is used to define color specifications of each in-between carto-graphic representation.
2. An arithmetic progression method: this method is used to define for each in-between cartographic represen-tation (1) line width specifications for the linear cartographic themes, (2) level of transparency of shading and (3) level of transparency of additional vector data, such as contour lines and intermittent streams.
Following the recommendation of a past research (Ory, 2015), we propose to keep the original textures and typogra-phy of the two topographic styles sources all along the cartographic continuum. Indeed, texture and typogratypogra-phy are visual codes and guides, well known by the users, allowing them to recognize the two cartographic families of the continuum extrema. We think that keeping original textures and typography improve the user navigation between the two topographic styles. In the middle of the cartographic continuum, we propose to switch sharply from the tex-tures of style A to the textex-tures of style B. We adopt the same approach for the typography.
3.3 First results
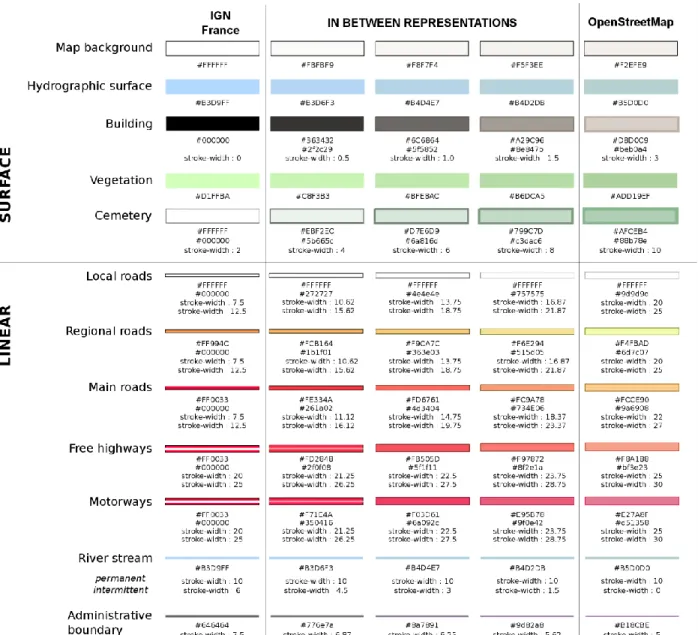
We apply the two design methods explained in the previous sub-section on 1:25000 IGN cartographic vector da-taset, which depicts a French geographical space St-Jean-Luz. For this vector dada-taset, we define legend specifica-tions of two topographic styles: IGN-France and OSM. The legend specificaspecifica-tions are defined with the SLD/SE standard.
In this use case, we use the two design methods to interpolate color and the line width. We use the linear interpo-lation method to define the color specifications and we use the arithmetic method to define the line width specifica-tions. The Figure 7 illustrates the results obtained for various cartographic themes: hydrographic surface, building, vegetation, cemetery, roads network, river stream and administrative boundary, further we add the map background. In this example, we define three in-between representations to navigate from IGN-France style to OpenStreetMap style.
Fig. 7. Color and stroke-width specifications of surface and linear cartographic themes to interpolate IGN-France style to
ICC 2017: Proceedings of the 2017 International Cartographic Conference, Washington D.C. 9
We produce all in-between cartographic abstractions on our open source platform, GeOxygene (https://ignf.github.io/geoxygene/community/index.html).
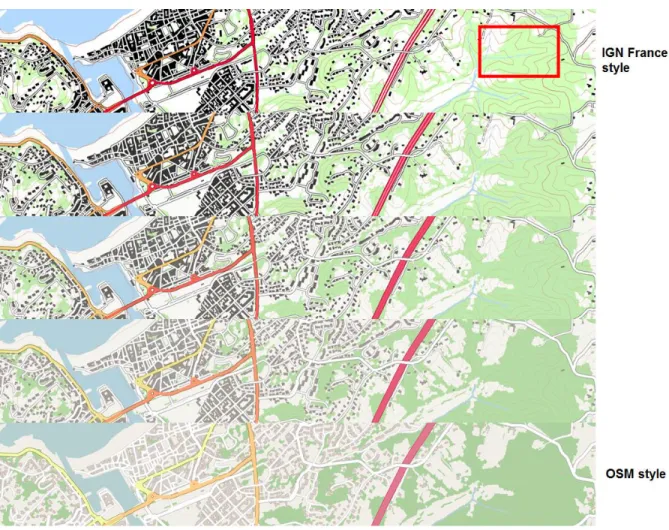
Fig. 8. Color and line width interpolation between IGN-France style and OpenStreetMap style.
The different in-between representations, illustrated by the Figure 8, constitute a cartographic continuum that al-lows users to have a smoothing navigation between IGN-France style and OSM style. Indeed, the visualization of color and line-width of the different cartographic themes are progressive all along the cartographic continuum. The methods allow the resolution of two issues:
1. Navigate between two cartographic styles which displayed differently the cartographic themes: for instance, color and width differences exist between IGN-France roads network and OSM roads network. These two methods allow sliding smoothly to one style to the second one, ironing out the color and width differences. 2. Navigate between two cartographic styles with different cartographic content: for instance, the contour lines
and the intermittent streams, outlined in red on Figure 8, are only displayed in the IGN-France style. These two methods allow to progressively hide a cartographic theme and thus to iron out the content differences between the two topographic styles.
4. Conclusion and outlook
This paper addresses the design of cartographic continuum to navigate between two topographic abstractions with different styles. We proposed an approach to define the best legend specifications to design each in-between repre-sentation: first, we identify the major structural elements of a map which should be interpolated; then, we propose two design methods to interpolate each structural element to produce in-between representation.
In future research, we hope to formalize our proposition in a framework allowing the automatic design of carto-graphic continuum between various topocarto-graphic styles. A first research perspective is to measure the similarities and the difference between in-between representations to assess the quality of a cartographic continuum. A second re-search perspective issue is the improvement of color interpolation with the specification of some constraints to im-prove the global legibility of the map, by preserving, for instance, the color contrasts between map features. A third research perspective issue is to measure a “global distance” between two topographic styles in order to define how many in-between representations needs to design the best cartographic continuum. Finally, it will be necessary to as-sess the efficiency of a cartographic continuum to achieve some user visual tasks.
Acknowledgements
This work is supported by the French National Research Agency, as part of the MapMuxing project [ANR-14-CE24-0011-01].
References
Beconyte, G. (2011) Cartographic styles: criteria and parameters, In Proc. 25th International Cartographic Conference (ICC’11), 3-5 Ju-ly, Paris, France.
Bucher, B., Jolivet, L., Buard, E. and Ruas, A. (2007). ‘The need for web legend services’, in 7th International Symposium on Web and Wireless GIS (W2GIS), Lecture Notes in Computer Science, Springer ed. by Ware, J. M. and Taylor, G. E., pp. 44–60.
Christophe, S. (2012) Cartographic Styles between traditional and original (towards a cartographic style model), In proceedings of Au-toCarto Conference 2012, 16-18 September, Columbus, Ohio, USA.
Dumont, M., Touya, G., Duchêne, C. (2015), Automated Generalisation of Intermediate Levels in a Multi-Scale Pyramid, In proceedings of 18th ICA Workshop on Generalisation and multiple Representation , August 2015, Rio de Janeiro, Brazil
Hoarau C., Christophe S. (2016). Cartographic continuum rendering based on color and texture interpolation to enhance photo-realism perception, ISPRS Journal of Photogrammetry and Remote Sensing (volume in press)
Jolivet, L. (2009) Characterizing maps to improve on-demand cartography - the example of European topographic maps, 17th Confer-ence on GISciConfer-ence and Research in UK (GISRUK'09), 1-3 April, Durham (UK).
Kent, A. & Vujakovic, P. (2009) Stylistic Diversity in European State 1:50 000 Topographic Maps, The Cartographic Journal, 46(3), 179-213.
Lafay S., Braun, A., Chandler, D., Michaud, M., Ricaud, L., Mustière, S. (2015). Automatic mapping and innovative on-demand map-ping services at IGN France. CaGIS - Cartography and Geographic Information Science, 42(1), 54-68.
Mericskay, B. (2011). Les SIG et la cartographie à l'ère du géoweb. L’Espace géographique, 40(2), 142-153.
Ory J., Christophe, S., Fabrikant, S.I., Bucher, B. (2015). How do map readers recognize a topographic mapping style?, The Cartograph-ic Journal, 52(2), 193-203.
Ory J. (2016). Connaissances pour la conception et la perception de styles topographiques, Phd thesis in Geographic Information Sciences, Paris-Est University, IGN, LaSTIG lab., COGIT team.
Griffin, A., et Fabrikant, S.I. (2012). More maps, more users, more devices means more cartographic challenges. The Cartographic Jour-nal, 49(4), 298-301.