HAL Id: tel-01722958
https://pastel.archives-ouvertes.fr/tel-01722958
Submitted on 5 Mar 2018HAL is a multi-disciplinary open access archive for the deposit and dissemination of sci-entific research documents, whether they are pub-lished or not. The documents may come from teaching and research institutions in France or abroad, or from public or private research centers.
L’archive ouverte pluridisciplinaire HAL, est destinée au dépôt et à la diffusion de documents scientifiques de niveau recherche, publiés ou non, émanant des établissements d’enseignement et de recherche français ou étrangers, des laboratoires publics ou privés.
To cite this version:
Virginie Boutueil. Towards a sustainable mobility system : leveraging corporate car fleets to foster innovation. Architecture, aménagement de l’espace. Université Paris-Est, 2015. Français. �NNT : 2015PESC1203�. �tel-01722958�
Towards a sustainable mobility system:
Leveraging corporate car fleets to foster innovations
PhD. thesis
Virginie Boutueil
Supervised by Fabien Leurent
Soutenue le 21 septembre 2015
The mobility system in France faces increasing sustainability challenges. In response, French public authorities have endeavoured to foster innovation in the mobility system, with a particular focus on the automotive subsystem, where the challenges are most acute.
Corporations have a special position in the mobility system: their decisions influence mobility behaviours well beyond corporate mobility patterns alone. Every year in France, 4 out of 10 new light-duty vehicles (including passenger cars and light commercial vehicles) are sold to corporations. Yet, corporate mobility in general, and corporate car fleets in particular, are still blind spots in the collective understanding of the mobility system. The main contribution of our work is to demonstrate that, given their effects on the larger mobility system, and given their sensitivity to public policies, corporate car fleets are a relevant object for research and a relevant matter for public policy discussion.
Our research is a multi-method investigation, collecting information from a wide range of sources, including professional journals and legal archives, and cross-checking quantitative results on the composition and use patterns of corporate car fleets from large mobility surveys in France against qualitative insights gained from an exploratory survey of fleet managers in the Paris region. We develop a set of definitions and analytical frameworks for investigating corporate car fleets, including a typology of vehicles based on the various levels of ‘rights’ granted to the employee over the vehicle. We show that corporate car fleets could account for 15% of the total light-duty vehicle fleet in France, 25% of its total mileage and 25% to 30% of its CO2 emissions.
We also reveal the instrumental role that corporate car fleets can play in setting new trends for France’s global vehicle stock. We highlight that the day-to-day patterns of use of corporate vehicles are highly diverse, and partly compatible with electric vehicles. Finally, we show that tax policies have significant effects on the dynamics of the spread of innovations in corporate car fleets.
We discuss the implications of these results for policy-making and stress the need for further integration between industrial policies, transport policies, and tax policies. We further emphasise the need for greater coordination between the various levels of government, and for adequate phasing of public policies. At present, more transparency is needed about how long current ‘initiating’ policies (e.g. purchase bonus) will last, and how strong the ‘supporting’ policies (e.g. low-emission zones) will be in the medium- to long-term.
Pour relever les défis grandissants auxquels est confronté le système de mobilité en termes de durabilité, les autorités publiques françaises ont entrepris de soutenir l’innovation, notamment dans le domaine automobile.
Les entreprises occupent une position particulière au sein du système de mobilité : leurs décisions influencent les comportements de mobilité bien au-delà des seuls déplacements professionnels. Chaque année en France, 4 véhicules légers sur 10 parmi les voitures particulières et véhicules utilitaires neufs mis sur le marché sont acquis par des entreprises. Pourtant, la mobilité professionnelle en général, et les flottes automobiles d’entreprise en particulier, demeurent des
zones d’ombre de la connaissance du système de mobilité. L’objet de notre travail et sa contribution principale est de démontrer que, compte tenu de leurs effets sur l’ensemble du système de mobilité d’une part, de leur sensibilité aux politiques publiques d’autre part, les flottes automobiles d’entreprise constituent un objet pertinent tant pour la recherche que pour l’action publique.
Notre investigation s’appuie sur des méthodes multiples : outre une synthèse de sources bibliographiques variées (journaux professionnels, archives légales, etc.), nous proposons des recoupements originaux entre, d’une part, des données quantitatives sur la composition et l’usage des flottes automobiles d’entreprise issues d’enquêtes de grande envergure et, d’autre part, les résultats qualitatifs d’une enquête exploratoire menée auprès de gestionnaires de flotte en région parisienne.
Nous développons un ensemble de définitions et de cadres analytiques pour étudier les flottes automobiles d’entreprise, et notamment une typologie de véhicules basée sur les différents niveaux de « droits » accordés à l’utilisateur du véhicule d’entreprise. Nous montrons que les flottes automobiles d’entreprise totalisent 15% de l’ensemble des véhicules légers en France, 25% de leur kilométrage et 25% à 30% de leurs émissions de CO2.
Par ailleurs, nous révélons le rôle essentiel que peuvent jouer les flottes automobiles d’entreprise pour amorcer des changements dans le parc automobile français. Nous montrons que les usages quotidiens des véhicules d’entreprise sont très divers, et dans certains cas compatibles avec les véhicules électriques. Enfin, nous mettons en évidence les effets tangibles des politiques fiscales sur la dynamique de diffusion des innovations au sein des flottes automobiles d’entreprise.
Nous examinons les implications de ces résultats en termes de politiques publiques, en soulignant le besoin d’une plus grande intégration entre politiques
industrielles, politiques de transport et politiques fiscales. Nous mettons en particulier en évidence le besoin d’une coordination accrue entre les politiques publiques menées à différentes échelles et d’un phasage approprié de ces politiques. Dans le contexte actuel, une plus grande transparence semble requise quant à la pérennité des mesures d’ « amorçage » (par exemple, le bonus à l’achat) et au volontarisme des mesures de « soutien » (par exemple, les zones à basses émissions) qui pourraient être adoptées à moyen ou long terme.
List of tables ... 11
List of figures ... 15
Introduction ... 17
Part I Corporate players in a sustainable mobility system
23
Chapter 1 Sustainability issues in transport: A French public-policy
perspective ... 25
1.1 Introduction ... 25
1.2 Transport-related activities in the economy ... 28
1.3 Monitoring the negative impacts of mobility ... 36
1.4 Balancing the funding equation ... 54
1.5 Innovating towards sustainability ... 61
1.6 Conclusion ... 67
Chapter 2 Corporate mobility: The physical and financial flows at
stake, the management tools at hand ... 69
2.1 Introduction ... 69
2.2 Corporate mobility in the literature ... 73
2.3 Companies and the funding of mobility other than their own ... 88
2.4 Corporate mobility management, from theory to practice ... 95
2.5 Conclusion ... 106
Part II The nature and features of corporate car fleets
111
Chapter 3 Corporate car fleets: Key definitions and issues ... 113
3.1 Introduction ... 113
3.2 Key definitions... 117
3.3 Some facts and figures on corporate car fleets in France ... 131
3.5 Some insights into the external costs of corporate car fleets ... 150
3.6 Conclusion ... 162
Chapter 4 Corporate vehicles held by private households ... 165
4.1 Introduction ... 165
4.2 Methodology: Our exploration of household travel surveys ... 169
4.3 What type of households hold corporate cars? ... 174
4.4 Some key features of corporate vehicles held by private households .... 185
4.5 Assessing the use of corporate vehicles by private households ... 190
4.6 Insights into the influence of corporate vehicles on mobility patterns.. 202
4.7 Conclusion ... 206
Chapter 5 Light commercial vehicles in corporate fleets ... 211
5.1 Introduction ... 211
5.2 Methodology: Our exploration of national ‘LCV surveys’ ... 218
5.3 Are LCVs an all-professional matter? ... 226
5.4 Key findings on LCV features and use patterns in corporate fleets ... 231
5.5 Insights into the effects of taxes on the LCV fleet: two case studies ... 246
5.6 Conclusion ... 257
Part III Driving change in corporate car fleets
259
Chapter 6 Fleet management and the adoption of innovations: An
exploratory approach ... 261
6.1 Introduction ... 261
6.2 Methodology for an exploratory investigation ... 265
6.3 Key findings on mobility and fleet management processes ... 278
6.4 Insights into the uptake of innovations by corporate car fleets ... 296
6.5 Conclusion ... 304
Chapter 7 The role of taxes in triggering change in corporate car
fleets: Some lessons from history ... 311
7.1 Introduction ... 311
7.2 Have corporate car fleets always preferred diesel over petrol?... 316
7.3 The early incentives for clean vehicles in vehicle registration taxes ... 326
7.4 The key role of TVS in driving down CO2 emissions ... 333
7.5 The bonus/malus scheme: A complex, but powerful, instrument ... 340
7.6 Summary and discussion ... 351
7.7 Conclusion ... 357
Chapter 8 Opportunities and challenges for innovations in
corporate car fleets: Trends, prospects and policy implications ... 361
8.1 Introduction ... 361
8.3 Benefits expected from the adoption of EVs by corporate car fleets ... 373 8.4 Short-term prospects for car-sharing in corporate fleets ... 385 8.5 Barriers and disincentives to innovation and the role of public policies 389 8.6 Conclusion ... 396
Conclusion ... 401
Annex ... 409
Annex A – The European legislative framework for action against local air pollution caused by motor vehicles ... 411 Annex B – The European legislative framework targeting CO2 emissions
from light-duty vehicles ... 415 Annex C – Research programmes on mobility management funded by the European Union ... 416 Annex D – Company-car fringe benefit taxation in France ... 418 Annex E – The French legal framework for calculating the taxable
horsepower of vehicles ... 420
Bibliography ... 423
Abbreviations ... 481
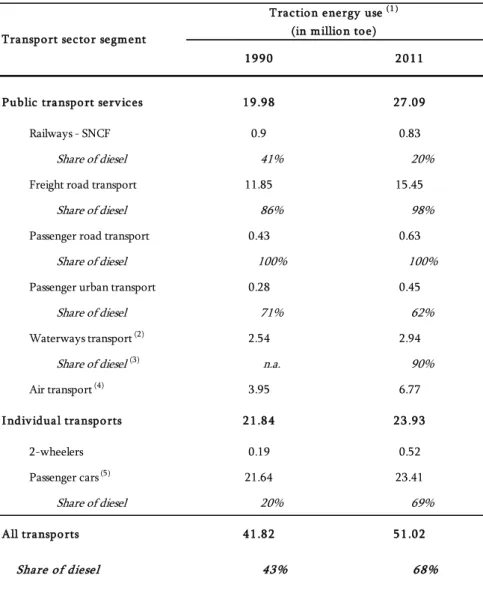
Table 1.1: Contribution of the transport industry to French national output (INSEE, 2013a) ... 31 Table 1.2: Output of passenger and freight transport services in 2011 (SOeS, 2013a) ... 31 Table 1.3: Number of companies in passenger and freight transport
services in 2011 (SOeS, 2013e) ... 32 Table 1.4: Wage employment in the transport industry (INSEE) ... 35 Table 1.5: Wage employment in the transport and storage sector (SOeS, 2013e) ... 35 Table 1.6: Final energy use in transport (SOeS, 2013i) ... 38 Table 1.7: Traction energy use by segment of the transport sector (SOeS, 2013a) ... 40 Table 1.8: Air pollutants and greenhouse gas emissions from transport (CITEPA, 2013) ... 42 Table 1.9: Greenhouse gas emissions by transport mode (CITEPA, 2013; SOeS, 2013j) ... 48 Table 1.10: Road accidents, injuries and fatalities (INSEE, 2013c) ... 51 Table 2.1: Distribution of urban public transport funds by source (GART, 2005 and 2014) ... 92 Table 3.1: New vehicle registrations by corporate car fleets in France for French and foreign car makers (L’Automobile&L’Entreprise, 2013)... 138 Table 3.2: The share of professional LCVs in total CO2 emissions from
light-duty vehicles (CGDD, 2011; Breteau and Léglise, 2013) ... 160 Table 4.1: Share of corporate vehicles in the overall vehicle fleet and in the overall automobile mileage of private households (2010 EGT survey, 2007-2008 ENTD survey) ... 171 Table 4.2: Corporate and private vehicles at households’ disposal in the Paris region (2010 EGT survey) ... 172 Table 4.3: Penetration rates of corporate vehicles in private household fleets (2010 EGT survey) ... 175 Table 4.4: Differences in the penetration rates of corporate vehicles across area types (2010 EGT survey) ... 181 Table 4.5: Motorisation rates and proportions of multi-vehicle households for different household populations (2010 EGT survey) ... 182 Table 4.6: Differences in the penetration rates of corporate vehicles across socio-occupational categories (2010 EGT survey) ... 183
Table 4.7: Basic fleet characteristics discriminating between corporate and private vehicles (2010 EGT survey) ... 185 Table 4.8: Share of diesel-powered vehicles by age class for corporate and private vehicles (2010 EGT survey) ... 189 Table 4.9: Motorisation mixes of corporate and private vehicles (2010 EGT survey) ... 189 Table 4.10: Basic indicators of daily vehicle use for corporate and private vehicles (2010 EGT survey) ... 192 Table 4.11: Volume of automobile trips for various vehicle categories (2010 EGT survey) ... 193 Table 4.12: Distance, duration and speed distributions of households automobile trips for various vehicle categories (2010 EGT survey) ... 194 Table 4.13: Time and space distribution of households automobile trips for various vehicle categories (2010 EGT survey) ... 195 Table 4.14: Trip purposes for various vehicle categories (2010 EGT survey) ... 197 Table 4.15: Average trip distance by trip purpose for various vehicle categories (2010 EGT survey)... 199 Table 4.16: Vehicle occupancy rates for various vehicle categories (2010 EGT survey) ... 200 Table 4.17: Average vehicle occupancy rates by trip purpose for various vehicle categories (2010 EGT survey)... 201 Table 4.18: Two typical profiles of households holding a corporate vehicle (2010 EGT survey) ... 203 Table 5.1: An assessment of LCV fleet and LCV-related traffic in France over 1980-2010 (SOeS, 2011a) ... 213 Table 5.2: Development of new-LCV sales in France from 1980 to 2010 (CCFA, 2013 and previous) ... 214 Table 5.3: An increasing share of diesel-powered vehicles among LCVs in France (CCFA, 2013 and previous) ... 215 Table 5.4: Changes in the LCV survey methodology over time ... 219 Table 5.5: Developments in a selection of variables across the LCV surveys from 1981 to 2010, and influence of the changes in methodology (SOeS, LCV surveys) ... 223 Table 5.6: Number of LCVs in use by category of user (SOeS, LCV surveys) ... 227 Table 5.7: Distribution of professional LCVs across activity sectors (SOeS, 2010 LCV survey) ... 228 Table 5.8: LCV fleet-to-workforce ratios by activity sector (INSEE, 2011b; SOeS, 2010 LCV survey) ... 229 Table 5.9: New-LCV sales and fleet renewal rates for different user
Table 5.10: Distribution of LCVs across AGW categories for different user categories (SOeS, LCV surveys) ... 232 Table 5.11: Average age of LCVs by user category (SOeS, LCV surveys)233 Table 5.12: Distribution of total LCVs by vehicle body type (SOeS, LCV surveys) ... 236 Table 5.13: Detailed distributions of LCVs by vehicle body type for different user categories (SOeS, 2010 LCV survey) ... 237 Table 5.14: Diesel-powered LCVs for different user categories (SOeS, LCV surveys) ... 238 Table 5.15: Average annual mileage of LCVs for different categories of users (SOeS, LCV surveys) ... 240 Table 5.16: Distribution of LCV annual mileage across area types for different categories of users (SOeS, 2010 LCV survey)... 243 Table 5.17: Purposes of use of LCVs for different categories of users (SOeS, 2010 LCV survey) ... 244 Table 5.18: Market share of passenger-car derivatives in total LCVs by AGW category (SOeS, LCV surveys) ... 247 Table 5.19: Annual mileage distributions of ordinary vans and passenger-car derivatives (SOeS, LCV surveys) ... 249 Table 5.20: Average annual mileage of small ordinary vans and passenger-car derivatives for different user categories (SOeS, 2010 LCV survey) .. 250 Table 5.21: Average age of small ordinaryvans and passenger-car
derivatives for different user categories (SOeS, 2010 LCV survey) ... 251 Table 5.22: Average age of petrol LCVs and diesel LCVs for different categories of users (SOeS, 2010 LCV survey) ... 252 Table 5.23: Market share of diesel-powered LCVs in LCVs in use by AGW category (SOeS, LCV surveys) ... 253 Table 5.24: Average annual mileage of diesel and petrol LCVs for different user categories (SOeS, 2010 LCV survey) ... 254 Table 5.25: Energy mix of LCVs by annual mileage class (SOeS, 2010 LCV survey) ... 255 Table 5.26: Average annual mileage of diesel LCVs and petrol LCVs by age class (SOeS, 2010 LCV survey) ... 255 Table 6.1: Structure and content of a typical car policy document ... 289 Table 7.1: VAT deduction rules for corporate vehicles and their related expenses... 325 Table 7.2: Regional registration taxes on light-duty vehicles and rebates for AFVs ... 330 Table 7.3: TVS tax rates from 2006 to 2014... 337 Table 7.4: The TVS additional component based on local air pollutant emissions ... 339 Table 7.5: The ‘malus’ on higher polluting new passenger cars ... 341
Table 7.6: The ‘bonus’ on new light-duty vehicles (other than hybrid-electric passenger cars) ... 345 Table 7.7: The ‘bonus’ on new hybrid-electric passenger cars ... 346 Table 7.8: The ‘super-bonus’ incentivising the scrapping of older vehicles ... 349 Table 7.9: The annual ‘super malus’ on higher polluting passenger cars 351 Table 7.10: Terms and conditions of the tax schemes applicable to
corporate car fleets ... 352 Table 8.1: New registrations of alternative-fuel vehicles by corporate car fleets (L’Automobile&L’Entreprise, 2013) ... 371 Table 8.2: New registrations of EVs and HEVs by corporate car fleets in France (OVE, 2014c) ... 373 Table A.1: European emission standards for large goods vehicles (MEDDE, 2014; EC, 2011b) ... 413 Table A.2: European emission standards for light-duty vehicles (EC) ... 414 Table D.1: Valuation methods for vehicle fringe benefits (OVE, 2014c) 419
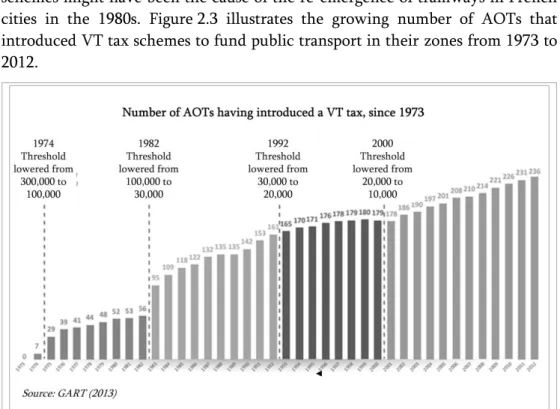
Figure 0.1: Structure of the dissertation ... 21 Figure 2.1: Long-distance journeys for commuting purposes by mode (Grimal, 2010) ... 78 Figure 2.2: Identifying and categorising corporate mobility patterns ... 83 Figure 2.3: Impact of decreasing population thresholds for VT schemes on the actual introduction of VT taxes by AOTs (GART, 2014) ... 90 Figure 3.1: A representation of the ownership and holding of corporate car fleets ... 128 Figure 3.2: A representation of the ownership and holding of the
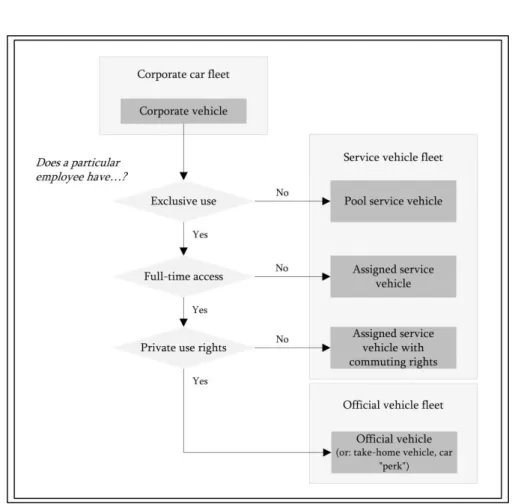
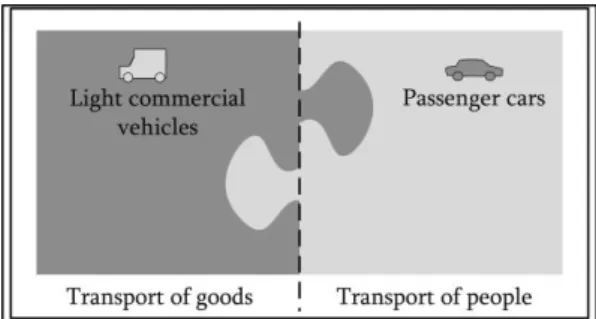
household vehicle fleet ... 129 Figure 3.3: Discriminating official vehicles from service vehicles in corporate car fleets ... 130 Figure 3.4: The overlapping functions of light commercial vehicles and passenger cars ... 131 Figure 3.5: New passenger car sales to households and to juridical persons (OVE, 2014a) ... 136 Figure 3.6: A three-level approach to the TCO of fleets (OVE, 2014c) .. 146 Figure 3.7: TCO breakdown for passenger cars and light commercial vehicles in 2013 (OVE, 2014d) ... 148 Figure 4.1: Encoding of vehicle ownership in the 2010 EGT survey
(Snapshot of the Household form) ... 172 Figure 4.2: Three nested household populations based on their vehicle fleet composition (2010 EGT survey) ... 175 Figure 4.3: Administrative and morphological divisions of space in the Paris region ... 177 Figure 4.4: Distribution of HHs by type of residence area, income and motorisation for different vehicle fleet compositions (2010 EGT survey) ... 179 Figure 4.5: Distribution of HHs by occupation, age and gender of the reference person for different vehicle fleet compositions (2010 EGT survey) ... 180 Figure 4.6: Age distributions for corporate and private vehicles (2010 EGT survey) ... 186 Figure 4.7: Engine taxable horsepower distributions for corporate and private vehicles (2010 EGT survey) ... 188
Figure 5.1: Detailed distribution of LCVs by age cohort for different user
categories (SOeS, 2010 LCV survey) ... 234
Figure 5.2: Distribution of LCVs across user categories by age cohort (SOeS, 2010 LCV survey) ... 235
Figure 5.3: Passenger-car derivatives and ordinary vans among LCVs by age cohort (SOeS, 2010 LCV survey) ... 237
Figure 5.4: Energy mix of LCVs by age cohort (SOeS, 2010 LCV survey) ... 239
Figure 5.5: Average annual mileage of LCVs by age cohort for different categories of users (SOeS, 2010 LCV survey) ... 241
Figure 5.6: Distribution of total LCV mileage by class of daily mileage for different categories of users (SOeS, 2010 LCV survey) ... 242
Figure 5.7: Distribution of small ordinary vans and passenger-car derivatives by age cohort for different user categories (SOeS, 2010 LCV survey) ... 251
Figure 6.1: A schematic representation of corporate mobility management ... 262
Figure 6.2: Nesbitt and Sperling’s two-step vehicle selection process .... 266
Figure 6.3: Nesbitt and Sperling’s typology of fleet decision-making .... 267
Figure 6.4: Our two-step process to select organisations ... 269
Figure 6.5: The sample of organisations at a glance ... 274
Figure 6.6: The sample of participants at a glance ... 275
Figure 6.7: The sample of fleets at a glance ... 277
Figure 6.8: A schematic representation of a complex, international tendering procedure for fleet acquisition (700 passenger cars in France)287 Figure 6.9: The link between official car ‘democratisation’ and vertical differentiation in car policy ... 290
Figure 6.10: Discriminating service vehicles from official cars among the vehicles in sample ... 291
Figure 7.1: A historical perspective on petrol and diesel excise taxes in France ... 320
Figure 7.2: A historical perspective on VAT deduction rules for fuels ... 323
Figure 8.1: Corporate car fleets as a ‘launch ramp’ for EVs ... 378
Figure 8.2: The roles of public policies in promoting innovations: The case of EVs ... 391
Context
The mobility of people and goods is a complex phenomenon, vital to societies, and yet a source of major challenges, in terms of greenhouse gas emissions, local air pollution, congestion or oil dependency. That is why, from the public policy standpoint, in most developed countries the mobility system has begun to shift from being an entity to provide for (e.g. infrastructure, funding) to being an entity to manage. On the path to sustainability, mobility is still in an adolescent phase.
The transition towards sustainable mobility has been the focus of increasing research over the last two decades (see, for instance: Kemp and Rotmans, 2004; Banister, 2008; Geels, 2012; Geerlings, Shiftan and Stead, 2012). Among other findings, this research has highlighted the need for system innovation in order for the transition to happen. Indeed, innovation is a salient feature of the present era and many argue that it carries great potential to meet the challenges of sustainable development. Yet, the mobility systems of most developed countries have been locked into the dominant paradigm of the private car, and this paradigm in turn has been locked into the dominant design of the internal combustion engine (ICE1), for over a century. This technological lock-in limits
the prospects for sustainability improvement within the current mobility paradigm to incremental change at best. Innovation is therefore needed at systemic level.
Research on sustainable mobility transitions has also highlighted the need for adequate public policies for the transitions to happen. Yet for various reasons, designing and implementing public policies that would effectively support such transitions is bound to be a difficult task for public policy-makers. Indeed, a transition is a non-deterministic process ultimately leading to a new, and unknown, dynamic equilibrium among actors, objects, processes and institutions – some old, some recent, and some yet to be discovered – and which is subject to influence by decisions taken in the short- and medium-term,
1 ICE vehicles are also described as ‘conventional vehicles’. See, for instance: Funk and
conflicting interests, wider changes in the economic, social and cultural climate, and inertia at all levels of the system. In order to deal with such uncertainty, public policies further need to be adaptable to a wide range of possible developments in the transition process and agile enough to exploit windows of opportunity for options with the greatest expected benefits for the system as a whole. Moreover, the mobility system is a complex structure, in which decisions are taken by a wide range of actors (e.g. individuals, corporations, governments, NGOs) at various levels (e.g. international, national, local). In order to deal with such complexity, public policy-makers need to adopt an integrated approach to the transition process.
Mobility management policies used to focus on individuals and households, and on their mobility decisions (OECD/ITF, 2010). However, since the late 1980s in Europe and the USA, public authorities have widened the scope of mobility management to include companies, because of the significant effects of
their decisions on the mobility system as a whole (Rye, 1999a; Coleman, 2000; Van Malderen et al., 2012). Thus, for roughly 25 years now, companies have been identified by policy-makers as potential key players in the targeted change towards more sustainable mobility.
Problem statement
Faced with significant sustainability challenges combined with the effects on the national economy of the 2008 economic and financial crisis, French public authorities have endeavoured to promote innovations in the mobility system, with a particular focus on the automotive subsystem, where the challenges were most acute (worsening congestion and air quality in urban areas, rising greenhouse gas emissions and massive job losses in the manufacturing sector). In particular, over the last decade, policy-makers at the national level have sought to foster the introduction and diffusion of low-emission vehicles (e.g. electric vehicles and hybrid-electric vehicles) in the national light-duty vehicle stock, through the implementation of a set of flagship policies, including the most famous environmental ‘bonus’ programme (a purchase incentive for new passenger cars with low CO2 emissions).
Every year in France, 4 out of 10 new light-duty vehicles on the market (including passenger cars and light commercial vehicles) are purchased by corporations. After a few years in corporate car fleets, most of these vehicles would then be sold on the second-hand market to households (or other corporations). If for no other than these two reasons, corporate car fleets make an attractive target for automotive innovation. Yet up to now, corporate car fleets have remained largely unexplored by academic research, and the knowledge and expertise available on this topic among decision-makers is partial and fragmentary.
The starting point of this dissertation is the acknowledgement of a critical need for a sound and shared corpus of knowledge about corporate car fleets in France, with a view to building a more comprehensive understanding of sustainability issues in the mobility system, and gaining valuable insights into how corporate car fleets may be leveraged by public policy-makers to foster the spread of innovations across France’s global light-duty vehicle stock.
Objectives
The main objective of this dissertation is to investigate corporate car fleets in France and to construct a corpus of knowledge on this new research object, not only as an isolated entity, but also as a component in the wider mobility system and as a means to foster the dissemination of innovations across the automotive subsystem.
First, we aim to analyse how corporate car fleets fit into the broader context of corporate mobility, and how in turn corporate mobility fits into the broader context of the mobility system as a whole. We will discuss the hypothesis that corporations are significant players in the mobility system.
In addition, we aim to open the ‘black box’ of corporate car fleets, analyse their composition and patterns of use and examine their management processes. We will highlight some of the main differences (in terms of composition and/or use patterns) between the private vehicle stock and the corporate car fleet, and some of the interactions between the two. On the basis of the insights gained through this analysis, we will try and assess the part corporate car fleets play in the wider sustainability issues facing the French mobility system.
Finally, we aim to analyse the opportunities and challenges for the introduction of automotive innovations into corporate car fleets. We will examine how innovations are perceived by corporations and how they fit into their typical fleet management processes. Last, we will discuss the role public policies can play in encouraging the adoption of innovations.
Approach
Due to the lack of prior research on the issues at stake, we conceived this research as a multi-method investigation. We collected information from a wide range of sources, both academic and non-academic, including ministerial documents, professional journals, legal archives and special features in the mainstream press. We progressively developed analytical frameworks and definitions to allow for a more accurate description of the dynamics of corporate car fleets. We were able to cross-check quantitative results on the composition and use patterns of corporate car fleets from large mobility surveys in France against qualitative insights gained from an exploratory survey based on
face-to-face interviews with fleet decision-makers in the Paris region. Finally, by testing their impacts on the total costs of ownership of corporate vehicles, we were able to assess the relative effectiveness of various tax schemes applicable to corporate car fleets in France. Besides its focus on France, the outcome of this investigation as it is presented in this dissertation has four salient features.
First, when considering sustainability issues in mobility, the primary focus of our analysis is on the economic dimension of sustainability and, to a lesser extent, on its environmental dimension. Although the social issues of mobility may occasionally be touched on, they are not dealt with in depth.
Second, our analysis is based on a conception of the mobility system as a
system of stakeholders, which are classified into four main categories: i) public policy-makers, ii) companies on the supply side of the mobility system (e.g. car manufacturers, transport service providers), iii) corporations2 on the demand
side of the mobility system (i.e. corporations considered as users of the mobility system), and iv) private individuals and households. In our analysis of the issues at stake in the dynamics of corporate car fleets, the standpoint is most often that of either the public policy-maker or the corporate fleet decision-maker. We may occasionally adopt the standpoint of the employee or car manufacturer (or service provider), but each of these would merit an analysis in its own right, which we did not have the resources to undertake.
Third, our analysis of mobility-related decisions is based on the assumption that the mobility system is a complex system, with the implication that sustainability challenges at the higher level stem from decisions that are taken at multiple levels, and that, reciprocally, initiatives at any level can generate sustainability gains at the higher level. In order to unravel the complexity of these multi-level interactions, we can adopt a micro-level perspective (e.g. operational decisions at the fleet manager level), or a meso-level perspective (e.g. economic decisions at company level), or indeed a macro-level perspective (e.g. public policies at the national level), depending on which level is more relevant to the issue under consideration.
Fourth and lastly, the analyses we develop aim to highlight pathways of change. Although our main focus is on the present state and features of the mobility system in general, and corporate car fleets in particular, we endeavour to: i) analyse recent developments in the system when they provide useful context, and ii) discuss the future prospects for innovation in the system on the basis of our understanding of its present state and dynamics.
2 Unless otherwise specified, we will use ‘corporations’ and ‘companies’ as meaning: all
legal entities (i.e. entities which are not natural persons), whether public or private, large or small. See Chapter 3 for more detail.
Thesis outline
The diagram in Figure 0.1 is a graphic presentation of the structure and content of this dissertation. The first part consists of two chapters which provide an overview of current sustainability issues in the French transport system (Chapter 1) and a discussion of the physical flows, financial flows and management tools associated with corporate mobility (Chapter 2). The second part of the dissertation consists of three chapters dedicated to the analysis of corporate car fleets in France, starting with some key definitions and issues (Chapter 3), then analysing large survey databases to investigate the use of corporate vehicles by private households on the one hand (Chapter 4), and the use of light commercial vehicles in corporate fleets on the other hand (Chapter 5). The third and last part of this dissertation also consists of three chapters. Building on a qualitative analysis of fleet management processes and their receptiveness to innovations (Chapter 6), a retrospective analysis of the role of taxes in triggering change in corporate car fleets (Chapter 7), it proposes a discussion of the opportunities and challenges for the introduction of innovations in corporate car fleets (Chapter 8). A concluding section highlights and discusses our main findings.
Corporate players in a
Sustainability issues in
transport: A French
public-policy perspective
1.1 Introduction
Background and purpose of the chapter
1.1.1
Transport acts as a powerful catalyst for the whole economy
Efficient transport systems are essential to the functioning of nations. Not only do they irrigate their economic fabric, they also play a decisive role in shaping it.
The relationship between transport infrastructure and the economic fabric was already discussed in Adam Smith’s Inquiry into the Nature and Causes of the Wealth of Nations (1776). Smith clearly included the development and maintenance of ‘public works’ (which, in modern terms, would obviously include transport infrastructure) among the state’s responsibilities. He would argue that the provision of efficient transport infrastructure enables the specialisation of local economies, thereby resulting in economies of scale and comparative advantages.
As highlighted by Duranton (1997) and Redding and Turner (2014), a rich academic literature (in particular, research described as the ‘new economic geography’) has since investigated the mutually causal relationship between transport systems and the economic development of territories. On an international scale, this research has shown how transport costs contribute to the industrial specialisation of nations, thereby helping to shape international trade patterns (Krugman, 1980). On a more local scale, it has also shed light on
how transport costs influence the distribution of manufacturing production, and in particular its relative concentration, across a given territory (Krugman, 1991).
The question of how to assess the overall costs and benefits of transport to a particular national economy has given rise to much academic debate (Offner, 1993; Lakshmanan et al., 2001; Banister and Berechman, 2001; Lakshmanan, 2011; CGSP, 2013a: p.27). As Lakshmanan et al. (2001) put it: ‘Transport undoubtedly belongs to the most complicated, and therewith fascinating economic sectors. The transport sector exhibits a number of specific features that renders common economic wisdom of only limited use in the assessment of the sector’s costs and benefits. Nevertheless, such an assessment is an important input for the design of transport policies based on solid economic principles.’ Here, in the eyes of economists, are a few of the features specific to the transport sector: i) transport demand is a ‘derived demand’, meaning that it results from the need to match supply and demand on other markets; ii) transport costs and benefits can display very different distributions across space and time;
iii) transport costs are very diverse in nature (internal or external, fixed or variable, instantaneous or cumulative, with a local or global impact, etc.);
iv) transport infrastructures typically have long lifetimes, and can therefore be either the victims or the cause of inertia; and v) transport infrastructure is a quasi-public good (in the microeconomic sense that, to a certain extent, it exhibits properties of non-rivalry and non-excludability).
On the basis of the results of economic research, we acknowledge that transport systems can be powerful catalysts of economic development, although the linkages between transport and the economic development of nations and their territories are complex.
Why this look into the French transport system and the issues at stake?
Notwithstanding its effects on other sectors, transport can also be considered as an industry in its own right, with stakeholders, dynamics, issues and policies of its own. Although, as of 2014, its highest political leaders still thought of France as ‘the country of transport’,1 information on the overall performance of the
French transport industry is rather piecemeal, and the issues at stake, at least from the French public policy-making perspective, are usually discussed independently of one another: here the focus is employment, elsewhere
1 Those were the words of the French President, during his official visit to Brazil in May
2014, as reported by the magazine Challenges. Source:
http://www.challenges.fr/economie/20140430.CHA3335/pourquoi-les-patrons-de-total-edf-alstom-airbus-ou-dassault-sont-de-tous-les-voyages-presidentiels.html. [Accessed:
environmental impact, on another occasion action against geographical segregation, etc.
The starting point for this chapter, therefore, was the postulate that French policy-makers need to develop a more integrated view of transport issues, a unified grasp of the main direct effects, both positive and negative, of transport activities on the French economy and society and on the environment. We acknowledge that the issues at stake are complex and require a holistic, level-headed approach. The main objective of this chapter is to provide insight into the context of transport-related issues in France, so that our research on corporate car fleets is placed in appropriate perspective.
As we gradually progressed in our search for relevant data and documents, it became clear that this chapter was particularly crucial to our argument in that very little had been written in English about the French perspective on public policy-making in the field of transport. Indeed, very few of the French strategic documents on transport, let alone policies or laws, were translated into ‘the language of Shakespeare’2 – with a few exceptions, such as some rare executive
summaries of official reports. The same held for most research papers on transport challenges and policies in France. This observation strengthened our resolve to start this dissertation with brief background information on the wider issues at stake in the sphere of transport in France.
Method and data
1.1.2
This chapter reviews the main transport-related issues from a French policy-making standpoint. We use a descriptive approach to provide some practical insights into: i) the major contributions of transport-related activities to the economy, ii) the massive challenges posed by the negative impacts of transport on the economy and society, and on the environment, iii) the increasingly strained funding conditions for transport infrastructure and public transport services, and iv) France’s innovation-based strategy for a more sustainable transport system.
The geographical focus of our analysis is on France, but we extend it to Europe when this is relevant for purposes of benchmarking, or to put national policies in the context of the European legislative framework.
When considering the transport industry, we include in our analysis the widest possible range of activities, from the manufacturing of transport equipment, through to the operation of transport services. However, we were sometimes limited in our ability to isolate from their ‘original’ sectors the data concerning such transport-related activities as the supply of transport
infrastructure (from the ‘construction’ sector), or the supply of insurance services for transport activities (from the ‘financial services’ sector). Therefore, we adjusted the scope of activities covered in our analysis depending on the type and depth of available data.
The main data we use for our analysis are: i) transport-specific data sets from the national transport database (SOeS sources), ii) additional transport-related macroeconomic data sets from the national statistics database (INSEE sources), and iii) emission data sets from the national emissions inventory database (CITEPA sources). When insights for Europe are considered a relevant benchmark, we refer to data sets from Eurostat sources.
We endeavour to provide the most recent data available at the time of writing on every topic of interest. We include references to prior years or decades when we deem them relevant to the discussion of recent developments and trends.
Basic information on the national policy framework is provided to help understand the recent developments and trends observed in the transport industry and their effects on the French economy and society. Additional information is given on the European legislative framework when it provides useful context.
Outline of the chapter
1.1.3
The chapter is structured into four main parts and a conclusion. First, we review the significant contributions of transport-related activities to the French economy, with a twofold focus on output and employment (Section 1.2). Second, we run through the massive challenges posed by the negative impacts of transport on the French economy and society, and on the environment, including: the effects of oil dependency on the national trade balance, the negative effects of transport emissions on human health and the environment, the heavy toll of transport accidents on human lives, and the societal costs of congestion (Section 1.3). Third, we provide some insights into the increasingly strained funding conditions for transport infrastructure and public transport servicesservices (Section 1.4). Then, we describe France’s innovation-based strategy for a more sustainable transport system (Section 1.5). The final section (1.6) contains a number of concluding remarks.
1.2 Transport-related activities in the economy
The scope of our analysisThere are numerous perspectives from which to look at the components of a transport system, each of which can be more or less relevant depending on the objective of the analysis. One can look at the transport system from a spatial development and planning perspective (distinguishing between urban,
interurban and rural transport), from a governance perspective (distinguishing between public and private transport), from an end-use perspective (distinguishing between passenger and freight transport), from a technical perspective (distinguishing between transport modes, such as road, rail, air and waterways), or finally from a production perspective (distinguishing between individual and collective transport).
Instead, given that our objective is to reflect the overall contribution of transport to the French economy, we choose here to look at the transport system from an economic activity perspective and include the widest possible range of transport-related manufacturing and service activities within the scope of our analysis, subject to data availability. This approach will help us show the contributions of transport activities to the French economy from a macroscopic standpoint, with a twofold focus on: i) output, and ii) jobs.
According to NAF, France’s classification of economic activities, revised in 2008 (INSEE, 2008a; SOeS, 2013a), the transport and storage activity sector (section H of NAF-2008, activity codes from 49 to 53) includes all activities relating to transport services, scheduled or unscheduled, for passengers and/or freight, by rail, road, pipelines, waterways or air, together with ancillary activities such as the operation of transport infrastructure, freight handling, storage, etc. It includes such activities as the rent of transport equipment with a driver (e.g. taxis) or operator, as well as postal and mail services. It does not, however, include such activities as the construction, maintenance and repair of roads, railways, ports and airfields, the trade and repair of motor vehicles and motorcycles, the repair and conversion of transport equipment other than motor vehicles, or the rent of transport equipment without a driver or operator (e.g. car rental).
Therefore, on top of the activities listed in section H of NAF-2008, we include in our scope the following manufacturing activities: i) automotive manufacturing (activity code 29), and ii) manufacturing of other transport equipment (activity code 30); as well as the following service activities:
iii) wholesale and retail trade and repair of motor vehicles and motorcycles (activity code 45). The construction, maintenance and repair of roads, railways, ports and airfields (activity code 42) are activities that have been excluded from the scope of our analysis for lack of available data sets from the online national statistics database (INSEE website). In addition, the repair and conversion of transport equipment other than motor vehicles and motorcycles on the one hand, and the rent of transport equipment without a driver or operator on the other hand, are activities that have been excluded from the scope of our analysis because the related data sets in the national statistics database aggregate these transport-related activities with others that clearly fall outside the scope of this discussion (e.g. the rent of transport equipment without a driver or operator is aggregated with office machinery and computer rental activities under activity
code 77). For similar reasons of data availability, we leave out of the scope of our analysis certain activities that would naturally be considered as an integral part of the transport system, such as: travel agents (their activity depends as much on the hotel sector as it does on the transport and storage sector), fuel distribution and retail, or motor vehicle insurance.
To avoid any ambiguity regarding the data presented in this section, we hereafter refer to the ‘transport and storage sector’ when dealing only with activities included in section H of NAF-2008, and to the ‘transport industry’ when both the manufacture of automotive and other transport equipment, and the trade and repair of motor vehicles and motorcycles, are included.
A major sector for national output
1.2.1
As illustrated in Table 1.1, according to French national statistics, the transport industry accounted for nearly 10% of national output in France in 2011 (312 billion EUR, in constant 2005 Euros): 117 billion EUR in manufacturing activities (close to 14% of France’s total manufacturing output), and 195 billion EUR in services. This ratio was only down 0.5 percentage point on its 2000 level, indicating transport’s fairly steady contribution to France’s overall national output despite the economic and financial crisis of 2008 (INSEE, 2013a). Manufacturing activities still accounted for 38% of the transport industry’s output in 2011 (down from just 39% in 2000), while service activities made up the remaining 62% (up from 61% in 2000). The fall in output from automotive manufacturing activities over the period 2000-2011 (-14.6 billion EUR) was more than offset by the increase in the output from the other transport equipment manufacturing activities over the same period (+20 billion EUR).
Focusing on the transport and storage sector stricto sensu (i.e. section H in NAF-2008), SOeS gives the following breakdown for its output value in 2011: 26% stemmed from passenger transport services (including urban, interurban and international, including road and other land transport, air transport, inland waterways and maritime transport), and another 36% from freight transport services (idem). The remaining 37% of the output of the transport and storage sector came from other services, such as mail and postal services, handling and storage, and other supporting services. (SOeS, 2013a)
Table 1.1: Contribution of the transport industry to French national output (INSEE, 2013a)
Table 1.2: Output of passenger and freight transport services in 2011 (SOeS, 2013a)
2 0 0 0 2 0 1 1
M anufacturing 1 1 1 ,5 8 6 3 .9 % 1 1 6 ,9 3 0 3 .6 %
Automotive 73,356 2.6% 58,705 1.8%
Other transport equipment 38,230 1.3% 58,225 1.8%
Serv ices ( 1 ) 1 7 5 ,7 3 9 6 .2 % 1 9 4 ,5 8 0 6 .0 %
Motor veh. trade & repair (2) 32,126 1.1% 33,913 1.0%
Land and pipeline transport 64,434 2.3% 73,497 2.3%
Waterways transport 8,109 0.3% 11,437 0.4%
Air transport 16,170 0.6% 16,329 0.5%
Storage & supporting services 41,445 1.5% 47,732 1.5%
Postal & mail services 13,455 0.5% 11,672 0.4%
Transpo rt to tal 2 8 7 ,3 2 5 1 0 .1 % 3 1 1 ,5 1 0 9 .6 %
Transpo rt activ ties by activ ity branch
Notes: 1. Travel agents, tour operators, reservation services, and related activities are not included here because their activities are as much related to the transport industry as they are to the hotel industry. They produced 6,080 million euros in 2000 (0.2% of national production) and 6,882 million euros in 2011 (0.2% of national production). 2. Including wholesale and retail trade, as well as repair, of motor vehicles and motorcycles.
N atio nal o utput
(E U R 2 0 0 5 , millio ns - as a % of total)
in current E U R, millio ns as a % of total
production in the sector
Passenger transport 47,370 26%
Freight transport (2) 64,942 36%
Other services (3) 67,046 37%
incl. Mail & postal serv. 12,940 7%
All transpo rt serv ices 1 7 9 ,3 5 8 1 0 0 %
Notes: 1. Including all activities under section H of NAF-2008, but excluding trade and repair of motor vehicles and motorcycles. 2. Including parcel delivery and express freight. 3. Including mail and postal services, handling and storage services, other supporting services, etc.
Serv ices in the transpo rt and sto rage secto r ( 1 )
Table 1.3 displays the number of companies in the transport and storage sector (section H of NAF-2008) in 2011. It shows that both passenger transport and freight transport (respectively 37,833 and 41,067 companies in 2011) are rather diffuse activities. For instance, among passenger transport activities, taxis alone accounted for 31,682 companies in 2011, 35% of the total number of companies in the sector (SOeS, 2013e). It can be inferred, however, that the remaining 6,151 companies involved in passenger transport (including all urban and interurban transport operators) are more concentrated than the taxi industry. Freight transport activities are likely to present the same type of ‘dichotomy’ between very small enterprises and much bigger players.
Linking these statistics with those presented in Table 1.2, we can compute indicative values for the average annual turnover of companies in the transport and storage sector: around 1.3 million EUR for companies with a passenger transport activity, and around 1.6 million EUR for companies with a freight transport activity. In both cases, such annual turnover fits the official definition of a micro-enterprise.3 It is, however, likely that the output value of the sector
would be unevenly distributed among companies involved in these fields of activity.
Table 1.3: Number of companies in passenger and freight transport services in 2011 (SOeS, 2013e)
3 According to French national statistics, micro-enterprises are businesses employing
fewer than 10 people, and with an annual turnover or a total balance sheet which does not exceed 2 million EUR (Source: http://www.insee.fr/en/methodes/default.asp?page= definitions/microentreprise.htm).
units as a % of total units in
the sector
Passenger transport 37,833 42%
incl. Taxis 31,682 35%
Freight transport (2) 41,067 45%
Other services (3) 11,856 13%
All transpo rt serv ices 9 0 ,7 5 6 1 0 0 %
Serv ices in the transpo rt and sto rage secto r ( 1 )
N umber o f co mpanies o n January 1 , 2 0 1 1
Notes: 1. Including all activities under section H of NAF-2008, but excluding trade and repair of motor vehicles and motorcycles. 2. Including parcel delivery and express freight. 3. Including mail and postal services, handling and storage services, other supporting services, etc.
A significant employment sector
1.2.2
Following these initial insights into the transport industry’s contribution to the French economy, we can further observe that this industry has been one of the main employment sectors over the last fifty years. Table 1.4 shows that the respective situations of wage employment in transport manufacturing activities on the one hand, and in transport service activities on the other hand, have followed very different paths since 1970 (end of the thirty-year boom that followed the Second World War in France). Because of discontinued data sets from 1990 onwards, self-employment could not be included in our analysis of the employment situation in the transport industry.
In keeping with the progressive deindustrialisation France experienced over that period,4 automotive manufacturing industries lost 80,000 jobs in the 20
years from 1990 to 2010 (approximately 4,000 per year), and were still losing jobs in 2013. Industries manufacturing other transport equipment (such as aircraft, trains, etc.) shed 40,000 jobs over the same two decades (2,000 per year), although they started to recoup jobs after 2010. Altogether, wage employment in the transport manufacturing industries decreased from 2.6% of total national jobs in 1970, to just 1.4% in 2010. (INSEE, 2014a and 2014b)
Looking now at transport service activities, the employment situation has evolved very differently indeed. The transport and storage sector (section H of NAF-2008) gained 363,000 jobs in the 40 years from 1970 to 2010 (a little over 9,000 jobs per year). Most of this increase occurred before 2000, with this sector growing from 4.6% of total jobs in France in 1970 to 5.3% in 2000. The following decade however saw less dynamic growth, and the share of national jobs in the transport and storage sector seems to have stabilised at a little over 5%. (INSEE, 2014a)
Services that fall within the definition of ‘wholesale and retail trade and repair of motor vehicles and motorcycles’ (activity code 45.20 under NAF-2008) gained 100,000 jobs from 1970 to 2000 (approximately 3,300 jobs a year), before levelling off in 2002-2003 (397,000 jobs) and losing 34,000 jobs in the next 10 years. (INSEE, 2007 and 2014b)
Altogether, the transport industry provided 8.0% of total wage employment in France in 2010: 0.9% in automotive manufacturing, 0.5% in manufacturing of other transport equipment, 1.4% in wholesale and retail trade and repair of motor vehicles, and 5.1% in the transport and storage sector.
4 Between 1980 and 2007, employment in the manufacturing industries in France
declined by 1.9 million jobs (36% of their total in 1980), or by approximately 71,000 jobs per year. (Demmou, 2010)
According to Eurostat sources, EU-27 gave very similar statistics for transport employment in 2010, with a total of 8.7% of jobs either in manufacturing of motor vehicles and other transport equipment (1.8%), or in wholesale and retail trade and repair of motor vehicles (another 1.8%), or in the transport and storage sector (5.1% overall: 3.0% in transport services, 1.3% in warehousing and support activities for transport, 0.8% in postal and courier activities).
When we look at the restricted perimeter of the transport and storage sector in France (see Table 1.5), we observe that land transport provided 55% of the total headcount in the sector in 2011 (740,000 jobs out of 1,352,000), split equally between passenger transport services on the one hand (28% of total), and freight transport services on the other (27% of total). Inland waterways, maritime transport and air transport together made up less than 7% of total jobs in the sector, while storage and support services were close to 20%, as were postal and mail services. (SOeS, 2013e)
The following statistics further illustrate transport’s contribution to the national economy from the employment perspective: passenger and freight transport services, exclusive of storage and supporting services and exclusive of postal and mail services, generated 63 billion EUR in gross remunerations in 2011, 83% of which in land transport (56% for road, 15% for railways, and 12% in urban public transport and scheduled coaches), 12% in air transport, and 5% in inland waterways and maritime transport. (SOeS, 2013a)
To conclude our comments on the contribution of the transport industry to the economy from both the output and the employment perspectives, we can compare the figures in Tables 1.1 and 1.4 and note that the share of transport in national employment is smaller than its share in national output. This observation holds for the whole transport industry and for each of its subsectors as well, with the notable exception of motor vehicle trade and repair services (they make up around 1% of national production and around 1.5% of national employment). This is in line with the observations made by Redding and Turner (2014) for the USA,5 and by the European Commission for the EU:6 labour
productivity (as measured by the ratio of output value to employee headcount) for virtually all the activities in the transport industry, be they manufacturing or services, is above average.
5 Redding and Turner (2014) base their analysis on the for-hire transportation sector in
the USA.
6 See: http://ec.europa.eu/transport/strategies/facts-and-figures/transport-matters/index_
Table 1.4: Wage employment in the transport industry (INSEE)
Table 1.5: Wage employment in the transport and storage sector (SOeS, 2013e)
1 9 7 0 1 9 8 0 1 9 9 0 2 0 0 0 2 0 1 0 2 0 1 3
M anufacturing ( 3 )
Automotive 309 293 229 211
Other transport equipment 172 137 132 147
Serv ices ( 4 )
Motor veh. trade & repair (5) (6) 281 328 340 381 378 363
Transport and storage - all (7) 985 1,104 1,186 1,339 1,349 1,345
Transpo rt industry to tal 1 ,8 2 5 2 ,0 4 6 2 ,0 0 7 2 ,1 5 0 2 ,0 8 9 2 ,0 6 6
as a % of all jobs in France ( 8 ) ( 9 ) 8 .5 % 9 .0 % 8 .6 % 8 .6 % 8 .0 % n.a.
Notes: 1. Data are for metropolitan France only: French Overseas Departments are not included. 2. Self-employment in the considered activity branches represented between 140,000 and 150,000 in 1970, 1980 and 1990 (INSEE, 2007). Due to discontinued data series after 1990, self-employment could not be included in the total for transport employment. 3. Sources: INSEE (2014a) for 1970 and 1980; INSEE (2014b) for 1990 onwards. 4. Including trade and repair activities for vehicle motors (activity code 45.20 under NAF-2008), as well as transport and storage services (section H of NAF-2008, activoty codes 49 to 53). 5. Including wholesale and retail trade, as well as repair and maintenance, of motor vehicles and motorcycles. 6. Sources: INSEE (2007) for 1970 and 1980; INSEE (2014b) for 1990 onwards. 7. Source: INSEE (2014a). 8. Including wage employment as well as self-employment. 9. Source: INSEE (2014c) for total employment in France.
Activ ity branch
614 558
Wage emplo yment ( 1 ) ( 2 ) o n Dec. 3 1 (0 0 0 )
0 0 0 units as a % of total
headcount in the sector
Land and pipeline transport 740 55%
incl. Passeng. transport 381 28%
incl. Freight transport 360 27%
Waterways transport 17 1%
Air transport 71 5%
Storage & supporting services 261 19%
Postal & mail services 263 19%
All transpo rt serv ices 1 ,3 5 2 1 0 0 %
Serv ices in the transpo rt and sto rage secto r ( 1 )
Wage emplo yment o n December 3 1 , 2 0 1 1
Note: 1. Including all activities under section H of NAF-2008, but excluding trade and repair of motor vehicles and motorcycles.
1.3 Monitoring the negative impacts of mobility
Notwithstanding the significant positive contributions of the transport industry to the French economy, we consider that the overall sustainability of the French transport system should be examined. The European Union’s 2006 renewed sustainable development strategy defines a sustainable transport system as one that ‘meets society’s economic, social and environmental needs whilst minimising its undesirable impacts on the economy, society and the environment’ (European Council, 2006, p. 10).Our purpose here is not to discuss the challenges of, and academic debates about, the methods used to evaluate the costs associated with transport ‘externalities’ (also known as the ‘external costs’ of transport7). For in-depth
discussions of these methods and associated issues, we refer our reader to the rich literature dealing with the topic: i) from a welfare economics research perspective (see, for instance: Verhoef, 1994; Lakshmanan et al., 2001; Schipper
et al., 2001; Kopp and Prud’homme, 2007; Parry et al., 2007; Proost, 2011; Lakshmanan, 2011; Quinet, 2013); and ii) from an operational policy-making perspective (see, for instance, the policy recommendations based on meta-analyses of third-party studies and research into public investment cost-benefit analyses and transport project appraisal, by: CGP, 2001; CE Delft, 2008; CGSP, 2013a and 2013b; Ricardo-AEA, 2014).
Instead, we focus on the five major sources of external transport costs as identified in recent research on transport externalities in Europe and the USA (Friedrich and Quinet, 2011; Delucchi and McCubbin, 2011) – namely: oil dependency, emissions of local pollutants, emissions of greenhouse gases, accidents and congestion8 – and we offer some practical insights into the massive
challenges posed to French public policy-makers by transport’s ‘undesirable impacts on the economy, society and the environment’ (European Council, 2006).
7 Proost (2011).
8 Noise emissions have not been included in this analysis because their effects on human
health are complex, very dependent on site location, and still not precisely assessed. For further insights into the effects of noise emissions on human health, see: WHO (2011), and ANSES (2012).
Massive fuel consumption that burdens the trade balance
1.3.1
After following an upward trend from 1985 to 2002 (+2.4% per year on average), final energy use by the transport sector in France has been slowly decreasing ever since (-0.1% per year on average from 2003 to 2012). (SOeS, 2013i)
The transport sector was responsible for a stable 29.6% share of total final energy consumption in France in 2010, 2011 and 2012, up from 17.9% in 1973 and 26.6% in 1990 (SOeS, 2013a). Over the long term, its share of final consumption of oil products for energy purposes has increased mechanically in parallel with the decrease in the use of oil products in other activities (whether agricultural, industrial, tertiary or residential): it was approximately 70% in 2012, as compared with about 50% in 1990 (SOeS, 2013a).
The reign of oil, the diesel takeover
As illustrated in Table 1.6, the energy mix in the transport sector has remained
heavily dominated by oil, which still constituted 93% of final energy use in the sector in 2011 (as compared with 98% in 1990).9 Renewable energies – mainly
biofuels – emerged as an alternative source of energy for the sector following the European regulations that set mandatory targets for their use in transport (for the record: 10% by 2020 in all European Member States).10 Yet, they were still a
minority in the sector’s energy mix in 2011, with a 5% share. Moreover, it appears that enhanced targets for the use of renewable sources of energy in transport are unlikely to be introduced before an agreement is reached among European regulatory bodies to tighten sustainability criteria for biofuels.11
Beyond biofuels, the hopes for energy diversification in the transport sector rest on electricity and natural gas. Although on a rising trend, use of these two energy sources was still minimal in 2011 (respectively 2.0% and 0.2% of final national energy use in the sector). (SOeS, 2013i)
9 The transport sector’s heavy dependency on oil is not specific to France. Refined
petroleum products represent the same proportion of final energy demand in transport at EU level: 93% (EC, 2013b).
10 EC (2009a), Art.3-4: ‘Each Member State shall ensure that the share of energy from
renewable sources in all forms of transport in 2020 is at least 10% of the final consumption of energy in transport in that Member State.’