HAL Id: hal-00926113
https://hal.archives-ouvertes.fr/hal-00926113
Submitted on 9 Jan 2014HAL is a multi-disciplinary open access
archive for the deposit and dissemination of sci-entific research documents, whether they are pub-lished or not. The documents may come from teaching and research institutions in France or abroad, or from public or private research centers.
L’archive ouverte pluridisciplinaire HAL, est destinée au dépôt et à la diffusion de documents scientifiques de niveau recherche, publiés ou non, émanant des établissements d’enseignement et de recherche français ou étrangers, des laboratoires publics ou privés.
Experimental and numerical study of long term
sedimentation in a secondary channel: example of the
Beurre island on the Rhône River, France
B. Camenen, E. Andries, J.B. Faure, M. de Linares, F. Gandilhon, G. Raccasi
To cite this version:
B. Camenen, E. Andries, J.B. Faure, M. de Linares, F. Gandilhon, et al.. Experimental and numerical study of long term sedimentation in a secondary channel: example of the Beurre island on the Rhône River, France. International Symposium on River Sedimentation, Sep 2013, Kyoto, Japan. 8 p. �hal-00926113�
1 INTRODUCTION
Flood risk is a major economical issue in many countries. When the flow is out of bank, i.e., typi-cally during a flood, there is a significant increase in the complexity of flow behaviour, even for relatively straight reaches. This complexity results in an even larger complexity for the dynamics of fine sediments in a compound channel. While many studies exist on river overflowing to the flood plain since the work of Sellin (1964), only few studies exist on the fine sediment dynamics (James, 1985; Fraselle et al., 2010; Hu et al., 2010). However, consequent dam-ages of a flood are often aggravated by fine sediment deposits, especially in urban areas. Moreover, this fine sediment deposits may be a source of pollutants such as PCBs or heavy metals
This study deals with the estimation of long-term deposits in active secondary channels that are con-nected to the main channel for relatively low dis-charges. The Beurre island is a protected area lo-cated on the Rhône River. Since significant deposition of fine sediments with potential pollution and clogging effects was observed (Pb, PCBs), this site is surveyed since 2002 with regular bathymetric measurements as well as deposited sediment charac-terizations. Two numerical models solving the ad-vection-dispersion equations were applied and com-pared to this system: a 3D model (Telemac3D) and a 1D river network model (Mage-AdisTS).
2 PRESENTATION OF THE STUDY SITE 2.1 Location
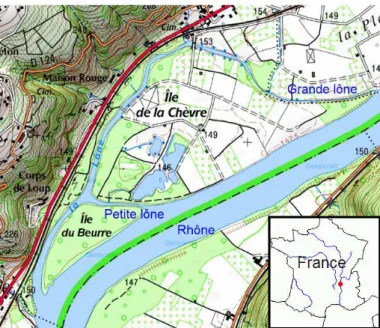
The Beurre and Chèvre islands are located on the Rhône River, France, approximately 40 km south of the city of Lyon (Fig. 1). It consist in two secondary channels: the Chèvre channel (or “Grande lone”), which is 2700 long, and the Beurre channel (or “Pe-tite lône”), which is 350 m long. The Rhône River is in average 200 m wide along this reach.
Figure 1. Location and plane geometry of the Beurre island.
Experimental and numerical study of long term sedimentation in a
secondary channel: example of the Beurre island on the Rhône River,
France
B. Camenen, E. Andries & J.-B. Faure
Irstea Lyon, Hydrology-Hydraulics Research Unit, Villeurbanne, France
M. de Linares & F. Gandilhon
Artelia Eau & Environnement, Echirolles, France
G. Raccasi
Ginger Environnement, Montpellier, France
ABSTRACT: Two numerical models (1D and 3D) have been used to reproduce significant deposits that have
been observed in two secondary channels located next to the Beurre island on the Rhône River, France. Both models yield relatively good results compared to the measurements but are sensitive to the upstream boundary condition for the concentration, which is poorly understood. Several issues also arose thanks to this
model-ling. Computation of discharge repartition in the two secondary channels appeared to have a strong impact on
long-term estimation of fine sediment deposits, and is an interesting challenge for 1D modelling. Discharges in the Rhône River above the one year return period flood yield approximately 50% of the fine sediment mass transiting in the secondary channels, which represents approximately 1% of the total SSM fluxes. And 1 to 10% of these fine sediments appeared to settle down. Also, erosion and deposition laws that are implemented in 1D and 3D models induce different strategies for calibration and validation.
2.2 Experimental data
The Nature Observation Centre of the Beurre island achieved several bathymetric and sedimentologic surveys since 2002. Measurements were carried out yearly on the Beurre channel, and in 2002, 2004, 2005, and in 2009 on the Chèvre channel. They con-sisted in a description of the two secondary channels thanks to 30 cross-sections more or less regularly distributed along the channels (Fig. 2). The spatial position uncertainty is estimated to 30 cm approxi-mately and the vertical uncertainty of these meas-urements equal to 5 cm. The bathymetric and topog-raphic description of the site was completed thanks to cross-sections of the Rhône River and scattered elevation points taken from the Rhône data base provided by IGN (Institut Géographique National). Two additional campaigns (2009 and 2011) were achieved to collect samples and characterize sedi-ment grain sizes at different locations.
Figure 2. Topography of the Beurre island and position of the measured cross-sections.
2.3 Morphodynamics of the Beurre Island
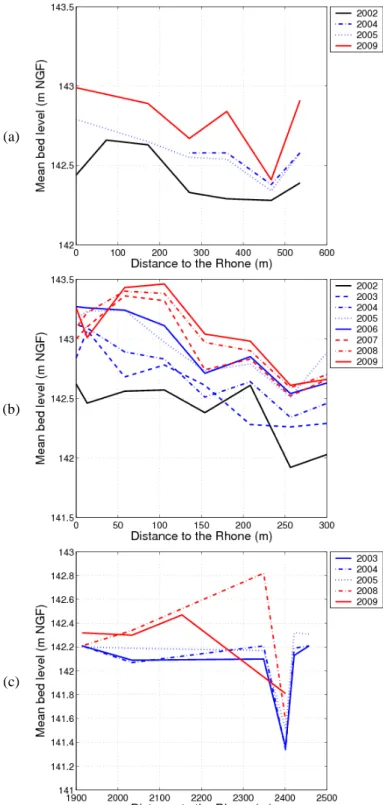
In Fig. 3 are represented the measured bed evolution of the two secondary channels. To obtained these re-sults, an active channel was defined for all cross-sections excluding margins and only bed evolution within this active channel was compared. The mid-dle part of the Chèvre channel is not studied because of the lack of temporal data. It can be observed that significant deposition occurred these last 10 years on both entrances of the secondary channel (Fig. 3a and b) with an total deposit thickness up to 0.5 and 1 m locally for the Chèvre and Beurre channels, respec-tively. On the Beurre island, it appears that the depo-sition rate tends to decrease with time. On the down-stream part of the Chèvre channel (after the confluence with the Beurre channel), even if deposi-tion is prevailing, the morphodynamic behaviour of this sub-reach is not as clear. The later deposition (between 2005 and 2008) may be attributed to a downstream transfer of sediments. Between 2008
and 2009, a large erosion occurred, which may be due to the effects with the downstream connection to the Rhône River in the lowaer part of this secondary channel.
(a)
(b)
(c)
Figure 3. Bed evolution of the upstream part (a) and down-stream part (c) of the Chèvre channel (Grande lône), and (b) the Beurre channel (Petite lone).
Grain size characterization indicates a clear down-stream fining with the two secondary channels. The upstream part of the Chèvre and Beurre channels are mainly composed of medium (0.2 – 0.5 mm) and fines sands (50 – 200 µm). In the middle part of these channels, medium sands are replaced by coarse silts (20 – 50 µm). And finally, at the downstream
part of the Chèvre channel, coarse and fine (2 – 20 µm) silts (clay) are prevailing.
2.4 Hydrology
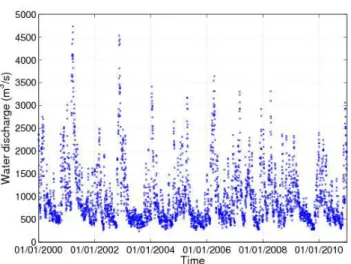
Discharge time series were obtained from a hydro-metric station located at Ternay, approximately 20 km upstream to the Beurre island. The character-istic discharges are the following:
− low flow: Q = 280 m3/s;
− 1 year return period flood: Q = 2500 m3/s; − 2 year return period flood: Q = 3200 m3/s; − 10 year return period flood: Q = 4200 m3/s. The discharge time series are presented Fig. 4. It can be observed that two decennial flood occurred during the first part of the studied period (March 2001, and November 2002). Then, four biannual flood occurred from 2004 to 2008. And eventually, discharges never exceed Q = 2500 m3/s from 2008 to 2010. Deposit dynamics in the Beurre channel ap-pears to be well correlated to this hydrology.
Figure 4. Daily stream discharges measured upstream to the study site.
2.5 Fine sediment suspension
Suspended Sediment Matter (SSM) measurements are lacking close to the study site. However, in order to understand the dynamics of the sediment deposits, it is fundamental to have an idea of the SSM time se-ries at the upstream boundary. Some scattered meas-urements were made at Chasse-sur-Saône (CsR, close to Ternay) but the quality of these samples is poor since the SSM concentrations were observed very heterogeneous throughout the cross-section. Other measurements were collected at St Vallier (StV), which is located nearly 100 km downstream. As observed on Fig. 5, there is a very poor correla-tion between the SSM concentracorrela-tions measured at these two positions and the flow discharge. The only possibility to build long time series is to provide a direct relationship between the concentration C and the discharge Q following a power law such as:
b
aQ
C= (1)
Much better documented and complete data sets exist upstream on the Saône River and on the Rhône River next to Lyon; and no significant SSM input can be assumed between these two stations and the study site. Hence, an estimation of the SSM concen-tration at Ternay was possible by applying calibrated equations (based on Eq. (1)) for the Saône and Rhône river for different set of discharges, and so es-timating the resulting concentration for the sum of the two discharges. The obtained results yield an ad-ditional series of potential data points in Fig. 5 (grey zone). It was then possible to fit an Eq.(1)-type equa-tion with a = 8×10⁻⁷ and b = 1.5 (fit 1 on Fig. 5). A lower value for a (a = 5×10⁻⁷, fit 2) was tested to es-timate the sensitivity on the concentration. Finally, in order to take into account possible increase of SSM concentration during flood of the upper Rhône, a third fit was used (fit 3 in Fig. 5). Based on the dis-charge data series, a estimation of the averaged an-nual SSM flux is then possible, which is in the order of one million of tons:
- fit 1:
Φ
SSM = 1.64 Mt; - fit 2:Φ
SSM = 1.02 Mt; - fit 3:Φ
SSM = 2.17 Mt.If the highest occurrence for the discharge is Q = 400 m3/s, the discharge that induces the largest amount of SSM flux is Q = 2000 m3/s.
Figure 5. Relationships between daily discharges et average SSM concentrations.
There are very few data on the grain size analyse of the SSM in the Rhône River. Based on Sogréah (2000) and data provided by CNR, it appears that 90% of the particles are silt and clay and d50 is ap-proximately equal to 10 µm. In the following study (for the 1D modelling), we will assumed three classes of sediments to describe the SSM in the Rhône River:
- class 1: d = 8 µm, 65% in mass; - class 2: d = 20 µm, 25% in mass; - class 3: d = 50 µm, 10% in mass.
3 DESCRIPTION OF THE MODELLING 3.1 1D modelling: Mage-Adis-TS
The 1D models used for this study are Mage and Adis-TS (Faure, 2009, 2012). Adis-TS solves the 1D advection-dispersion equation. Both models were developed for long river networks and long-term modelling (implicit schemes, parallelization…). For this reason, both models are fully uncoupled and bed elevation is assumed constant. The mass of fine sediments available on the bed as a source term is thus fictional but allows a mass conservation with the sediments deposited D or eroded E (Andries et al. , 2011). The source terms are estimated for both main channel and flood plains using a decomposi-tion of the flow discharge (Nicollet and Uan, 1979). For both main channel and flood plain, they are computed using Eq. 2, which is based on the equa-tions of Partheniades (1965) for the erosion and Krone (1962) for the deposition:
(
)
k k s k eq k disp PD W H W C C e a W D E− = , ( , − ) (2)where W is the width of the river, aPD is a calibration coefficient, edisp a coefficient indicating the sediment availability on the sub-channel k (k yields for main channel or flood plain), edisp = 0 if there is erosion and no sediment available on the bed ; edisp = 1 oth-erwise, Ceq the equilibrium concentration, Ws the set-tling velocity (computed for each class of sediments using Camenen, 2007), H the averaged depth. It is assumed here that the concentration C is homogene-ous in the section. Basically, for each sub-channel, there is erosion if the equilibrium concentration Ceq is larger than the average concentration computed thanks to the model C. The equilibrium concentra-tion may be estimated for each sub-channel as a function of the effective bed shear stress τ made di-mensionless with its critical value for inception of movement, such as,
C b cr C eq a C − = 1
τ
τ
(3) where aC and bC are calibration parameters (bC = 1as a first approximation). τcr = 0.24 N/m2 is used as a
typical value for silt sediments (Ternat et al., 2008). The 1D model is 36 km long, from Ternay hydro-metric station to the Saint-Pierre-de-Boeuf dam (15 km downstream). It should be noted that the Vaugris dam is located approximately 3 km up-stream to the Beurre island. For the long-term simu-lation, this induces some additional uncertainties as the precise dam management is unknown. The Beurre and Chèvre channels were introduced in the 1D model as independent secondary channels within the river network instead of being included in the floodplain to better describe their dynamics.
3.2 3D modelling: Telemac3D
Telemac3D (http://www.opentelemac.org/) was used for the detailed modelling of the site. It solves the 3D advection-dispersion equations where the source terms D-E correspond to the exchange of sediments between the water column and the bed. For the ero-sion, a Partheniades (1965)-type law is used:
− = 1 cr M E
τ
τ
(4) with M = 2.4×10⁻⁴ kg/m2/s a erosion coefficient. For the deposit term, it is estimated using the settling ve-locity of the sediments (given by the user, Ws =3.6×10⁻⁴ m/s for the present study) and the bottom concentration Cb:
b sC
W
D= (5)
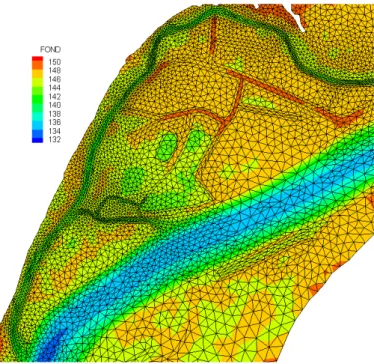
Fig. 6 presents the final plane mesh used for the 3D calculations. The total length of the model is 6 km long. The size of the mesh varies from 10 to 30 m in the secondary channels to 300 m in the flood plain and on the Rhône River. In total, the 2D mesh is composed of 8254 nodes, which means 82540 nodes for the 3D mesh since 10 layers were used.
Figure 6. Unstructured mesh for Telemac3D.
3.3 Calibration of the models
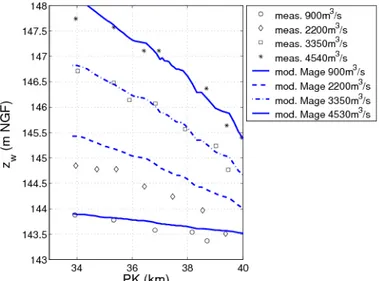
The downstream boundary condition for the model is based on a simplified stage discharge relationship for the Saint-Pierre-de-Boeuf dam (see Fig. 10b). The model calibration has been achieved by adjusting Strickler coefficients on the main channel (low dis-charge) and flood plain (i.e. margins, islands …) in order to simulate similar water level as observed. As observed in Fig. 7, obtained results are satisfactory for large discharges. It seems that some uncertainties may be observed for lower discharge as the
down-stream dam influence may be not very well repro-duced.
Figure 7. Calibration of the 1D model using measured water levels at different discharges.
A important challenge for the 1D but also 3D models when the description of the bathymetry is not precise enough is to properly describe diffluences. Flow repartition at diffluences is very sensitive to the flow direction and amplitude before and after the diffluence, and so very sensitive to the bathymetry and roughness repartition. Results from 1D et 3D modelling are presented in Fig. 8.
Figure 8. Comparison between 1D and 3D modelling for the water discharge repartition in secondary channels.
If both models yield similar critical discharges for overflowing in the secondary channels (Q ≈ 1000 m3/s), for larger discharges of the Rhône River, the 1D model yields discharges in the secondary channels two to three times larger than the 3D model. Even if one may expect more accurate results from the 3D model, since there is no discharge measurement to validate one or another model, it is difficult to conclude on this point. It should be noted that the significant sediment deposits that occurred
in the Beurre channel may also influence this flow repartition.
Both 1D and 3D numerical model do not compute bedload transport. However, for sediments smaller than 0.1 mm, it can be assumed than suspended load largely prevails.
4 ANALYSES OF THE BEURRE ISLAND MORPHODYNAMICS
4.1 Estimation of the SSM fluxes in the system Although, there are significant uncertainties on the flow discharges in the two secondary channels de-pending on the discharge in the main channel, it is possible to estimate the amount of fine sediments transiting into these channels. Using fit 3 for Eq. 1 and the 1D model, a first estimation of the total amount of fine sediment transiting yearly in the two secondary channels is 18,000 and 30,000 tons for the Beurre and Chèvre channels, respectively. It repre-sents only 2% of the total yearly SSM flux in the Rhône River (22×106 tons). In Fig. 9, one can ob-serve that how significant is the input of major floods. Thus, most of the SSM input in the occurred in 2001 and 2002, during the two decennial floods.
Figure 9. Estimation of the annual SSM fluxes entering the two secondary channels
A comparison can be made between this first es-timate of SSM transiting in the two secondary chan-nels and the volume of sediment deposited (M=
ρ
s (1-p)V whereρ
s=2650 kg/m3 is the sediment densityand p=0.4 the porosity of the deposits). It appears that around 10% of the SSM transiting in the Beurre channel deposited within the reach. However, a more detailed study of Fig. 3b indicates that the mount of deposits within the Beurre channel is not much ger during the year 2002. This may suggest that lar-ger bed shear stress occurring in the Beurre channel during large flood limit the amount of fine sediment deposits.
4.2 Bed shear stress calculations
To better understand the impact of bed shear stress on the fine sediment deposits, they were computed for different values of the Rhône River discharge us-ing the followus-ing equation:
2 3 / 1 2 U H K g ρ τ = (6)
where ρ=1000 kg/m3 is the water density, g the ac-celeration of gravity, K is the Strickler coefficient , and H the section-averaged water depth.
It appears that bed shear stress is proportional to the Rhône River discharge in the Chèvre channel. For the Beurre channel, a maximum of bed shear stress is observed for Q = 2000 m3/s. For a larger discharge, the water level after the confluence with the Chèvre channel seems to limit flow velocities and so bed shear stress. However, a comparison of the 1D and 3D models indicates that for the same discharge in the secondary channels, the 1D model tends to overestimate bed shear stresses especially in the downstream part of the Chèvre channel.
4.3 Common test scenario for the 1D and 3D
modelling
A common scenario has been tested to compare the two models based on the 2009 bathymetry. The up-stream hydrograph (Fig. 10a) has been built based on a discharge frequency analysis and using a flood-shape hydrograph (flood rise and fall), which lasts 7 days. In order to get the yearly averaged bed evolu-tion, the final bed evolution from this test scenario have been multiplied by a factor 50.
(a) (b)
Figure 10. Upstream (a) and downstream (b) boundary condi-tions for the test case.
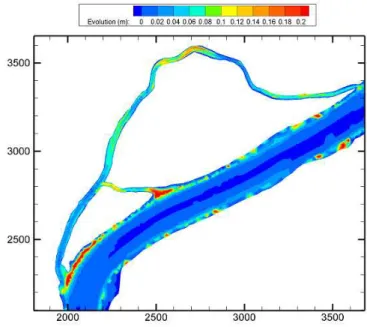
Results obtained for the 3D model are in agree-ment with measureagree-ments (10 cm of deposits in the Beurre channel and 5 cm in the Chèvre channel) al-though some underestimation is generally observed, especially in the downstream part of the Chèvre channel (Fig. 11). It also showed that most of the deposition occurs for discharges between 1000 and 3000 m3/s. For larger discharges, one can observe locally some erosion, especially in the upstream part of the Chèvre channel. Significant erosion occurred during the flood rise but is often compensated by a larger deposition during the flood fall.
In tab. 1, a sensitivity analyses is presented on the effect of the choice of aPD and aC (with aPD× aC
= 1×10⁻⁴) on total amount of sediments deposited in the different sub-reaches reaches for 1D computa-tions. It appears that aPD directly influences the amount of sediment deposited or eroded whereas the choice of aC impacts the net tendency for erosion or
deposition. In general, Adis-TS tends to predict de-posits 5 to 10 times larger than Telemac3D for this test case. It also tends to overestimates deposits in the Chèvre channel compared to the Beurre channel since data show an opposite behaviour (see Tab. 2). The 3D model appears more accurate for the reparti-tion of the deposits. As observed in Fig. 11, these deposits would be located mainly on the main chan-nel margins and close to the entrance of the Beurre secondary channel.
Figure 11. Bed evolution obtained using Telemca3D
Table 1. Estimation of the deposits (in tons) in different sub-reaches for the test case (7 days); sensitivity on the coefficients
aPD and aC for the 1D model.
Adis-TS aPD aC Chèvre up Chèvre-mid Beurre up Beurre mid Beurre down 0.1 1×10⁻³ 7.6 14.9 1.4 1.7 2.6 0.2 5×10⁻⁴ 17.9 26.6 6.7 7.9 5.6 1.0 1×10⁻⁴ 55.7 58.2 28.4 28.8 13.3 Telemac3D 0.4 1.3 0.2 0.2 0.6
An interest of the 1D model is to present the re-sults for different class of sediments. In Fig. 12, one can observe that the coarser class (class 3 with d = 50 µm) represents 30% of the total deposits whereas consists in only 10% of the SSM total mass. On the other hand, the finest class (class 1: d = 8 µm) ) represents only 30% of the total deposits whereas consists in 65% of the SSM total mass. These results are in good agreement with experimental data and give an indication of the sensitivity of the settling velocity (which is basically a function of the grain size) on the amount of sediment deposited.
Figure 12. Distribution of the deposits in the three main parts of the secondary channels using Adis-TS as a function of the size of the particles (aPD = 0.2 and aC = 5 × 10⁻⁴ g/l).
4.4 Long-term simulation using the 1D model Using Adis-TS model, it was also possible to di-rectly simulated the amount of sediments deposited in the two secondary channel using the real dis-charge time-series from 2002 to 2010 with an ge-ometry based on the 2002 topography. For this simu-lation, the following coefficients have been used:
aPD = 0.2 and aC = 5 × 10⁻⁴ g/l. In order to compare
directly numerical results to experimental results, experimental volumes of sediments deposited or eroded were calculated using the following equation:
∑
− ∆ − = − − i i j i m j i m j j x L z z T T V ( ) ) ( 1 1 , , , , 1 (7) where Tj is the year of measurements, zm,i,j is themean bed level of the active channel for the cross-section i and year j (see Fig. 3), Li the width of the
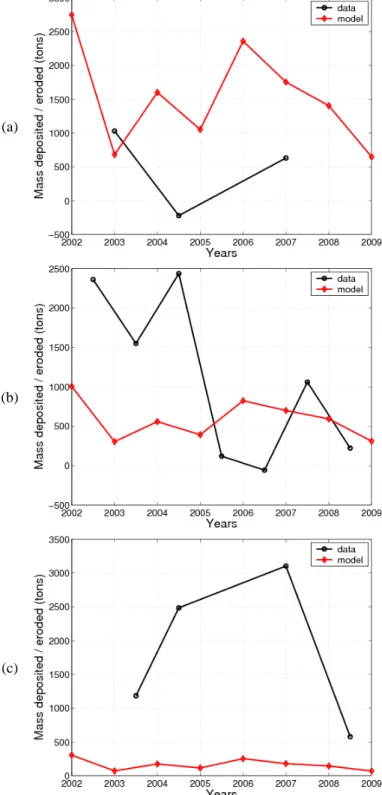
active channel, and ∆xi =(xi+1 −xi−1)/2 the char-acteristic streamwise length for the cross-section i. Results from this simulation are presented in Fig. 13 for the three main part of the secondary channels. Results are very encouraging for the up-stream part of the Chèvre channel and Beurre chan-nel. A similar order of magnitude may be observed for the yearly bed evolution. However, the model seems to be not sensitive enough to the input from large flood. Also, as there is no update of the bathymetry, no feedback from the deposits on the dynamics can be observed on the contrary to what the experimental results suggest. Indeed, after the large deposits that occurred from 2002 to 2004, the deposition rate dropped significantly. On the other hand, Adis-TS did not reproduce correctly the depo-sition in the downstream part of the Chèvre channel. This may be due to an underestimation of the water stage on the Rhône River next to the downstream connexion, which has led to an overestimation of the velocities and bed shear stress, and so, an underesti-mation of the deposits. The impact of the St-Pierre-de-Boeuf dam regulation on the water level does reach the Beurre island despite of the distance
(a)
(b)
(c)
Figure 13. Yearly bed evolution of the upstream part (a) and downstream part (c) of the Chèvre channel (Grande lône), and (b) the Beurre channel (Petite lone).
Global results for each sub-reach using Adis-TS are presented in Tab. 2. It appears that the calcula-tion based on reference test case tends to overesti-mated deposition compared to the calculation based on the discharge time series although the geometry (based on 2010 bathymetry) would lead to opposite results (all other parameter are identical). Compared to the experimental data, as observed previously, it appears that deposition is overestimated in the up-stream part of the Chèvre channel and underesti-mated in the downstream part.
Table 2. Estimation of the deposits (in tons) in different sub-reaches from 2002 to 2010.
Calculation upstream Chèvre Beurre
Chèvre down-stream Based on the reference
test case 18700 6150 2350 Based on the discharge
time series 12250 4700 1300 Measurements 1400 7700 7350
5 CONCLUSION
Two numerical models (1D and 3D) have been used to better understand the dynamics of the deposits that have been observed in two secondary channels located next to the Beurre island on the Rhône River, France. Several issues linked with the lack of data arose thanks to this study:
- deposit characteristics (total volume and grain size diameter) are extremely sensitive to the imposed upstream SSM concentrations and quality. However, there is a serious lack of data to characterise this parameter espe-cially during large floods;
- discharge distribution at diffluence may be correctly simulated if detailed bathymetry and discharge measurements were available, which is not the case. Large difference were observed between the two models. The 3D model should be more accurate but still needs data for validation;
- downstream water stage may also have a sig-nificant influence on the deposition rate in the downstream part of the secondary chan-nel.
Despite these difficulties, both models were able to reproduce qualitatively (and even quantitatively for the upstream part of the Beurre channel using the 1D model) the long-term dynamics of these secon-dary channels. Most of the deposits occurred for dis-charge of the Rhône River between 1000 and 3000m3/s. For larger discharge, erosion during the flood rise limits significantly the total deposition. It also seems that sediments propagates within the sec-ondary channels for intermediate discharges. Dis-charges in the Rhône River above the one year return period flood yield approximately 50% of the fine sediment mass transiting in the secondary channels, which represents approximately 1% of the total SSM fluxes. And 1 to 10% of these fine sediments ap-peared to settle down.
Some additional data (discharge measurements in the secondary channels, SSM characterisation at Ternay) will be carried out to improve the actual re-sults. The calibration of the source term in the Adis-TS model may also be improved using a more exten-sive sensitivity analysis.
6 REFERENCES
Andries, E., Le Coz, J., Faure, J.B., Camenen, B. & Launay, M. (2011). Impact of dam flushes on bed clogging in a secon-dary channel of the Rhône river. RCEM conference, Bei-jing, China, CDRom, 8 pages.
Camenen B. (2007). A simple and general formula for the set-tling velocity of particles in suspension. J. Hydraulic Eng, 133(2): 229-233.
Faure J.-B. (2009). Résolution des équations de Barré de Saint-Venant 1D en réseaux complexes [Resolution of the Barré de Saint Venant equations in complex networks]. Technical Report, Cemagref 190 (in French).
Faure J.-B. (2012). Document de conception d’Adis-TS. Tech-nical Report, Irstea (in French).
Fraselle, Q., Bousmar, D. & Zech, Y. (2010). Experimental in-vestigation of sediment deposition on floodplains. Proc. River Flow 2010 International Conference on Fluvial hy-draulics, Braunschweig, Germany, pp. 823-830.
Hu, C., Ji, Z. & Guo, Q. (2010). Flow movement and sediment transport in compound channels, Journal of Hydraulic Re-search, 48(1): 23-32
James, C.S., (1985). Sediment transfer to overbank sections, Journal of Hydraulic Research, 23(5): 435-452.
Krone, R. (1962), Flume studies of the transport of sediment in estuarial shoaling processes : final report, Technical report, Hydraulic Eng. Lab. and Sanitary Eng. Res. Lab., Univer-sity of California, Berkley, California, USA.
Nicollet G. & Uan M. (1979). Écoulements permanents à sur-face libre en lits composés [Steady open channel flows in compound channels]. La Houille Blanche 1: 21-30 (in French).
Partheniades, E. (1965). Erosion and Deposition of Cohesive Soils. Journal of Hydraulics Division 91:105-139.
Sellin, R.H.J. (1964). A Laboratory Investigation into the Inter-action Between the Flow in the Channel of a River and that Over its Flood Plain. La Houille Blanche 7: 793-802. Sogréah (2000). Étude globale pour une stratégie de réduction
des risques dus aux crues du Rhône : Étude du transport sol-ide [Global study for a strategy of risk attenuation to the Rhône River floods : study of sediment transport] Technical Report, IRS (in French).
Ternat, F., Boyer, P., Anselmet, F. & Amielh, M. 2008, Ero-sion threshold of saturated natural cohesive sediments : Modeling and experiments, Water Resources Res. 44(W11434) 1-18.
Acknowledgements
This research was supported by the Metro though the Axelera - PCB project. We would like to acknowl-edge people from the Nature Observation Centre of the Beurre island who provided us the bathymetric data and the 2009 grain size characterisation of the secondary channels.