Quantifying the Laffer Curve on the Continued Activity Tax in a Dynastic Framework
Texte intégral
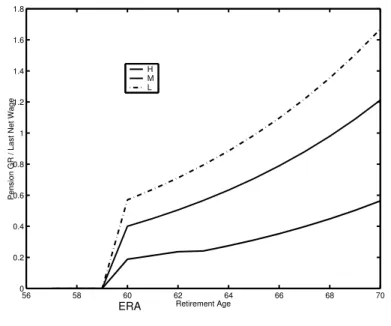
Figure

Documents relatifs
Prices and nutrient elasticities are then calculated to deter- mine whether a fat tax can substantially alter French household intake of saturated fat and cholesterol as well as
With consolidation first, all profits and losses from the companies of a group in differ- ent Member States would be added up, to reach a net profit or loss for the group’s entire
In contrast, when the polluting industry is competitive, the second-best emissions tax is lower than the marginal damage of emissions only in the case of incoming
Journalists’ interest in a rather small antitax movement can be explained by the scale of the actions they took (especially when it came to the ransacking of tax offices)
User-generated Content (Personal) Data Blockchain Online Advertising Cloud Computing Income
Research question: How can problems related to the taxation of the digital economy be solved: by modifying the PE concept or completely switching over to destination-based.
However, analysis of the nutrient shares of different foods, which refers to the proportion of nutrient i=1,...,32 contributed by food category j=1,...,24, indicates that the
Because of the di ff erence from the finite symbolic dynamical systems and of the observed new phenomena, contin- ued fractions attracted much attention.. Besides a detailed
