IX.
COMMUNICATIONS RESEARCH
A. MULTIPATH TRANSMISSION
Prof. L. B. Arguimbau J. Granlund E. H. Gibbons, Jr. W. L. Hatton
J. D. Luse
1.
Speech and Music
Work on the reception of frequency-modulated signals has consisted of
two parts: construction of an automatic-volume-control or pre-limiter for the receiver, and a preliminary survey of the possible applications to broadcast receivers.a. Automatic Volume Control
The receiver used for the tests already reported has been able to separate two signals differing by 5 per cent in voltage, provided the sig-nal level of the larger sigsig-nal is confined to a relatively narrow range of signal levels, about 10:1. This was felt to be inadequate for field condi-tions; some sort of automatic volume control was indicated.
It should be noted that the original receiver was able to reduce a dynamic 40:1 change in level to a 1 per cent change (a reduction of 70 db in the amplitude variation). However it was not able to do this for wide changes in input level.
Conventional automatic-control circuits are likely to have two defects: they are slow acting and they cause the frequency characteristic to depend upon the level. For these reasons we decided to substitute extra limiter stages.
The added limiter consisted of four stages of the crystal type pre-viously described in these reports, but not using any bias. The static limiter action is shown in Figure IX-1. It will be noticed that an input variation from 400 Iv to 4 v is reduced to a variation from 0.28 v: 0.66 v, a reduction of over 70 db in amplitude variation. This makes a total
limiter action of something like 140 db.
A qualitative dynamic test was made to see that the automatic volume control was really effective. It has been shown that the laboratory recei-ver is able to separate a desired signal from a smaller one, provided the level difference is greater than a fractional decibel. Table I shows this critical level difference as a function of the larger signal input level. The large change near a half millivolt is due to residual noise.
Figure IX-1 and Table 1 will be found on the following page.
(IX. COMMUNICATIONS RESEARCH)
G-o-o-0.
elN IN VOLTS
Fig. IX-1 Static characteristic of four-stage limiter. TABLE I
Input Voltage (Cpv)
30050
15
3
1.5
0.5
Critical Level Difference (db)
0.3
0.4
0.95
1.0
1.27.0
b. Comparison With Present Techniques
It is well known that frequency-modulated transmission reduces the
interference from that obtained with amplitude modulation. It was thought
useful to see whether or not the techniques used in the extremely
cumber-some laboratory receiver would indicate the possibility of making
substan-tial improvements in broadcast reception over present FM practice. For
this purpose three high quality console-type receivers were borrowed andchecked for co-channel interference suppression.
The laboratory receiver was found to discriminate between signals
having a level difference of about a half decibel. The commercial receivers
differed very little among themselves, requiring a level difference of
(1) tj -J 0 z O.
I I
1 1
111
0.001I
111ll
'1
1
Il l'
I 1111111
X.V-00W-0-I
I
i
111111.
(IX. COMMUNICATIONS RESEARCH)
almost 15 decibels for comparable separation. On the same basis, amplitude-modulation receivers require about 30 decibels. Thus the improvement over AM in noise suppression for commercial FM receivers appears to be only half
of that theoretically obtainable.
c. Study of a Commercial FM Receiver
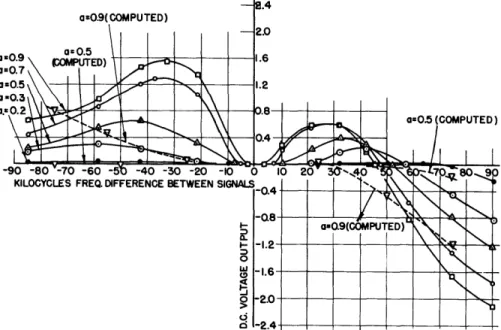
An "ideal" frequency-modulation receiver gives a rectified output which varies linearly with the instantaneous frequency of the input signal and is independent of its amplitude. If two unmodulated carriers of slight-ly different frequencies are superimposed, the instantaneous frequency of the resultant varies at a difference-frequency rate in the manner that has been described in these reports. However, as was previously mentioned, the time average of the resultant frequency is exactly the frequency of the larger signal. This rule provides the basis for a simple critical test on receiver performance. Thus if two signals are applied to a receiver simul-taneously, the direct output should correspond to that obtained with the larger signal alone. Imperfections are shown up as variations in the recti-fied output.
A typical set of data illustrating this test is shown in Figure IX-2.
Fig. IX-2 Average output voltage of commercial receiver with the stronger signal at center frequency.
The standard limiter and discriminator combination from a very high grade commercial receiver was tuned to a large unmodulated signal. A second
_I~ ~_ _1---^-.1_-^1---~ -- 1-111~-~-~~ i. .... . -~-- ..--1-- _I-.-I. ....-~.I_). L ..~l ..~~^_ --L1I11-. ..-. -_L-_~~III -.- .II1I11I--IIIIII .-~L^-llllllil~ ~i
lIi~--(IX. COMMUNICATIONS RESEARCH) unmodulated signal of relative amplitude, a (a < 1), and differing from the
center frequency by Af, was superposed. It was found that large relative changes in the direct output resulted. The data in Figure IX-2 is normal-ized by dividing the actual output by the output corresponding to a
75-kilocycle deviation.
The dotted curve shows the result that might have been expected had the static curves for the limiter and discriminator applied under dynamic conditions. This indicates that the limiter and discriminator time con-stants had an important influence on the performance.
2. Television
To the system shown in the block diagram of the last report has been added a variable frequency oscillator to replace the crystal oscillator in the transmitter. The purpose of this is to study the effect of radio-frequency phase difference between the two paths. The most obvious way to change the radio-frequency phase, and the way that changes occur in prac-tice, is to change the path length on one of the paths. This is rather clumsy in the laboratory and involves the use of quite a length of line stretchers. It is much easier to change the frequency by a small amount. With constant delay, the phase is proportional to the frequency.
The effect of radio-frequency phase on AM can be shown by a vector diagram, Figure IX-3. The two signals at the receiver are represented at any instant by two vectors, the larger of amplitude 1 and the smaller of amplitude a. For the instant under consideration, the relative amplitudes remain constant as does the relative phase 5.
Fig. IX-3 Vector diagram showing resultant
of two interfering signals.
It can be seen that if 6 is in the neighborhood of zero, the sum of the two,
>
, is larger than unity, and for b in the neighborhood of r, the sum is less than unity. As the carrier is modulated, a changes frominstant to instant, but the relative phase 6 changes slowly due to moving objects and atmospheric changes in the transmission path.
Due to the block positive standard of modulation, 6 near zero gives black ghosts on a white background and nothing on a black background.
(IX. COMMUNICATIONS RESEARCH)
6 near
7gives white ghosts on a black background and black ghosts on a
white background. However, a television picture consists of a large number
of areas of different shades, and it is hard to analyze individual ghosts.
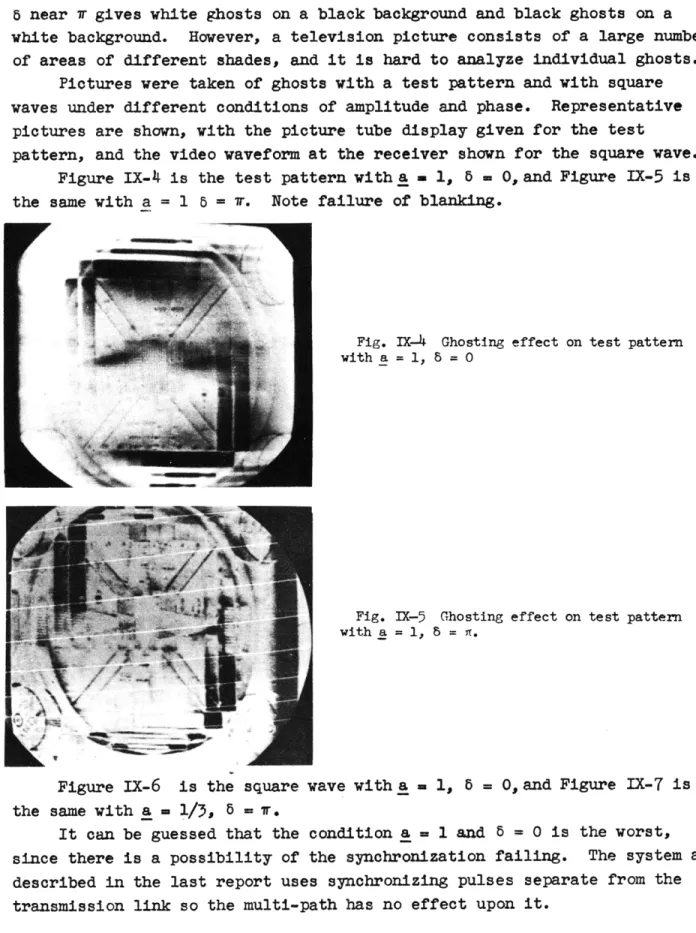
Pictures were taken of ghosts with a test pattern and with square
waves under different conditions of amplitude and phase. Representative
pictures are shown, with the picture tube display given for the test
pattern, and the video waveform at the receiver shown for the square wave.
Figure IX-4 is the test pattern with
a
1, 6 = 0, and Figure IX-5 is
the same with a = 1 5 = 7r. Note failure of blanking.
Fig. IX-4 Ghosting effect on test pattern with a = 1, 8 = 0
Fig. IX-5 Ghosting effect on test pattern with a = 1, 8 = r.
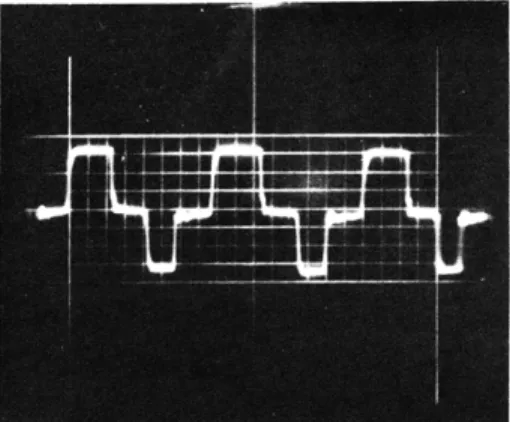
Figure IX-6 is the square wave with a = i, 6 = 0, and Figure IX-7 is the same with a = 1/3, 6 =
r.
It can be guessed that the condition a = 1 and 6 = 0 is the worst,
since there is a possibility of the synchronization failing. The system as
described in the last report uses synchronizing pulses separate from the
transmission link so the multi-path has no effect upon it.
(IX. COMMUNICATIONS RESEARCH)
Fig. IX-6 Ghosting effect on square wave video signal with a = 1, 5 = 0.
Fig. IX-7 Ghosting effect on square wave video signal with a = 1/3, 5 = A.
To study the possibility of loss of synchronization, a commercial re-ceiver connected to two antennas was used to pick up a local station. By rotating and moving the antennas, the amplitude and phase of the two re-ceived signals could be varied. The critical point was reached, and as was expected, the receiver sweep fell out of step. However, the sweep circuits could look if either antenna moved slightly in the wind. The receiver used an automatric frequency control in its horizontal sweep circuit and probably fared better than receivers with simpler sweep control systems. Nevertheless, it can be said that the loss of synchronizing is an effect that would occur
only under rare conditions in practice and could be easily corrected by moving the antenna.
The AM system tests are now completed, and the next project is to construct an FM system,
B. MICROWAVE MODULATION TECHNIQUES
L. D. Smullin
W. E.
J.
Jensen
Vivian
(IX. COMMUNICATIONS RESEARCH)
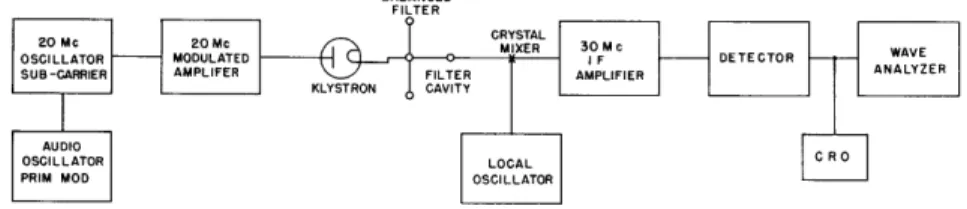
1. Investigation of Frequency Modulation of a Reflex Klystron The set-up being used at present for the study of the sub-carrier modulation of a reflex klystron is shown in the block diagram of Figure
IX-8.
Fig. IX-8 Block diagram of circuit for study of the sub-carrier modulation of a reflex klystron.
The 20 Mc sub-carrier can be either frequency-or amplitude-modulated. The output of the modulation amplifier is applied to the repeller grid of the 726C klystron. A balanced filter of the quarter-wavelength hybrid ring type with a transmission cavity in each side-arm is placed in the klystron output line. Each side-arm cavity is tuned to the carrier frequency, which will therefore be absorbed in the matched loads terminating the cavities
as shown in Figure IX-9.
Fig. IX-9 Balanced filter circuit for
rejecting carrier frequency.
The sideband frequencies will be reflected by the cavities, and will reach the output line of the filter. An additional cavity in the output
line acts as a band-pass filter to the first sideband frequency.
The desired signal, centered about the first sideband, is recovered by beating the first sideband with the output of a local oscillator, giving an i-f at 30 Mc which is amplified and detected. The recovered primary sine-wave modulation is analyzed for harmonic content in a General Radio Wave-Analyzer.
A number of measurements have been made on this equipment. The data obtained for the distortion when the sub-carrier is amplitude-modulated (and amplitude-detected) seem to indicate that the first-order effect is
(IX. COMMUNICATIONS RESEARCH)
that caused by the curvature of the klystron mode IX-10.
as indicated in Figure
MODULATION
ENVELOPE
Fig. IX-10 Harmonic distortion caused by shape of klystron mode.
- - -
X
---- KLYSTRONVOLTAGE OUTPUT
TIME
REPELLER VOLTAGE
Some measured values of the second and third harmonic of a 1 Kc wave are shown in Figure IX-11. The numerical values should be considered approximate since it has not been definitely established that all of the
Fig. IX-11 Harmonic die-tortion for amplitude
modu-lated sub-carrier, 1 kc.
O 2 4 6 8 10 12 14 16 18 20 22 24 26
MOD. VOLTAGE IN VOLTS---- PEAK/r2_
measured distortion originates in the modulation process.
An attempt has been made to measure the harmonic distortion when the sub-carrier is frequency-modulated. Measurements at 1 Kc indicate that the distortion is less than 1 per cent independent of the amplitude of the modulating voltage from 0 to 30 volts. When the sub-carrier is amplitude-modulated either frequency or amplitude modulation may be detected in the
final output. Preliminary measurements at 1 Kc indicate a distortion in
the order of 1 per cent when the signal is frequency-detected.
VOl
(IX. COMMUNICATIONS RESEARCH)
Amplitude modulation of the sub-carrier results in frequency modulation
of the sidebands (and of the carrier). A check at 1 Kc shows harmonic
dis-tortion in the order of 1 per cent for high modulation voltages (16-30 volts).
It seems therefore that it is possible to amplitude-modulate the sub-carrier
and to detect the resulting frequency modulation caused by the asymmetrical
mode shape. This possibility will be explored.
C.
STATISTICAL THEORY OF COMMUNICATION
Prof. J. B. Wiesner
N. H. Knudtzon
Prof. W. B. Davenport, Jr.
E. R. Kretzmer
Prof. R. M. Fano
A. J. Lephakis
Prof. Y. W. Lee
L. Levine
T. P. Cheatham, Jr.
H. E. Singleton
E. E. David, Jr. B. Steinberg
L. Dolansky C. A. Stutt
1. Auto-Correlation Function
a. Correlation Functions
The use of the correlator in the analysis of random time functions has
continuted in the following areas of study:
1. random noise (crystal, thermal, and shot)
2. speech
3. physiological data (heart beats, parts of the auditory
system)
A sufficient number of correlation functions has not been accumulated
to justify any detailed reporting here on these fields of investigation.
Two reports are in preparation covering the results to date on the
use of correlation in the detection of signals and on the philosophy and
methods of measuring correlation functions.
Prof. J. B. Wiesner, Prof. Y. W. Lee, T. P. Cheatham, Jr.
b. Auto-Correlation Functions of Random Noise
An experimental study of statistical characteristics of filtered
random noise has been finished. The results will be published in R.L.E.
Technical Report No. 115 now being prepared.
Prof. J. B. Wiesner, Prof. Y. W. Lee, N. H. Knudtzon
c. Digital Electronic Correlator
Design and construction of the digital correlator are nearly complete.
The final units are being wired, and work is now being directed toward
___~,. ..~~.~~,~..~--~.~--~-- -- ~--- - -l -~l---ussl*- l -rrr---r~ll--- -- l-~suusU~~surrrrrrPr\ilulr~rwr~ ssr~(IX. COMMUNICATIONS RESEARCH)
getting the various units assembled and functioning as a whole.
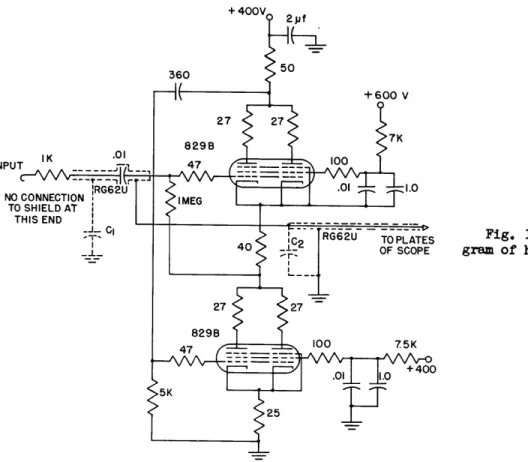
A circuit diagram of the pulse generator and high speed flip-flops used in the number generator is shown in Figure IX-12. The pulses at the
TO SUCCEEDING
STAGES
Fig. IX-12 Circuit diagram of the pulse generator and high speed flip-flops used in the number generator.
output of the pulse generator are 0.02 P sec in duration, and the counter operates at 10 megacycles per second. In connection with the testing of these circuits a high-impedance probe was developed (in cooperation with A. J. Lephakis). The circuit diagram is shown in Figure IX-13. The probe has a rise time of 0.25 x l0 " 9 sec per volt, and a somewhat faster fall time, under the condition that C1 + C2 = 100 I4f.
Prof. Y. W. Lee, H. E. Singleton, L. G. Kraft, Jr. 2. Amplitude and Conditional Probability Distributions
of a Quantized Time Function
Accuracy checking of the amplitude distribution analyzer, discussed in previous progress reports, has been completed. Preliminary results indica-ted that it was necessary to increase the precision of the controls used to set the limits, and the center, of the voltage interval being studied. The necessary changes have been made, and this equipment is now working satisfactorily.
The zero-crossing period distribution analyzer discussed in previous progress reports has been designed and constructed. This apparatus con-sists of two units to be used in conjunction with the level selectors and conditional probability delay unit of the amplitude distribution analyzer.
(IX.
COMMUNICATIONS RESEARCH)
360
Fig. IX-13 Circuit dia-gram of high impedance probe.
The first of the new units is a clipped-wave generator. This unit transforms the voice wave into a rectangular wave whose zero-crossings coincide with those of the voice wave. The measured effective clipping level at the input of this unit is 1.1 millivolts (peak to peak). Thus, if the wave being studied has a peak-to-peak range of 1.1 volts, a 60-db clipping ratio is obtained. The clipped wave generator has been tested, and is working satisfactorily.
The second of the new units is a zero-crossing pulse generator. This unit converts the clipped wave mentioned above into constant duration pulses. Each of these pulses occurs at a zero-crossing and has an amplitude propor-tional to the preceding zero-crossing period. This unit has been construc-ted, but has not yet been tested.
For various reasons, it has been decided to study speech recorded in an anechoic chamber. A magnetic-tape recording system has been obtained for this purpose. Measurements on this apparatus indicate that its fre-quency response is flat to within + or - 2 db from 20 cps to 16 K cps, and that the maximum undistorted signal-to-noise ratio is about 47 db.
These characteristics are satisfactory.
Prof. W. B. Davenport, Jr.
INI
(IX. COMMUNICATIONS RESEARCH)
3.
Optimum
Prediction
A demonstration of Wiener's theory of prediction in the case of
filtered noise has been completed. A technical report on this subject
is
now being prepared.
As was stated in the last quarterly report, the input voltage to the
predictor was simply white noise which had been passed through a tuned
circuit. As evidence of the predictor capabilities of the circuit,
the
input and output waveforms of the prediction have been simultaneously
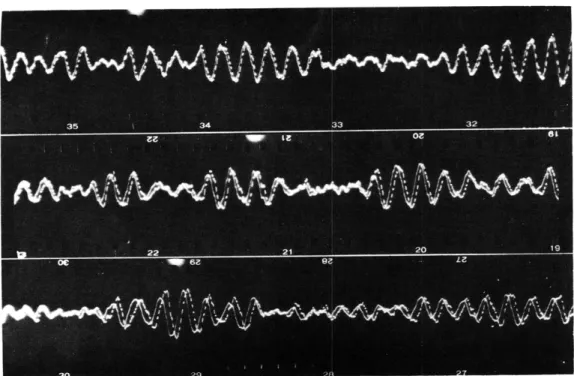
recorded on film with aid of a two-beam oscilloscope. Typical
sections of
this film,
taken for three different prediction times, are shown in
Figure IX-14 and
Figure
IX-15
for filter Q's of ten and ninety,
respective-ly.
The dotted curves
are the predictor input; and the solid ones, the
Fig. IX-14 Demonstration of prediction. Predictor input is dotted; predictor
out-put is solid. Q = 10; f = 1080 cps. Prediction times (reading down): 0.06 millisec,
0.12 millisec, 0.18 milliosec. Past is to the left, future is to the right. Flash marks
on edge of film are 1/60 sec apart.
predictor output. Reasonably close agreement between the observed
predic-tion times and the design values has been obtained.
Prof.
Y. W.
Lee, C.
A.
Stutt
4.
Techniques of Optimum Filter Design
(IX.
COMMUIICATIONS RESEARCH)
Fig. IX-15 Demonstration of prediction. Predictor input is dotted; predictor
out-put is solid. Q - 90; f = 1080 cps. Prediction times (reading down): 0.06 millisec, 0.12 millisec, 0.18 milliosec. Past is to the left, future is to the right. Flash marks on edge of film are 1/60 sec apart.
Wiener optimum-transmission systems. Heretofore, the synthesis of opti-mum networks has been considered from a prescribed frequency response, but
it is now felt that much can be gained in the way of more accurate
approx-imations and greater ease in manipulating formulae if the synthesis is made from a prescribed transient response.
The impulse response of an optimum system is contained in the
Wiener-Hopf equation:
*mn (--c) = I h(t) 0 (7 - t) dt 7> 0
where *mn and tii are combinations of desired message and disturbance auto- and cross-correlation functions, h(t) is the impulse response, and a is the lead or lag time of the filter (+ for lead, - for lag). The
correlation functions used in the equation will be experimentally
deter-mined from the actual message and disturbance signals which are to be applied to the filter.
(IX. COMMUNICATIONS RESEARCH)
extract h(t), which in general contains an impulsive part and a continuous part, from the Wiener-Hopf equation. The next step is to obtain the poles
and residues (or zeros) of the network which has this transient response.
The impulsive part of h(t) yields to a simple solution in the synthesis
problem; however, a practical procedure for synthesizing for the
continu-ous part has not yet been found.
Upon completion of the procedures to be used in the first two steps,
it is tentatively decided to apply the theory to the design of optimum
filters for facsimile signals, wherein the desired message is the picture
signal, and the disturbance is random noise. For the first experiments,
these signals have the advantages of being readily reproducible and of having
easily controlled spectral distributions. Furthermore, the transmitted
pictures provide an excellent means for careful examination for the effects
of
optimum filtering, and the significance of the mean-square-error
cri-terion in picture transmission.
Prof. Y.
W.
Lee, C. A. Stutt
5.
Pulse-Modulation Studies
Technical Report No. 92 entitled "Interference Characteristics of
Pulse-Time Modulation" has been completed and distributed. This brings to
a close the current detailed study of pulse-duration and pulse-position
modulation.
Prof. J. B. Wiesner, E. R. Kretzmer
6.
Storage of Pulse-Coded Information
The four required deflection units, described in the last Progress
Report, have been constructed; also sufficient power supplies to operate
the low-voltage circuits of the storage system.
Construction of the control and gate generator units has been started.
The gate generator unit provides gates of the proper widths and amplitudes
which actuate the high-velocity gun, holding gun, and signal plate, of a
storage tube. Multivibrators are used as the basic gate generators. In
order to take advantage of the fact that the reading time of the storage
tubes is smaller than the writing time, separate sets of gates have been
provided for reading and for writing. Since all gate widths and amplitudes
have been made variable over wide ranges, the present unit will accommodate
future improved storage tubes.
At the beginning of a writing or reading interval, the holding gun must be turned off, then the signal plate must be raised to the proper potential, and then the high velocity gun must be turned on. At the end of the interval, the order of these operations is reversed. Therefore, if
(IX.
COMMUNICATIONS RESEARCH)
fast operation of the storage system is to be obtained, the rise-and-fall
times of the various gates must be kept small. Since the amplitudes of the
gates are large and the loads which must be driven are capacitive, cathode
followers are employed in the output circuits of the gate generator unit.
The average current drain of these circuits is kept reasonably small by
using large cathode resistors. The use of tubes which are capable of
conducting large surge currents results in small rise times; the large
cathode resistors improve the rise times by causing most of the surge
cur-rent through a tube to flow into the load capacitance. Small fall times are
obtained by using other tubes to discharge the load capacitances; these
tubes are triggered by pulses of suitable width and amplitude formed at
the negative-going edges of the gates.
The control unit determines which operation (reading or writing) is
taking place in each storage tube. It consists of an arrangement of gate
tubes which supply trigger pulses to the multivibrators of the gate
genera-tor units associated with each sgenera-torage tube, and of multivibragenera-tors which
generate the delays necessary for the signal plate and high-velocity gun
gates. The control unit gate tubes are operated by flip-flops which are
triggered by output pulses from the storage tube deflection units.
The following three provisions have been made for testing the storage
system:
a. A pattern can be manually written in one storage tube,
then this pattern can be read and transferred from one
tube to the other.
b. A pattern can be manually written in one storage tube,
then this pattern can be read and rewritten in the same
tube.
c. A single spot can be manually written in one storage
tube, then this spot can be read and transferred to
successive points in the same tube.
The radio-frequency reading unit and the
high-voltage power supply
are
the two remaining pieces of equipment which must be designed. This
work has been started.
A. J. Lephakis
7. "Felix" (Sensory Replacement)
The work on "Felix" has been in progress since December 1948. In the
present setup the speech is broken up into five channels by sharp cutoff
filters. The bandwidths of the filters are 0-400 cps, 400-800 cps,
800-1400 cps, 1400-2400 cps, and 2400-15000 cps. The envelope of the
voltage in each band is used to control the output of a 300-cps-note whose
(IX. COMMUNICATIONS RESEARCH)
amplitude is a direct function of the magnitude of the envelope voltage. The output of each modulator goes to one of five mechanical vibrators on which the fingers of either hand can rest. This type of transmission of
information is used for two reasons. First, the fingers are most sensitive to vibrotactile stimulation in the region of 300 cps. Secondly, the fingers cannot respond to amplitude changes of more than 20 cps, approximately the maximum frequency of the envelope in a given filter bandpass.
Although there is insufficient data to reach conclusions on the adequacy of the "Felix" apparatus, there is indication that a person can
learn rapidly if the tactile patterns of the words are different. With about twelve sessions of training of ten minutes each, the average subject has been able to learn twelve words with 91 per cent accuracy. This compares favorably with the percentage articulation in normal conversation. It has been difficult to determine to what degree failure to learn can be attri-buted to the inadequate training of the subject and to the shortcomings of the apparatus. Photographs have been taken of vibratory patterns of dif-ferent phonemes but the study is too incomplete to determine if each phoneme has a unique pattern. Measurements are also being made on the persistence of vibratory sensations.
One interesting sidelight of the work has been the determining of the manner in which people learn to differentiate the patterns of words. This has permitted the organization of an orderly learning program for the English language. It also may provide information of some value to psy-chologists who are interested in the aspects of learning primary and un-familiar tasks.
Because mechanical vibration requires the use of bulky equipment, and also because there may be a need for more than five channels, investigations are being made on the possibility of using electrical stimulation as a
substitute. It has been found that for sinusoidal stimulation there is a range of about 20 db between the threshold of feeling and the threshold of pain in the fingers. Furthermore, the absolute values of the currents in these thresholds tend to remain constant from one person to another. This suggests that a current generator, i.e., a pentode, will be adequate if provided with a limiter of some sort to prevent people from getting excessive shocks. Further investigations will be made in the future on
electrical stimulation. L. Levine
a. Bank Filters With Variable Bandwidth
(IX. COMMUNICATIONS RESEARCH)
feedback network in each channel has been completed. The band limits of the several channels are independently variable over ranges appropriate for use in project "Felix".
Prof. R. M. Fano, E. M. Howlett, A. M. Lang 8. Clipped-Speech Studies
After some consideration of the problem it appeared appropriate to delay the study of clipped speech in order to develop a new tool which will be useful in this and other studies. The new tool is a short time correla-tor which will make an analysis in the time domain, analogous to the analy-sis performed in the frequency domain in the visual presentation of speech.
It is intended to present the correlation function on a cathode ray tube, so that changes in the correlation pattern, which may be expected to occur at syllabic rate, can be observed. The correlation function of speech, which will be presented as a function of time T, is the running average over approximately 1/20 second of the product of the speech wave and the speech wave delayed by a time T. It may be possible to learn to recognize the auto-correlation pattern, in much the same way that visible-speech patterns can be recognized after training.
The Fourier Transform of the auto-correlation function of a stationary time series is the corresponding power spectrum, the spectrum being invar-iant with time. Consequently the Fourier Transform of the short time auto-correlation function will vary with time, and will be a spectrum similar to the frequency pattern of visible speech.
The correlator as at present envisaged, will be used to study the auto-correlation of speech waves and clipped speech, and the cross cor-relation between the two. Work is at present in progress on the design and construction of such equipment.
Prof. R. M. Fano, P. E. A. Cowley 9. Pulse-Code Magnetic Recorder
A complete playback system (including three different decoders) has been designed and built. Magnecord units PT6M and PT6A adapted for a tape width of 35 mm, have been used to drive the tape. The single-recording and playback head has been replaced by an asqembly of eight heads in order to make a simultaneous recording of eight pulses possible. A diagram of the tentative recording apparatus is given in Figure IX-16. The recorded sig-nal is a group of pulses, occurring every 40 ps. Only the pulses which
are needed to express the sample value at that instant, are present, but
(IX. COMMUNICATIONS RESEARCH)
Fig. IX-16 Block diagram of the recording apparatus.
these occur simultaneously. The rest of the channels are idle at that instant.
The electronic part of the playback apparatus is shown in Figure IX-17. The playback voltage is proportional to the rate of change of the
Channel
1
Channel
{
Channels 3 to 7
Fig. IX-17 Block diagram of the playback apparatus.
magnetic flux, and is therefore the derivative of the recorded waveform. At playback a rather steep zero-crossing corresponds to the maximum
value of the recorded pulse. After amplification of the playback signal, this zero-crossing is used to start the operation of a trigger circuit. The output of the trigger circuit (a very large negative peak) starts the one-shot multivibrator. Thus one new square pulse is generated for every
in
SObannel
1
I
Chanel 2 Chaals 3 to?J
ill----_-
---
)I~-_1I~-_.1~_11~1I
I~
Ll(_i
..
(IX. COMMUNICATIONS RESEARCH)
recorded pulse on the tape. The decoder gives to every pulse the proper amplitude according to the channel from which the pulse is coming, and subsequently adds the pulses of the same sample. The resultant signal, which now consists of pulses that are equally spaced and equal in time, is passed through a low-pass filter. The original audio signal is obtained at the output of the filter.
In the absence of the recording system the tests were restricted to single-channel recordings of pulses with constant repetition rate. The tape speed was 30 inches per sec. It was found that good operation could be more easily obtained at lower frequencies. However, with a strong
enough signal, reliable operation was obtained even at the highest possible pulse-repetition rate, i.e., at 25 kc. Since new pulses are generated during playback, it was not attempted to obtain exact equalization.
Of the three decoders, the current-adding scheme requires the least number of tubes; the cathode-follower scheme gives a slightly better wave-shape. The electronic-switch type is the most complicated, but it also
gives good results.
Having the playback output depend only on the zero-crossings of the amplified head-output, was found very advantageous. While the playback-head waveform changes considerably with frequency (between 10 and 25 kc),
the number of zero-crossings and their position remain the same.
Experimentally obtained waveforms are given in Figures IX-18 to IX-24. Figure IX-18 shows the playback head-output when recorded pulses had a repetition rate of 2.5 kc; Figure IX-19, the same for 25 kc. The peaker
output is shown in Figure IX-20, the multivibrator output in Figure IX-21,
and the decoder output in Figure IX-22. The pulse repetition in Figures IX-20 to IX-22 is 25 kc. For this frequency the filter output is a straight horizontal line. The filter response has been further improved so that now the loss at 20 kc is 46 db relative to the pass-band. If the frequency is reduced to 8 1/3 kc, as in Figure IX-23, the filter output
Fig. IX-18 Playback head output voltage. Pulse rep. rate, 2.5 kc.
(IX. COMMUNICATIONS RESEARCH)
becomes a sine wave; and at even lower frequencies, a damped sinusoid, as in Figure IX-24.
Fig. IX-19 Playback head output
voltage. Pulse rep. rate, 25 kc.
Fig. IX-20 Peaker plate voltage
waveform. Pulse rep. rate, 25 kc.
Fig. IX-21 Multivibrator output.
Pulse rep. rate, 25 kc. Connected to
current-adding decoder.
It should be pointed out, however, that under normal operating conditions, other pulses would be present between the pulses shown in Figure IX-24, and therefore the sinusoid would not decay as shown.
Further information about the work on this problem can be found in "Magnetic Recording of Sound by Pulse Coding", M. I. T. Thesis, May, 1949,
L. Dolansky. Prof. J. B. Wiesner, L. Dolansky
(IX. COMMUNICATIONS RESEARCH)
NO"
fan, r0% f."
r" om rm 0"
10. Statistical Investigation of Modulation Systems
It is planned to investigate and compare different communication sys-tems modulated by stationary time series such as speech and music. The study will be based upon the statistical data now being obtained by the Communication Group, and Wiener's least-mean-square criterion.
T. P. Cheatham, Jr., N. H. Knudtzon
Fig. IX-22 Current-adding decoder
output voltage. Pulse rep. rate, 25 kc
in channel No. 1.
Fig. IX-23 Filter output voltage. Pulse rep. rate, 8 1/3 kc.
Fig. IX-24 Filter output voltage. Pulse rep. rate, 500 cps.
(IX. COMMUNICATIONS RESEARCH) D. TRANSIENT PROBLEMS
Prof. E. A. Guillemin W. H. Kautz
Dr. M. V. Cerrillo D. M. Powers
1. Transient Theories
As pointed out in the last progress report, the solution of transient analysis and synthesis problems by means of the newly developed theories of integration hinges upon the availability of numerical tables of certain
"transient generating functions".* The most important of these are the functions of Lommel (1), the extended Airy - Hardy integrals (2), and Fresnel functions (3). In general, these generating functions are complex functions of one or more complex variables.
A project to compute tables of Lommel's functions,
JU(,T) = U2(n,T) + iUl(&,T) = lUlei'
(.,T) = V0 (,T) + IV1 (a,T) = ltleie
for i and T real, has been undertaken by the local Computation Laboratory, and is almost completed. The eight functions U2, U1, I11I, O, VO, V1 ,
v.I,
ande
have been tabulated to six decimal places for the rangesl = 0(0.5)15(1)30 and T = 0(0.5)15(1)20.
An earlier program to prepare a short table of Lommel's functions along radial trajectories in the R-T-plane,
= constant ,
for n and T real, has been completed, and those plots of I , I\, (, and e which were not presented in the last report are shown in the accompany-ing figures. Figures IX-25, IX-26, and IX-27 display the amplitudes 11 and
I
~.I as functions of T for various values of the ratio 2/T, while Figures IX-28 and IX-29 show the corresponding phase functions, 4 ande.
As in the previous plots, the sharp change in the magnitude functions in the vicinity of the 450 -line (il/T = 1) is plainly evident. These regions of the Lommel solids correspond to the line of formation of the transient wave, the sections to the right and left of the 450-line being associated with the beginning and end of the wave, respectively.Attempts to develop several asymptotic expansions of the Lommel
functions have been started. In certain regions of the Lommel solids, these expansions converge much more rapidly than do the usual series which define
These notions are discussed in detail in the forthcoming Technical Report No. 55.
(IX. COMMUNICATIONS RESEARCH)
the functions, and they may be used to replace the defining series in some applications, and to facilitate computation in these regions.
Complete tables and plots of these functions will appear in a sub-sequent technical report.
U.35 0.30 0.25 0.20 0.15 0.10 0.05 1.2 1.0 0.2 0.4 0.2 X 0."
T=L
2 3 4 5 6 7 8 9 10 1 12 13 14 15 16 I I 2.5 = I.25 0.8\/ ,=LO
/ 8 16 TFig. IX-25 and IX-26 The magnitude of Lommel's U-function along radial trajectories in the Q-T-plane.
Steps have been taken to prepare a very brief table of the three extended Airy - Hardy integrals:
1 ez3+Bz
f ,2, (B) = 7i
{fye
dz'1,
2,
3, (z)_~_
__L~_I_
11_
.--
1
_~11^
.1_ 1___-._1
~^1.-_.).-..__r
_4111
--(_11.(1-
11_~.1.
_..~li--
-yl.--^l_---~-_^_-).-
IC-~~-_~.~-~l- -1 .L ~-~--
L-
-~~. __
._ll--t-_-~.II__l-L-_
.I_. ~-i--
^~I-.
--.
---- ..1.^^.1.--
~-~-~-~-^LI_
C
r X // ' ,I~
~t' I
r
/I I
4
r'
4
1
--1
I I I(IX. COMMUNICATIONS RESEARCH)
Fig. IX-27 The magnitude of Lommel's \r -function along radial trajectories in the i -T-plane.
for complex B, where the contours l1, Y2, and '3 in the z-plane are radial
lines passing from the point at infinity to the origin and back to infinity, the radial directions in the three cases being - ir/3 to iw/3, iw to ir/3, and - ir/3 to - ir, respectively. The relations between the functions are:
f 2,3 (B) = e+iw/3 fl(-Beir/3)
These integrals are related to the better-known Airy integral, Ai(x), which is well tabulated (4), by the expression
fl(B) = 3-1/3 Ai(-3-1/3B) , for B real, and to the Bessel functions by
fl(B ) -B K (2(-B
(IX. COMMUNICATIONS RESEARCH)
Fig. IX-28 The phase * of Lommel's J -function
along radial trajectories in the S1-T-plane.
Fig. IX-29 The phase 8 of Iommel's V -function
(IX. COMMUNICATIONS RESEARCH) E. ACTIVE NETWORKS
Prof. E. A. Guillemin
Dr. M. V. Cerrillo J. G. Linvill
1. Broadband Amplifiers
The doctoral thesis, "Amplifiers with Arbitrary Amplification -Bandwidth Product and Controlled Frequency Characteristics", which is based on this research, has been submitted. Two technical reports are now
in preparation. The first report presents a new solution to the approxi-mation problem of network synthesis. The application of this approxiapproxi-mation
technique in the design of broadband amplifiers is covered in the second
report. J. G. Linvill
F. LOCKING PHENOMENA IN MICROWAVE OSCILLATORS
Work on this project has been discontinued temporarily. Technical
Report No. 100, "Some Aspects of R-F Phase Control in Microwave Oscillators", in manuscript, summarizes results obtained to this point.
References
(1) G. N. Watson, "Treatise on the Theory of Bessel Functions", Cambridge University Press, 1945; pp 537 - 550.
(2) Ibid; pp 320 - 24.
(3) D. M. Powers, R.L.E. Technical Report No. 125, in manuscript. (4) British Association for the Advancement of Science, Mathematical
Tables, Part-Vol. B, "The Airy Integral," (1946).
(5) Watson, loc. cit; p.190.