HAL Id: hal-02353077
https://hal.archives-ouvertes.fr/hal-02353077
Submitted on 20 Nov 2019
HAL is a multi-disciplinary open access
archive for the deposit and dissemination of
sci-entific research documents, whether they are
pub-lished or not. The documents may come from
teaching and research institutions in France or
abroad, or from public or private research centers.
L’archive ouverte pluridisciplinaire HAL, est
destinée au dépôt et à la diffusion de documents
scientifiques de niveau recherche, publiés ou non,
émanant des établissements d’enseignement et de
recherche français ou étrangers, des laboratoires
publics ou privés.
Predicting the quality of surgical exposure using spatial
and procedural features from laparoscopic videos
Arthur Derathé, Fabian Reche, Alexandre Moreau-Gaudry, Pierre Jannin,
Bernard Gibaud, Sandrine Voros
To cite this version:
Arthur Derathé, Fabian Reche, Alexandre Moreau-Gaudry, Pierre Jannin, Bernard Gibaud, et al..
Predicting the quality of surgical exposure using spatial and procedural features from laparoscopic
videos. International Journal of Computer Assisted Radiology and Surgery, Springer Verlag, 2020, 15
(1), pp.59-67. �10.1007/s11548-019-02072-3�. �hal-02353077�
videos
Arthur Derath´e1 · Fabian Reche1,2 ·
Alexandre Moreau-Gaudry1,3 · Pierre
Jannin4,5 · Bernard Gibaud4,5 · Sandrine
Voros1,5
Received: date / Accepted: date
Abstract Purpose Evaluating the quality of surgical procedures is a major concern in minimal invasive surgeries. We propose a bottom-up approach based on the study of Sleeve Gastrectomy procedures, for which we analyze what we assume to be an important indicator of the surgical expertise: the exposure of the surgical scene. We first aim at predicting this indicator with features ex-tracted from the laparoscopic video feed. Second, to analyze how the exex-tracted features describing the surgical practice influence this indicator.
Method 29 patients underwent Sleeve Gastrectomy performed by two con-firmed surgeons in a monocentric study. Features were extracted from spatial and procedural annotations of the videos, and an expert surgeon evaluated the quality of the surgical exposure at specific instants. The features were used as input of a classifier (linear discriminant analysis followed by a support vector machine) to predict the expertise indicator. Features selected in different con-figurations of the algorithm were compared to understand their relationships with the surgical exposure and the surgeon’s practice.
Results The optimized algorithm giving the best performance used spatial features as input (Acc = 0.68, Sn = 0.72, Sp = 0.7). It also predicted equally the two classes of the indicator, despite their strong imbalance. Analyzing the selection of input features in the algorithm allowed a comparison of differ-ent configurations of the algorithm and showed a link between the surgical exposure and the surgeon’s practice.
1Universit´e Grenoble Alpes, CNRS, Grenoble INP, TIMC-IMAG, 38000 Grenoble,
France
2Department of digestive surgery, CHU de Grenoble, Grenoble, France
3Clinical Investigation Centre – Innovative Technology, INSERM & CHUGA & UGA,
Grenoble, France
4Universit´e Rennes 1, LTSI - UMR S 1099, 35000 Rennes, France 5Inserm
Arthur Derath´e
Conclusion This preliminary study validates that a prediction of the sur-gical exposure from spatial features is possible. The analysis of the clusters of feature selected by the algorithm also shows encouraging results and potential clinical interpretations.
Keywords video-based analysis · surgical exposure · surgical expertise · laparoscopic surgery
1 Introduction
Minimally invasive surgery (MIS) offers better treatment conditions for the patient than open surgery, by reducing pain, hospital time and post-operative complications [1]. However, MIS is complex and stressful for the surgeon, and requires a long and expensive learning process [2]. Evaluating the surgeon’s expertise both during his/her apprenticeship and every day practice is an important aspect of this learning process. Traditionally, the surgeons’ training and practice are manually peer-reviewed by other surgeons, which is time consuming. This is why video-based assessment receives increasing interest. Moreover, it has the potential to offer feedback during the learning process.
Automatic information extraction from the video content is a prerequisite for an automatic assessment. Surgical process modeling (SPM) [3], and surgi-cal tool detection and tracking [4] can be automatisurgi-cally extracted to analyze and predict the surgical expertise [5]. A top-down approach is possible, in which the surgical expertise is considered as a whole and assessed with global evaluation scores. Based on surgical training videos, the OSATS score was predicted in order to discriminate levels of expertise [6], the ability of GOALS and MISTELS scores were compared in their ability to interpret the surgical expertise [7]. In [8], the OCHRA methodology was applied to rectal surgery, and surgical errors were analyzed through the procedural and spatial states of the surgery.
A bottom-up strategy is also possible. Indeed, surgical expertise is a very complex and multifactorial phenomenon [9], so studying factors separately is a consistent way of grasping specific aspects of this complexity. Many studies commonly deal with the level of expertise clustering problem to evaluate their method [10, 6, 11]. Some studies enhance this analysis and look for relations between expertise levels and extracted features processed by their model like intruments’ trajectories [12], movement metrics [13], or characteristic patterns of activities [14].
We chose a bottom-up approach and considered a specific aspect of the surgical expertise that we call Exposure of the Surgical Scene (ESS). This clin-ical criterion was deemed as crucial for the success of the surgclin-ical procedure by our expert surgeon partner. This exposure is characterized by the accessibility and visibility of the current surgical target along the surgery. Thus, a good ESS is characterized by a surgical space free of obstacle, to get a clear vision of the surgical target, and allow a good access of instruments to the surgical target (see Fig.1a). On the contrary, a non-optimal ESS is observed as the
(a) (b)
Fig. 1: Vision of the abdominal cavity during the ’Fundus Dissection’ step. The current surgical target is the greater curvature of stomach dissected from the gastrocolic ligament (a) Case of ’good’ exposure of the surgical scene -(b) Case of ’non-optimal’ exposure of the surgical scene
surgical space is tight, and the field of view is narrow or not centered on the surgical target (see Fig.1b). The objective being, for the surgeon, to maintain the ESS good enough, so that the surgery can progress correctly.
This study is a proof of concept. Our objectives are:
1. to predict the ESS quality metric based on features extracted from the procedural and the spatial aspects of laparoscopic videos of Sleeve Gas-trectomy,
2. to analyze how the algorithm selects features in different configurations of input data for predicting both the ESS quality and the practicing surgeon.
2 Material
The database is based on a cohort of 29 patients who underwent laparoscopic Sleeve Gastrectomy (LSG) at the CHU Grenoble Alpes. LSG is a bariatric procedure (surgical treatment of obesity) in which the stomach body is re-sected, which causes weight loss by restricting food intake (Fig.2). The surg-eries were performed by two confirmed surgeons with different expertise levels in MIS. One performed 15 surgeries, the other 14 surgeries. For each surgery, we recorded the endoscopic video feed of the complete intervention. During this procedure, we chose to focus on the ’Fundus Dissection’ (Fig.2a). This surgical step is critical in the overall success of the procedure [15], and predicting its quality gives a good indicator of the overall quality of the surgery.
Three distinct annotation datasets were manually created, and features were extracted from these annotations to obtain the input of our algorithm. First, a procedural annotation of surgical activities was performed manually by a scientist and an expert surgeon together, using the Annotate software (Surgery Workflow Toolbox [17]). In the surgical procedure, activities for both hands of the surgeon and both hands of the surgeon’s assistant were annotated. Procedural features extracted from this annotation process are described in Table 1. Mean and standard deviation of activities duration were computed
(a) (b)
Fig. 2: Critical steps of the Sleeve Gastrectomy [16] (a) Fundus Dissection -(b) Stomach Resection
from the durations of the successive activities along the procedure. Zero-order entropy is a measure of the activity variability, whereas first-order entropy quantifies transitions between activities. The exposure duration was defined as the duration between two successive ESS quality annotations. To compute pattern counts, we applied the method of shared longest frequent sequential patterns proposed by [18], to extract counts of the most frequent patterns for three types of activity patterns:
1. unique activity triplets 2. activities with unique verb 3. activities with unique target
Second, to annotate the ESS quality, we relied on the observation of one type of activity characterized by its verb ’sealing and dividing’. Each time this type of activity occurred in the procedure, the quality of ESS was evaluated as a binary score: 0 for ’non-optimal’ and 1 for ’good’ ESS quality. The accom-plishment of this specific activity is considered by our expert surgeon partner as a progress in the procedure, and thus a good checkpoint for evaluating the quality of ESS. This annotation was also done with our expert partner. Fig.3a presents the distributions of samples along surgeries. Fig.3b presents the ESS
feature name feature feature effector
type count count
mean/std activities duration float 2
4
activity zero-order entropy float 1
activity first-order entropy float 1 triplet of longest/shortest activity string 6
exposure duration int 1
count of activity pattern int 11
1
count of verb pattern int 10
count of target pattern int 16
Table 1: Description of the procedural feature vector (count=78), activities are formalized with the triplet <verb, instrument, target> [3] based on a
(a) (b)
Fig. 3: Statistics over samples of the database’s surgeries - (a) Count of ESS quality samples - (b) Ratio of the ESS quality classes along samples
classes ratio along each surgery, highlighting the imbalance between the two classes.
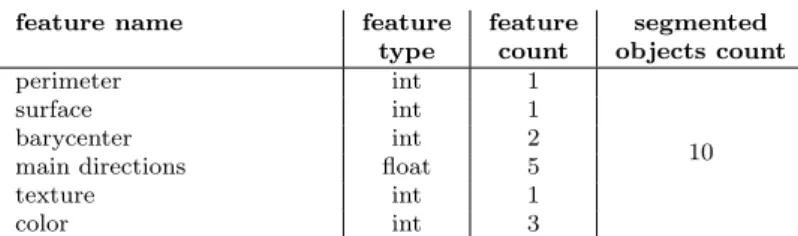
The third annotation is the segmentation of specific images corresponding to each ESS quality annotation. In the visual segmentation, all the visible objects (anatomical structures and surgical instruments) are contoured and labeled, so that pixels be exhaustively described. Three scientists segmented manually distinct sets of images. The segmentation environment was developed in CamiTK [19]. We extracted features for each segmented object (see Table 2). Perimeter and surface are pixel counts. Barycenter is the x and y coordinates of the central pixel. Main directions are calculated with a principal component analysis, they consist in the x and y coordinates of the two eigenvectors, and the ratio of the corresponding eigenvalues. The texture value is calculated by applying a local binary pattern algorithm [20] and computing the standard deviation of the texture Fourier transform histogram. The color is represented in the CIELAB color space.
feature name feature feature segmented
type count objects count
perimeter int 1
10
surface int 1
barycenter int 2
main directions float 5
texture int 1
color int 3
Table 2: Description of the spatial feature vector (count=130)
3 Methodology
In what follows we will note quality the ESS quality metric annotated as a binary class. The objective of this work was two-fold:
– we predicted the quality metric based on the different populations of fea-tures, with the help of the scikit-learn library [21]. Hyper-parameters of the algorithm were optimized to predict the quality metric.
– we analyzed how the input features were processed and selected, in order to observe the relations learned by the algorithm between these features and the predicted response. We considered two responses: the quality and the practicing surgeon (surgeon), which is also a binary class.
3.1 Predictive pipeline
The algorithm is a pipeline composed of three steps. The first step is an adap-tive preprocessing of the input data depending on data types (see Fig.4). As features are of various types (label, real number or duration), we chose to avoid losing information or mis-interpreting data by applying a type-specific encoding method. Labels were processed in a one-hot encoder. Real numbers were processed in a pipeline starting with a centering on the median, then a scaling of the data according to the interquartile range was performed, and finally a homogeneous discretization was applied. Duration values were pro-cessed in the same pipeline, but to tackle the wide distribution of time values, a base-10 logarithm was applied. The three outputs were concatenated in a vector of binaries.
The second step of the pipeline is a dimension reduction algorithm to re-duce the feature count in input of the classifier. We used a Linear Discriminant Analysis (LDA), and defined a hyper parameter variance ratio in [0, 1] as fol-lows:
variance ratio ≤ Σei (1)
where the ei are the eigenvalues selected by the LDA. Besides, we set a prior
statistic on the response to tackle the imbalance between both quality classes: ’good’=.17, ’non-optimal’=.83 (see Fig.3b).
Fig. 4: Adaptive pre-processing of the input feature vector
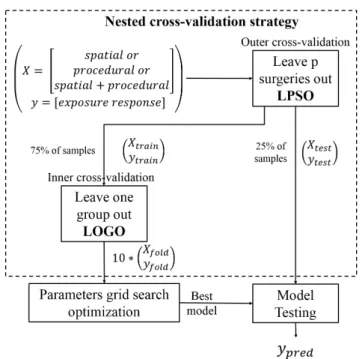
Fig. 5: Nested cross-validation strategy
The third step of the pipeline is the classifier predicting the score. We used a Support Vector Machine (SVM) with a radial-basis-function kernel, and optimized its parameters C and gamma. We set a prior on the response’s classes in the same fashion as for LDA.
3.2 Cross-validation strategy
Our cross-validation (CV) strategy is illustrated in Fig.5, and consisted in a nested-CV strategy to tackle the data bias (Fig.3) during the optimization process [22]. In the outer-CV, data is split between the train fold used for the model optimization (see section 3.3), and the test fold used for the evaluation
of this model. We defined a Leave-p-surgery-out (LPSO) strategy for the outer-CV. We assumed a dependency between the samples of each surgery, so each surgery appears solely in the train or in the test fold.
The inner-CV and the model optimization are done in the train fold. We applied a Leave-one-group-out (LOGO) strategy with 10 folds, and constrained the class ratio of each fold to be close to the class ratio of the whole database. We split samples from the same surgery between folds, to tackle the inho-mogeneous distribution of quality classes along surgeries (Fig.3b). Here, we violated our assumption of intra-surgery dependency of samples.
3.3 Hyper parameters optimization
We optimized the hyper parameters variance ratio, C and gamma of our pipeline algorithm in the train-fold of the CV environment (shown in Fig.5), and selected the model getting the best performances. In the inner-CV, we applied a grid search (GS) approach to browse every possible combinations of hyper parameters in specified ranges. The optimization was evaluated by a metric called the Optimized Precision OP [23], defined as:
OP = Acc − |Sn − Sp|
Sn + Sp (2)
With Acc the accuracy, Sn the sensitivity, and Sp the specificity. We chose this metric to avoid a poor learning due to our strong response class imbalance (see Fig. 3b), as it gives the same importance to sensitivity and specificity, observing respectively positive and negative classes.
3.4 Experimental optimization protocol
In the GS, each hyper parameter takes value in the following intervals: – C ∈ [10−1.5; 101.5]
– gamma ∈ [10−4.5; 10−2.2] – variance ratio ∈ [0, 1]
In these intervals, 10 values homogeneously distributed in a base-10 logarithm were selected. The combination of hyper parameters we kept is the one whith the highest OP score value.
To handle the inter-surgery variability, we repeated this GS in the nested-CV protocol for 20 different data configurations named the cv conf igs. These 20 cv conf igs were themselves repeated with input variables being the tial features (S), the procedural features (P), and the concatenation of spa-tial+procedural features (S+P). We call input feature population (IF P ) the S, P and S+P configurations. Hyper parameters were optimized along these three series of 20 cv conf igs to predict an output value called the response. Here, response is the quality.
So here, response ∈ {quality; surgeon}. We obtained their performances on the test fold. We decided to predict the surgeon, to study the relationship between the ESS and the surgeon’s practice.
3.5 Features analysis
Once we optimized the hyper-parameters and trained the model, we focused on the inner-parameters of the LDA. This dimension reduction step is char-acterized by its eigenvectors and eigenvalues, which allowed us to access the features selected in the eigenvectors. These selected features are the most dis-criminative to predict the response.
Given the three IF P s, the 20 cv conf igs, and the two responses, for each possible combination of these three parameters, we obtained a cluster con-taining its most discriminative features. As cv conf ig expresses the data vari-ability, we averaged the clusters’ composition over cv conf ig and obtained 6 ”independent” clusters C(S+P, response), C(S, response) and C(P, response) for response ∈ {quality, surgeon}. We also used these 6 clusters to compute ”intersection” clusters:
First, given the quality’s prediction, we computed the significant features common to IF P s:
– S+P and S: Cquality(S+P∩S)
– S+P and P: Cquality(S+P∩P )
Similarly, given the surgeon’s prediction: – S+P and S: Csurgeon(S+P∩S)
– S+P and P: Csurgeon(S+P∩P )
Finally, given each IF P , we computed the significant features common to the predictions of surgeon and quality:
– S+P: CS+P(quality ∩ surgeon)
– S: CS(quality ∩ surgeon)
– P: CP(quality ∩ surgeon)
We studied the different combinations of IF P and response, and analyzed the independent and intersection clusters by comparing their feature counts.
(a)
(b)
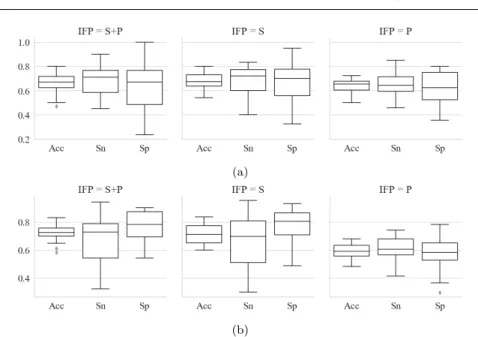
Fig. 6: Best models’ performances for the different IF P s and responses - (a) Prediction of response = quality - (b) Prediction of response = surgeon
4 Results
4.1 Algorithm optimization
Once the algorithm is optimized for the different configurations of response and IF P , we observe the performances of the final model for the prediction of quality on Fig.6a, and for the prediction of surgeon on Fig.6b. Each col-umn corresponds to one of the three IF P s S, P and S+P. Performances are characterized by the accuracy, the sensitivity and the specificity to show the ability of the algorithm to predict its binary output. Table 3 presents some observations.
Id Figure Observation
1 6a P has lower performances than S+P and S in the quality prediction task. 2 6a Sp and Sn have very close mean values.
3 6a Prediction is higher and more stable for ’good’ quality (i.e. higher sen-sitivity) than for ’non-optimal’ quality (i.e. lower specificity).
4 6b Prediction is higher and more stable for surgeon 0 (i.e. higher specificity) than for surgeon 1 (i.e. lower sensitivity).
– on the left part of Table 4, the first line shows in average 29.9 features per independent cluster over the 20 cv conf igs for the model trained on S+P features to predict the quality,
– on the right part of Table 4, the first line shows in average 29.5 features in common for intersection clusters corresponding to the model predicting the quality based on S+P and P features.
Independent Feature count Intersection Feature count
clusters mean std clusters mean std
C(s + p, quality) 29.9 0.89 Cquality(s + p ∩ s) 29.5 0.92
C(s, quality) 37.2 0.96 Cquality(s + p ∩ p) 0.4 0.49
C(p, quality) 15.6 1.36 Csurgeon(s + p ∩ s) 29.4 0.79
C(s + p, surgeon) 29.6 0.92 Csurgeon(s + p ∩ p) 0.25 0.43
C(s, surgeon) 38.2 0.96 Cs+p(quality ∩ surgeon) 19.2 1.47
C(p, surgeon) 12.9 0.65 Cs(quality ∩ surgeon) 26.2 1.88
Cp(quality ∩ surgeon) 11.6 0.74
Table 4: Statistics on the features’ clusters over the different response and IFP, s+p=spatial+procedural, s=spatial, p=procedural
Table 5 presents some observations.
Id Observation
1 In independent clusters, and for IF P ∈ {S + P, S, P }, C(IF P, quality) and C(IF P, surgeon) present very close mean feature counts and low std deviation. 2 For each IF P , the CIF P(quality ∩ surgeon) intersection cluster has 70% of its
features in the corresponding independent cluster.
3 For response ∈ {quality, surgeon}, intersection cluster Cresponse(S + P ∩ S) has
the same feature count as its corresponding independent cluster C(S +P, response), whereas Cresponse(S + P ∩ P ) counts almost none.
5 Discussion 5.1 Database creation
Unlike existing databases of annotated surgeries, this database combines an annotation of the surgical procedure, and of the video visual content. A metric characterizing the ESS, defined as the management of the vision and space by the surgeon, is also annotated, resulting in a very rich annotation of laparo-scopic videos.
For this preliminary study, we had to make several compromises given the time consuming annotation process. The main bias is that only two confirmed surgeons coming from the same hospital participated in the study. Such a mono-centric study lacks the variability of multi-centric studies, with various levels of expertise. Still, it allowed us to focus on the analysis of the practice profiles of both surgeons. Besides, to strengthen the annotation dataset, we plan:
1. to repeat the ESS quality annotations among several surgeons, as only one did the annotation until now,
2. to evaluate the intra- and inter-annotators variabilities in the spatial and procedural annotation processes.
5.2 Algorithm’s performances
Algorithm performances (Fig.6) showed that metrics such as quality and surgeon, characterizing some non-trivial aspects of the surgical practice, could be classified and analyzed, even though performances could be improved.
In table 3, observation ID 1 shows that the prediction of quality relies more on the spatial than on the procedural context. Indeed, the notion of ESS is related to the surgeon’s vision and space management and its annotation is more focused on the image content than on the process happenings: the spatial aspect of the video could prevail over the procedural one in the specification of our study.
The database is strongly unbalanced between the two quality classes, and ’non-optimal’ quality samples (only 17% of all samples) are also inhomoge-neously distributed along the 29 surgeries (see Fig.3b). This variability is mainly due to the patients’ diversity, and to the differences of practice be-tween the two surgeons. Thanks to the optimized precision score, and the nested CV strategy, observation ID 2 shows that the algorithm still predicts as well the two response classes.
In our database, we observe that surgeon 0 has a higher ratio of ’good’ quality samples, whereas surgeon 1 has a higher ratio of ’non-optimal’ quality samples. Moreover, observations ID 3 and ID 4 show a better stability in the prediction results of surgeon 0 for ’good’ quality. Clinically, it implies that the first surgeon, performing a better ESS overall, has a more distinctive and predictable practice than the second surgeon.
5.3 Feature clustering
In this part of the study we extracted the clusters of most discriminative features selected by the model, thanks to the linearity of the preprocessing and dimension reduction steps. It would not have been possible with non-linear methods like neural-networks or deep-learning approaches.
In table 5, observation ID 1 potentially means that the composition of fea-ture clusters stays stable along the different cv conf ig for each IF P . Moreover, observation ID 2 implies that 70% of the input features are common to both quality and surgeon, whereas the remaining 30% characterize specifically each class. These common and distinctive features should be studied more closely to understand what connects and what distinguishes the ESS quality from the surgeon’s profile.
Finally, observation ID 3 shows that the model based on S+P is selecting all its features in the spatial domain and almost none in the procedural domain. Combined with the better results of the spatial model as compared to the procedural model, it confirms that adding procedural features to the spatial ones disturbs the training process.
A deeper analysis of these features’ clusters is required to extract some clinically meaningful interpretations from the algorithm behavior and to vali-date our analysis. More precisely, this would require an individual study of the input features, associated with a semantic interpretation of their behavior.
6 Conclusion
In this work, we presented an algorithm predicting the quality of surgical exposure from spatial and procedural features. We studied the impact of these two populations of features on the prediction of the quality of exposure, and on the prediction of the practicing surgeon. These preliminary results showed the feasibility of an automatic approach to evaluate specific aspects of the surgical expertise and surgical practice.
We foresee an analysis of the way features’ populations are processed by the predictive model, so we get a better understanding of relationships between these spatial and procedural features on one side, and the quality of exposure and surgeon’s practice on the other.
Conflict of interest
The authors declare that they have no conflict of interest.
Ethical approval
All procedures performed in studies involving human participants were in ac-cordance with the ethical standards of the institutional and/or national re-search committee and with the 1964 Helsinki declaration and its later amend-ments or comparable ethical standards.
Informed consent
Study ethics approval was obtained on 24 May 2018 (CECIC Rhˆ one-Alpes-Auvergne, Clermont-Ferrand, IRB 5891)
Acknowledgements This work was supported by French state funds managed by the ANR within the Investissements d’Avenir Programme (Labex CAMI) under reference ANR-11-LABX-0004. Authors thank the IRT b<>com for the provision of the software “Surgery Workflow Toolbox [annotate],” used in this study.
References
1. The COlon cancer Laparoscopic or Open Resection Study Group. Laparo-scopic surgery versus open surgery for colon cancer: short-term outcomes of a randomised trial. The Lancet Oncology, 6:477–484, 2005.
2. Timothy J. Babineau, James Becker, Gary Gibbons, Stephen Sentovich, Donald Hess, Sharon Robertson, and Michael Stone. The Cost of Opera-tive Training for Surgical Residents. Arch Surg, 139:366–370, 2004. 3. Florent Lalys and Pierre Jannin. Surgical process modelling: a review. Int
J CARS, 9:495–511, 2014.
4. David Bouget, Max Allan, Danail Stoyanov, and Pierre Jannin. Vision-based and marker-less surgical tool detection and tracking: a review of the literature. Medical Image Analysis, 35:633–654, 2017.
5. Constantinos Loukas. Video content analysis of surgical procedures. Surg Endosc, 32:553–568, 2018.
6. Aneeq Zia, Yachna Sharma, Vinay Bettadapura, Eric L. Sarin, Thomas Ploetz, Mark A. Clements, and Irfan Essa. Automated video-based as-sessment of surgical skills for training and evaluation in medical schools. Int J CARS, 11:1623–1636, 2016.
7. R´emi Wolf, Maud Medici, Ga¨elle Fiard, Jean-Alexandre Long, Alexandre Moreau-Gaudry, Philippe Cinquin, and Sandrine Voros. Comparison of the goals and MISTELS scores for the evaluation of surgeons on training benches. Int J CARS, 13:95–103, 2018.
Sue Prior, Pam Strange, and Ann Tizzard. How to investigate and analyse clinical incidents: Clinical Risk Unit and Association of Litigation and Risk Management protocol. BMJ, 320:777–781, 2000.
10. Richard J. Gray, Kanav Kahol, Gazi Islam, Marshall Smith, Alyssa Chap-ital, and John Ferrara. High-Fidelity, Low-Cost, Automated Method to Assess Laparoscopic Skills Objectively. Journal of Surgical Education, 69: 335–339, 2012.
11. Constantinos Loukas and Evangelos Georgiou. Performance comparison of various feature detector-descriptors and temporal models for video-based assessment of laparoscopic skills. The International Journal of Medical Robotics and Computer Assisted Surgery, 12:387–398, 2016.
12. Hassan Ismail Fawaz, Germain Forestier, Jonathan Weber, Lhassane Idoumghar, and Pierre-Alain Muller. Evaluating surgical skills from kine-matic data using convolutional neural networks. arXiv:1806.02750 [cs], 11073:214–221, 2018.
13. Sandeep Ganni, Sanne M. B. I. Botden, Magdalena Chmarra, Richard H. M. Goossens, and Jack J. Jakimowicz. A software-based tool for video motion tracking in the surgical skills assessment landscape. Surg Endosc, 32:2994–2999, 2018.
14. Arnaud Huaulm´e, Kanako Harada, Germain Forestier, Mamoru Mitsuishi, and Pierre Jannin. Sequential surgical signatures in micro-suturing task. Int J CARS, 13:1419–1428, 2018.
15. Angelo Iossa, Mohamed Abdelgawad, Brad Michael Watkins, and Gian-franco Silecchia. Leaks after laparoscopic sleeve gastrectomy: overview of pathogenesis and risk factors. Langenbecks Arch Surg, 401:757–766, 2016. 16. P. Verhaeghe, A. Dhahri, Q. Qassemyar, and J.-M. Regimbeau. Technique de la gastrectomie longitudinale ( sleeve gastrectomy ) par laparoscopie.
2011.
17. C. Garraud, B. Gibaud, C. Penet, G. Gazuguel, G. Dardenne, and P. Jan-nin. An Ontology-based Software Suite for the Analysis of Surgical Process Model. In Proceedings of Surgetica’2014, pages 243–245. 2014.
18. Arnaud Huaulm´e, Sandrine Voros, Laurent Riffaud, Germain Forestier, Alexandre Moreau-Gaudry, and Pierre Jannin. Distinguishing surgical be-havior by sequential pattern discovery. Journal of Biomedical Informatics, 67:34–41, 2017.
19. C´eline Fouard, Aur´elien Deram, Yannick Keraval, and Emmanuel Pro-mayon. CamiTK: A Modular Framework Integrating Visualization, Im-age Processing and Biomechanical Modeling. In Soft Tissue Biomechanical Modeling for Computer Assisted Surgery, pages 323–354. 2012.
20. Timo Ojala, Matti Pietik¨ainen, and Topi M¨aenp¨a¨a. A Generalized Local Binary Pattern Operator for Multiresolution Gray Scale and Rotation Invariant Texture Classification. In Advances in Pattern Recognition — ICAPR 2001, pages 399–408, 2001.
21. Fabian Pedregosa, Ga¨el Varoquaux, Alexandre Gramfort, Vincent Michel, Bertrand Thirion, Olivier Grisel, Mathieu Blondel, Peter Prettenhofer, Ron Weiss, Vincent Dubourg, Jake Vanderplas, Alexandre Passos, David Cournapeau, Matthieu Brucher, Matthieu Perrot, and ´Edouard Duches-nay. Scikit-learn: Machine Learning in Python. Journal of Machine Learn-ing Research, 12:2825-2830, 2011.
22. Gavin C. Cawley and Nicola L. C. Talbot. On Over-fitting in Model Selec-tion and Subsequent SelecSelec-tion Bias in Performance EvaluaSelec-tion. Journal of Machine Learning Research, 11:2079–2107, 2010.
23. Mohammad Hossin and Sulaiman M.N. A Review on Evaluation Metrics for Data Classification Evaluations. International Journal of Data Mining & Knowledge Management Process, 5:01–11, 2015.

![Table 1: Description of the procedural feature vector (count=78), activities are formalized with the triplet <verb, instrument, target> [3] based on a](https://thumb-eu.123doks.com/thumbv2/123doknet/14415414.512563/5.892.161.560.737.879/table-description-procedural-feature-activities-formalized-triplet-instrument.webp)