HAL Id: inserm-00128925
https://www.hal.inserm.fr/inserm-00128925
Submitted on 27 Feb 2007
HAL is a multi-disciplinary open access archive for the deposit and dissemination of sci-entific research documents, whether they are pub-lished or not. The documents may come from teaching and research institutions in France or abroad, or from public or private research centers.
L’archive ouverte pluridisciplinaire HAL, est destinée au dépôt et à la diffusion de documents scientifiques de niveau recherche, publiés ou non, émanant des établissements d’enseignement et de recherche français ou étrangers, des laboratoires publics ou privés.
A meta-analysis of human embryonic stem cells
transcriptome integrated into a web-based expression
atlas.
Said Assou, Tanguy Lecarrour, Sylvie Tondeur, Susanne Strom, Audrey
Gabelle, Sophie Marty, Laure Nadal, Véronique Pantesco, Thierry Rème,
Jean-Philippe Hugnot, et al.
To cite this version:
Said Assou, Tanguy Lecarrour, Sylvie Tondeur, Susanne Strom, Audrey Gabelle, et al.. A meta-analysis of human embryonic stem cells transcriptome integrated into a web-based expression atlas.. STEM CELLS, AlphaMed Press, 2007, 25 (4), pp.961-73. �10.1634/stemcells.2006-0352�. �inserm-00128925�
A meta-analysis of human embryonic stem cells
transcriptome integrated into a web-based
expression atlas
Said Assou§,*,φ, ξ, Tanguy Lecarrour§, Sylvie Tondeur§,*,φ, Susanne Ström#, Audrey Gabelle§,*, Sophie Marty§,*,φ, Laure Nadal§, Véronique Pantesco*, Thierry Rème§,* , Jean-Philippe Hugnotδ,Ω, Stéphan Gasca§,‡,*, Outi Hovatta#, Samir Hamamah‡,§,*,φ, Bernard
Klein§,*,φ, John De Vos§,*,φ,1
§ Centre Hospitalier Universitaire de Montpellier, Institute for Research in Biotherapy,
Hôpital Saint-Eloi, Montpellier, France ; * Institut National de la Santé et de la Recherche Médicale, U847, Montpellier, France ; φ Université Montpellier, Unité de Formation et de Recherche de médecine, Montpellier, France ; ξ MacoPharma, Tourcoing, France; # Department of Obstetrics and Gynecology, CLINTEC, Karolinska Institutet, Karolinska University Hospital, Huddinge, Stockholm, Sweden; δ Institut des Neurosciences de Montpellier, Hôpital Saint-Eloi, Montpellier, France ; Ω INSERM, U 583, Montpellier, France ; ‡ CHU Montpellier, Unité biologie clinique d’Assistance Médicale à la Procréation -Diagnostic Pré-Implantatoire, Hôpital Arnaud de Villeneuve, Montpellier, France.
Running Title: Meta-analysis of hESC transcriptome
Key words : pluripotent stem cells; gene expression profiling; microarray analysis
1: To whom correspondence should be addressed: John De Vos, Institute for Research in Biotherapy, Hôpital Saint-Eloi, 80 Avenue Augustin Fliche, 34295 Montpellier Cedex 5, France. Fax: 33-(0)4-67-33-01-13. Email: [email protected]
HAL author manuscript inserm-00128925, version 1
HAL author manuscript
Abstract
Microarray technology provides a unique opportunity to examine gene expression patterns in human embryonic stem cells (hESCs). We performed a meta-analysis of 38 original studies reporting on the transcriptome of hESCs. We determined that 1076 genes were found overexpressed in hESCs by at least 3 studies when compared to differentiated cell types, thus composing a “consensus hESC gene list”. Only one gene was reported by all studies: the homeodomain transcription factor POU5F1/OCT3/4. The list comprised other genes critical for pluripotency such as the transcription factors NANOG and SOX2, and the growth factors TDGF1/CRIPTO and Galanin. We show that CD24 and SEMA6A, two cell surface protein-coding genes from the top of the consensus hESC gene list, display a strong and specific membrane protein expression on hESCs. Moreover, CD24 labeling permits to purify by flow cytometry hESCs co-cultured on human fibroblasts. The “consensus hESC gene list” also included the FZD7 WNT receptor, the G protein-coupled receptor GPR19, and the HELLS helicase which could play an important role in hESCs biology. Conversely, we identified 783 genes downregulated in hESCs and reported in at least three studies. This “consensus differentiation gene list” included the IL6ST/GP130 LIF receptor. We created an online hESC expression atlas, (http://amazonia.montp.inserm.fr), to provide an easy access to this public transcriptome dataset. Expression histograms comparing hESC to a broad collection of fetal and adult tissues can be retrieved with this web tool for more than 15 000 genes.
Introduction
In the preimplantation mammalian embryo, the inner cell mass is able to differentiate into any cell type of the embryo proper. It has been recognized in mice since 1981 that embryonic stem cells (ESCs) with a prolonged proliferative capacity in vitro can be derived from the inner cell mass [1]. ESC line derivation from human embryos was reported in 1998 [2]. ESCs are pluripotent cells that can contribute to all tissues in vivo, and to the three primary germ layers as well as extraembryonic tissues in vitro. As pluripotency is maintained even after prolonged periods of culture, human ESCs (hESCs) have a great therapeutic potential in regenerative medicine. Careful molecular characterization of this unique cellular model of pluripotency should help to optimize and scale up in vitro manipulation of hESCs for clinical applications. Some genes specific to the very early stages of development and expressed in hESC lines such as POU5F1/OCT3/4, NANOG, REX1, SOX2, FGF4 and FOXD3 have already been identified [3-8]. However, the picture is far from complete and the molecular mechanisms involved in self-renewal and pluripotency are still under tight scrutiny [9, 10]. Moreover, extensive knowledge on hESCs should help in designing protocols for the isolation and production of other multi/pluripotent stem cells derived from tissues of adult individuals.
Microarrays are a major technical breakthrough that can monitor the expression of a whole genome in one experiment. Application of this technology to hESCs has largely contributed to our knowledge on the mechanisms underlying the maintenance of pluripotency of hESCs and their in vitro differentiation. Unfortunately, the datasets generated are heterogeneous both in accessibility (public databases or Supplemental data) and in the techniques used (variability in microarray design, sample labeling techniques, choice of control samples and computational tools). Despite our findings of 38 original publications reporting hESC transcriptome analyses, the disparities between datasets, the variety of
sources, the substantial know-how needed for transcriptome data mining discourage most non-specialists to consult this information. Thus, large amount of data are very much underused, and lack alternative interpretations since only the conclusions reflecting the analysis carried out by the authors are presented. This situation has led to initiatives such as ONCOMINE in the field of cancer [11]. We present here the first effort in compiling all publicly available microarray data relating to hESCs. From the 38 original publications studying the hESC transcriptome, we identified genes that were consistently overexpressed in hESCs when compared to differentiated samples (“consensus hESC gene list”) and underexpressed in hESCs (“consensus differentiation gene list”) in different studies. These lists will further deepen our knowledge on this unique cell model of developmental biology. Concurrently, we created an on-line database, Amazonia!, which provides an easy access to this public transcriptome dataset.
Materials and Methods
Lists of genes differentially expressed
Analyzing 38 original studies using transcriptome analysis to study hESC, we were able to collect 20 lists of transcripts that were upregulated in hESCs compared to differentiated cell types and 11 lists of transcripts that were downregulated (see Supplemental Tables S1, S2 and S3). We only selected transcripts lists that provided a fold ratio of the mean expression in hESCs to that in differentiated cells. Each list was mapped to Unigene build 176. When the mean value of expression in differentiated cells was zero, which occurred with ESTs and SAGE, the hESC/differentiation ratio was arbitrarily set at 50. Only genes with a fold ratio greater or equal to 2 (“hESC” genes), or lower or equal to 0.5 (“differentiation” genes) were selected. The Gene Ontology annotation analysis was carried out using the Fatigo+ tool on the Babelomics website (http://babelomics.bioinfo.cipf.es) using gene symbols [12]. Only annotation with a false discovery rates (FDR) adjusted P-value < 0.05 were considered significant.
Integrating Affymetrix GeneChip datasets obtained from distinct studies
In order to compare the transcriptome of hESCs to that of differentiated cell populations, we built an expression compendium by combining the U133A (Affymetrix, Santa Clara, USA) microarray data from 8 publications [13-20]. Indeed, we and others have shown that the GeneChip system (Affymetrix) allows direct comparison between datasets obtained in different centers, provided that the same chip and the same normalization are used [10, 21, 22]. The number of samples amounted to 217, including 24 hESC samples (11 different hESC lines). All samples were normalized before analysis with the GCOS 1.2 software (Affymetrix), using the “global scaling” method with a TGT value set to 100. The “ detection call” can either be “present”, when the perfect match probes are significantly more hybridized than the mismatch probes, “absent” when both perfect match and mismatch probes display a
similar fluorescent signal, or “marginal” when the probeset does neither comply to the present nor to the absent call criteria. When several probesets measured the same gene, only the probeset with the maximal number of present detection call across all samples was selected. This step reduced the list of probesets to 14 074. This dataset is available as Supplemental Table S4 and can be accessed on our website http://amazonia.montp.inserm.fr.
Hierarchical clustering
Hierarchical clustering was carried out on the detection call data with the CLUSTER and TREEVIEW software packages [23]. The value 1 was assigned to present calls, -1 to absent calls and 0 to marginal calls. This matrix was clustered without further mathematical transformation. Only genes were clustered, i.e. the order of the samples is the order used on the Amazonia! website, and is based on grouping according to the embryonic germ layer origin of the sample.
hESC lines and karyotype
The list of hESC lines used and their respective karyotype are listed in Table 1.
hESC culture
After approval from the French Ministry of Research, the French Ministry of Health and the Agence de la Biomédecine, HUES1 and HUES3 hESCs were imported from Douglas Melton’s laboratory (Harvard University, MA, USA) and cultured as described [24]. Cells were passaged every 3-4 days enzymatically with 0.25% trypsin/EDTA (Invitrogen, Cergy Pontoise, France) and cultured in knockout Dulbecco’s modified essential medium (Invitrogen) without plasmanate, with 10% KO-SR (Invitrogen), 2 mM L-glutamine, 1x non-essential amino acids, 0.05 mM β-mercaptoethanol, 10 ng/ml FGF2 (Abcys, Paris, France). Medium was replaced daily. HUES1 and HUES3 were cultured on murine embryonic fibroblasts (MEF) obtained from E13 ICR mice embryos (Harlan, Gannat, France) or on human foreskin fibroblasts (hFF) in porcine skin gelatin coated (Sigma-Aldrich, St. Quentin
Fallavier, France) 6 wells dishes. The hFF cell lines SM1 and SM3 were derived from respectively 75 and 3 years old patients undergoing foreskin reduction. Informed consent was obtained from the patient or the patient’s parents. MEF were cultured in DMEM with 10% fetal calf serum (FCS) and hFF in DMEM with 20% FCS. MEF and hFF were mitotically inactivated by mitomycin-C (2h at 10 µg/ml). These hESC expressed POU5F1, TRA-1-60, TRA-1-81, displayed phosphatase alkaline activity, and were able to differentiate into embryoid bodies that expressed differentiation markers of astrocytic lineage (GFAP) or endodermal lineage (alpha-feto protein) (see Supplemental Figure S1 and data not shown). The HS293 and HS235 hESC lines were cultured in the Department of Obstetrics and Gynecology, (CLINTEC) at the Karolinska University Hospital as described [25]. Briefly, hESC were cultured on hFF (CRL-2429; American Type Culture Collection, Manassas, VA) mitotically inactivated by irradiation (40 Gy), in KO-DMEM 20% knockout SR, 2 mM Glutamax, 0.5% penicillin–streptomycin, 1% nonessential amino acids, 0.5 mM β-mercaptoethanol (all from Gibco Invitrogen Corporation, Paisley, Scotland), 1% insulin-transferrin-selenium (Sigma-Aldrich) and 8 ng/mL of bFGF (R&D Systems, Oxford, UK). For karyotype analysis, hESC cells were treated with 75ng/ml final Karyomax Colcemid (Invitrogen) for 1h, trypsinized, incubated in 0.0375M KCl for 20 min, and fixed in fresh 3:1 methanol/acetic acid solution. 1 to 2 spreads were counted for chromosome number and 12 to 16 banding patterns were analyzed at 300–500 bands resolution.
Flow cytometry analysis
Human ES cells and fibroblasts were dissociated with trypsin (0.25%)-EDTA (1mM) (GIBCO) for 3 min. Cells were then washed with PBS and incubated for 30 min at 4°C in PBS with the corresponding monoclonal antibody (MAb): anti-CD24 MAb conjugated to phycoerythrin (PE) (dilution 1:50) (clone ALB9, Immunotech, Marseille, France) and/or anti-CD44 MAb conjugated to fluorescein isothiocyanate (FITC) (dilution 1:50) (clone J-173,
Immunotech). After PBS washes, cells were suspended in Facsflow (Becton Dickinson, San Jose, CA) and fluorescence was analyzed with a FACSCalibur flow cytometer (Becton Dickinson) or sorted with a FACSAria cell sorter (Becton Dickinson). Appropriate isotype controls were included in all analyses.
Immunofluorescence
hESCs cultured on coverslips were fixed for 20 min in 4% paraformaldehyde and washed three times in PBS. Cells were permeabilized with 0.1% Triton X-100. After blocking at room temperature for 60 min in PBS with 5% donkey serum (S30, Chemicon international, Temecula, CA), cells were incubated for 1 hour at room temperature with primary antibody diluted in PBS with 5% donkey serum: POU5F1/OCT3/4 (sc 9081, Santa Cruz Biotechnology, Santa Cruz, CA; 1:300) and SEMA6A (AF1146, R&D, Abington, United Kingdom; 1:50). Cells were washed three times in PBS and incubated for 1 hour at room temperature with Alexa Fluor® 488 Donkey anti-Rabbit (A-11034; Molecular Probes; 1:1000) and Cy3 Donkey anti-Goat (Jackson ImmunoResearch; USA; 1:400) secondary antibodies, for POU5F1 and SEMA6A respectively. Unbound antibodies were removed by three washes in PBS. Hoechst staining was added to the first wash (Sigma, 5 µg/ml).
Results
Compiling hESC expression profiles
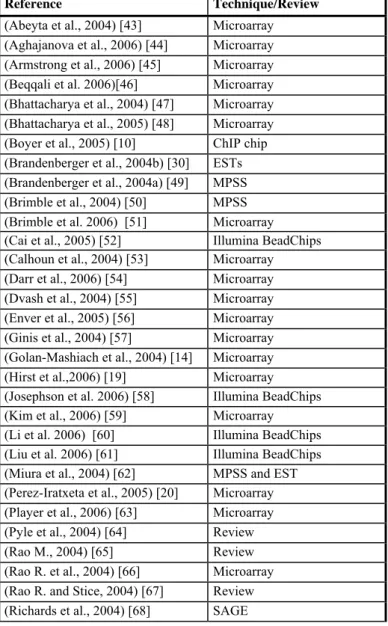
As of October 1st, 2006, we identified 38 original studies, 1protocol description and 4 reviews analyzing the transcriptome of hESCs (Table 2). The original studies used various hESCs, control cells and gene expression analysis techniques (summarized in Supplemental Table S1). 28 different hESC lines were used and transcriptome techniques included microarrays (7 different types of chips), ESTs scanning, SAGE, MPSS and Illumina beads. One study compared chromosome immuno-precipitation (ChIP) chip data with transcriptome data in hESCs [10]. Nevertheless, some common features emerged such as the frequent investigation of the H1, H9, and BG01 hESCs (in 12, 12 and 11 studies respectively), and the use of the GeneChip (Affymetrix) microarray system (in 16 studies) (see supplemental table S1).
Meta-analysis of genes differentially expressed between hESCs and non-pluripotent cells
One main objective of large scale gene expression analyses of hESCs is to identify the set of genes that are overexpressed in this unique cell type (“hESC” genes) or underexpressed (“differentiation” genes). We reasoned that bona fide “hESC” or “differentiation” genes would be repeatedly uncovered by independent groups, regardless of the hESC lines, the control cells, the assay format or the statistical method that had been used. We collected, from these 38 original studies, 20 lists of transcripts overexpressed in hESCs (“hESC genes”) and 11 lists of genes underexpressed in hESCs (“differentiation genes”).
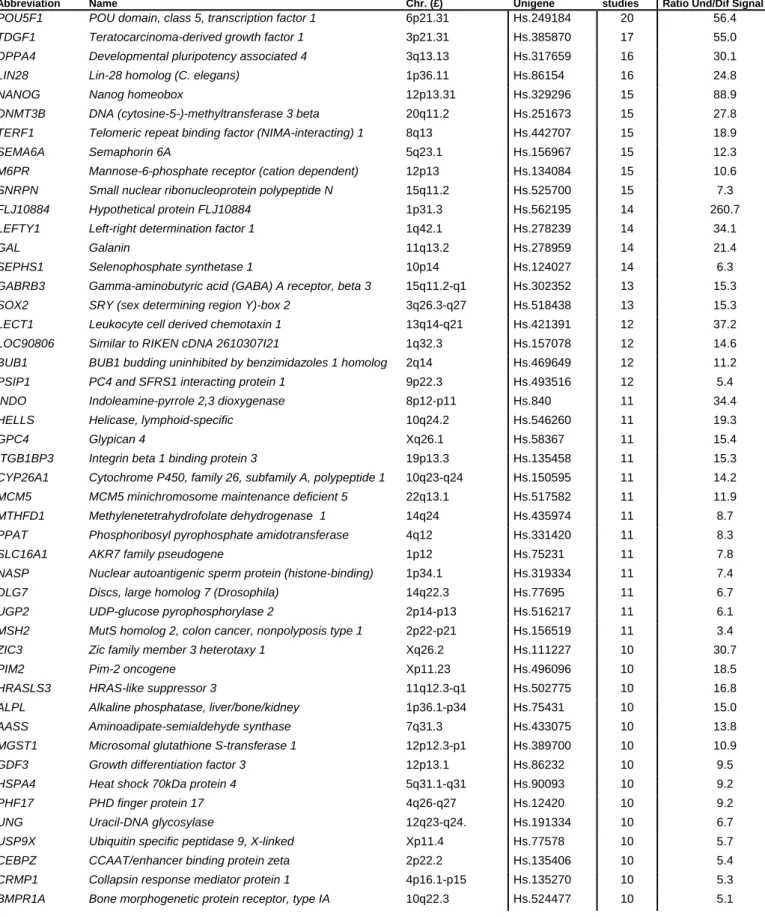
The 20 lists of hESC genes comprised 5567 different genes. As illustrated in Figure 1A, we observed a marked heterogeneity between these lists, with only 1076 genes found overexpressed in hESCs by three or more independent studies, 48 genes by 10 or more studies and only 1 gene by all 20 lists (see Supplemental Table S2). The 48 genes found overexpressed in at least 10 studies are listed in Table 3. Of note, the pivotal ES transcription
factor POU5F1/OCT3/4 is the one gene found by all 20 lists, whereas genes found in at least 10 studies include the transcription factors NANOG and SOX2, and the growth factors TDGF1/CRIPTO and Galanin (GAL) that are known to be highly expressed by hESCs. Thus, according to hESC transcriptome analyses published to date, this list of 1076 genes found overexpressed in hESC cells by three or more studies can be viewed as a “consensus hESC gene list”.
In order to get further insights into this hESC list, we built an expression compendium by combining the data from 5 publications using the U133A GeneChip microarray to analyze hESC transcriptome and 3 publications providing the transcriptome of various normal fetal and adult tissues (see material and method and Supplemental Table S4). This compendium included the gene profiling of 24 hESC samples and more than 190 various fetal and adult tissues samples. A heat map was generated for the “consensus hESC gene list” in this expression compendium based on the detection call provided by the GCOS 1.2 software. The detection call is a way to evaluate whether a gene is expressed or not in a given sample. Hierarchical clustering (Figure 1C) delineated four major clusters of genes: cluster (a) was a group of 40 genes specifically detected in hESCs (“hESC specific” genes, Table 4), including expected genes such as POU5F1/OCT3/4, NANOG, TDGF1, LIN28, CLDN6, GDF3, DNMT3A, but also genes such as CYP26A1, HELLS or GPR19, cluster (b) featured genes that were detected in both hESCs and CNS samples such as the GABA receptors GABRB3 and GABRA5, and the growth factor FGF13, cluster (c) genes detected in samples characterized by a high mitotic index such as SKP2, MYC, the cyclin CCNA2 and the MCM genes MCM2, MCM5, MCM6 and MCM7, cluster (d) genes overexpressed in hESCs but also expressed in a majority of the tissues included in this dataset such as PGK1, HSPA9B, and the ribosomal genes RPLP0, RPL6, RPL7 and RPL24. The complete lists of genes composing these clusters are available as Supplemental Table S5. The expression histograms of the 40 hESC specific
genes are shown in Supplemental Figure S2. These results show that, though all 1076 genes of the “consensus hESC gene list” have been found overexpressed in hESCs compared to non-hESC samples by at least three different studies, 40 genes are indeed hESC specific (cluster a) but most are nonetheless also expressed in adult tissues to various extent.
The 11 lists of “differentiation” genes summed up to 4798 genes and we noted a similar heterogeneity as in the “hESC” lists (Supplemental Table S3). Out of these 4798 genes, only 783 were found underexpressed in hESCs by at least 3 different studies, composing a “consensus differentiation gene list”, three genes, lumican, collagen 1A1 and 3A1, by nine studies and none by all 11 studies (Figure 1B). Table 5 shows 30 selected genes found by at least 6 studies, which include the bone morphogenetic proteins (BMP) 1 and 4, the keratins 7 and 18, insulin-like growth factor 2 (IGF2), Heart and neural crest derivatives expressed 1 (HAND1) and the transducing chain IL6ST/GP130. The complete “consensus differentiation gene list” can be found in Supplemental Table S3.
We compared functional Gene Ontology (GO) annotations of the hESC genes to the differentiation genes. Several functional annotations were more represented in each category (Figure 1D). There were significantly more genes involved in “metabolism”, “mitosis”, “RNA splicing”, “nuclear pore”, “DNA repair” in the hESC gene list, reflecting the intense proliferation, DNA replication and DNA remodeling taking place in these cells. Conversely, GO annotations such as “organ development”, “skeletal development”, “extracellular matrix”, “cell adhesion”, “cell communication”, “integral to plasma membrane”, “signal transduction”, were significantly more frequent among genes upregulated in differentiated tissues, in agreement with the idea that hESC differentiation mimics early organogenesis, which is associated with the development of complex cell-cell communication and cell-extra cellular matrix (ECM) interactions.
CD24 and SEMA6A are hESC markers
We next inquired whether we could find, among the hESC genes, new markers that may be useful to identify, isolate and qualify hESCs in vitro. We focused on two cell surface hESC genes: CD24 and SEMA6A. These two genes have been found to be overexpressed in hESCs by respectively nine and fifteen studies, and are therefore good candidates as new hESC markers.
CD24 is a sialoglycoprotein known to be expressed on mature granulocytes and B cells subpopulations [26]. In addition to these hematopoietic cell types, microarray data from the expression compendium evidenced a high CD24 mRNA expression in keratinocytes, pancreas and thyroid, whereas most neural tissues, muscle, liver and testis did not express CD24 (Figure 2A). Upon differentiation of hESCs into embryoid bodies (EBs), CD24 expression is markedly downregulated (Figure 2B). Importantly, human foreskin fibroblasts (hFF) samples did not express CD24 (Figure 2C, 2F). Hence, we investigated whether CD24 could discriminate hESCs from fibroblasts in culture. We analyzed by flow cytometry the hESC lines HUES1, HUES3, HS293 and HS235 [24, 25] cultured on hFF and evidenced two distinct cell populations, one CD24+ and one CD24- (Figure 2E). To demonstrate that the CD24+ population corresponded to hESCs and the CD24- population to hFF, we took advantage of CD44, a strong fibroblast marker not expressed by hESCs (Figures 2D, 2G). Double staining of hESCs cultured on hFF showed that these two markers were expressed in a mutually exclusive manner and delimited a hESC CD24+CD44- population that did not overlap with the fibroblast CD24-CD44+ population (Figure 2H). Using CD24/CD44 labeling, we were able to separate hESC from fibroblasts and obtain pure hESC populations that recovered the cell sorting procedure and grew in vitro while retaining POU5F1 and cardinal cell surface markers of pluripotency expression (Supplemental Figure S3 and data not shown).
SEMA6A is a class 6 semaphorin [27], i.e. transmembrane with cytoplasmic domain, known to be expressed in developing neural tissue. We recently reported the expression of this semaphorin in cumulus oophorus cells [28]. Comparison of RNA expression in hESCs and normal adult tissues showed that in addition to hESCs, SEMA6A was also expressed at high level in adult samples from the central and peripheral nervous system and placenta (Figure 2I). As for CD24, SEMA6A mRNA is downregulated upon EB differentiation and is not detected in human fibroblasts (Figure 2J and K). Immunofluorescence analysis showed a membrane localization of SEMA6A on hESCs, in contrast to POU5F1/OCT3/4 which had a strict nuclear localization (Figure 2 L-M). In summary, we showed that CD24 and SEMA6A have indeed a preferential expression in hESCs, that this expression is confirmed at the protein level, and is declining upon EB differentiation. Thus these markers can be used to discriminate hESCs from feeder fibroblasts
hESC transcriptome data visualization through an open access web interface
We developed a website, Amazonia! (http://amazonia.montp.inserm.fr), to allow the scientific community access to these public data. This website is dedicated to the visualization of large, publicly available, human transcriptome data (Le Carrour et al., manuscript submitted). A main topic of this website is human embryonic stem cells. Data are visualized as expression histograms with a color code facilitating the recognition of cell type. Genes are accessed either by key words or through lists of genes. Most interestingly, when data were obtained using the same platform format, sample labeling and data normalization, it was possible to combine different experiments in one single virtual experiment. The U133A expression compendium comprises for example more than 200 different samples from 8 publications including hESCs and normal adult tissues. Thus, Amazonia! provides the expression profile of about 15 000 different genes in about 100 different tissues types or purified cell populations including 11 hESCs (H1, H9, HS181, HS235, HS237, FES21, FES22, FES29, FES30, ,I6,
HES-2). Figure 3A illustrates this feature of our website with the expression histograms of five hESC specific genes (POU5F1, NANOG, GPR19, Helicase lymphoid-specific (HELLS) and the cytochrome P450 CYP26A1), two genes expressed in nonlineage-differentiated cells (HAND1 and IGF2), two factors highly expressed by human fibroblasts and smooth muscle that may contribute to the supporting properties of fibroblast to hESC culture (Gremlin (GREM1) and Matrix metalloproteinase 1 (MMP1)), one hematopoietic marker (CD45), one central nervous system marker (Glial fibrillary acidic protein (GFAP)) and one ubiquitously expressed gene (Ribosomal protein L3 (RPL3)).
Another important feature of Amazonia! is the possibility to compare on the same web page the expression of a gene of interest in various datasets. Figure 3B shows that the expression of Frizzled 7 (FZD7) was markedly upregulated in hESCs, was downregulated during non-lineage differentiation into EBs, and was also highly expressed in embryonal carcinoma and Yolk sac carcinoma samples. The combination of these three histograms evidences a preferential FZD7 mRNA expression in normal and malignant embryonic cells, suggesting that FZD7 may play a major role in these pluripotent cell types.
In order to facilitate access for the scientific community to the lists of genes from published transcriptome analyses, we implemented a list manager in our Amazonia! website. Thus, one can access these lists straightforwardly and obtain an expression histogram for each gene in various public transcriptome collections. This feature is of particular interest to challenge a list of genes, for example a “hESC” gene list, with other hESC datasets or even with non-hESC datasets such as cancer datasets. Indeed, once a gene is selected, the user can navigate between various thematic pages, switching for instance from the “stem cells” page to the “leukemia and lymphoma”, “lung cancer” or other pages. Using this feature of the Amazonia! website, we could observe that the sialoglycoprotein CD24 was also highly expressed in acute
lymphoblastic leukemia, lung cancer and glioma samples when compared to the corresponding normal samples (Figure 3C and data not shown).
Discussion
Human ESCs are remarkable by their ability both to self renew and to generate virtually any kind of cell type, hence carrying many hopes for cell therapy. It is anticipated that genome wide expression analyses, by providing an extensive molecular taxonomy, will help understanding this unique cell model of stem cell pluripotency. Transcriptome results can be viewed as a non-biased, genome wide, expression catalog. Many groups have published the transcriptome of hESCs, but, as a direct consequence of the massive data generated, access to this data on a routine basis was precluded for most researchers. Therefore, the construction of a database collecting publicly available hESC transcriptome and accessible through a user friendly interface is of utmost interest for the hECS researchers’ community. We found 38 original studies or reviews analyzing the transcriptome of hESCs. Expression data and gene lists extracted from these studies were included into Amazonia! and are now readily accessible. Interestingly, the frequent use of the U133A oligonucleotide microarrays allowed us to construct a virtual expression dataset of about 15 000 different genes in more than 200 tissue samples from various origins, including 24 hESC samples. Hence, the expression of each gene in hESCs is directly contrasted to that of normal fetal and adult tissues, as illustrated in Figure 3A.
Unearthing the hESC gene panoply may help to define what makes hESCs unique. To achieve this goal, most studies compared hESC transcriptome data to that of more differentiated cell types and obtained lists of genes over- or underexpressed in hESCs. Comparison of different transcriptome surveys of hESCs gave us the unique opportunity to identify genes that were identified by several authors as differentially expressed in hESCs. However, a striking heterogeneity was observed between the 20 lists of hESC genes, and only 48 genes were
found to be highly enriched in hESCs in at least ten or publications, among 5567 genes found in at least one. Some of these differences may be explained by platform-to-platform or lab-to-lab variability, but this is likely not the main explanation as suggested by transcriptome platform comparisons [22]. Rather, the differences between the hESC cells lines used, the control samples, the specific caveats of each transcriptome analysis technique and the statistical methodologies likely contribute to these disparities (see Supplemental Table S2). For instance, the homeobox transcription factor NANOG, which is universally expressed in hESC, was not reported by Sperger et al. because no probe for NANOG was present on their microarray [29], nor was it reported by Brandenberger et al. because the differential regulation of NANOG in their in vitro differentiation model did not met their stringent statistical criteria [30]. ZFP42 (the human homolog of murine rex1) was never listed by MPSS studies because its MPSS signature has repeat sequences [31]. Another pitfall impacting on differentially expressed genes lists comparisons and contributing to the “small intersection” problem [32] is that in order to be at the intersection of 20 lists, a gene must have fulfilled 20 times the statistical filter, which it does with a probability equal to the product of the probabilities of each test. A way to circumvent this difficulty would be to obtain the raw data from these studies and to apply specific statistical tests [33]. However, the raw data were not available for many studies analyzed here, which prevented us from applying this approach in our study. Nevertheless, the 1076 hESC genes list provides the opportunity to the scientific community to examine the genes that have found over- or underexpressed in hESC by several authors. These lists provide further molecular insight into the biology of this unique stem cell model and are now starting points for many new research directions in the field of hESC. In the future, it will be interesting to extend this list by investigating additional hESC lines. The collection of additional transcriptome data is
ongoing and we will update the database according to new publications on the hESC genome expression.
As one can easily notice by brownsing the “consensus hESC gene list” in the U133A “embryonic and adult samples” dataset, we found very few genes that are completely hESC specific. Indeed, most genes found overexpressed in hESCs are also expressed in other tissues (Figure 1C), and only 40 genes, grouped in cluster (a), comprised genes which expression was not detected in most other tissues (see supplemental Figure S2). Of note, genes can only be labeled as hESC “specific” in respect of the different tissues and cell populations that have been tested. As new cell types will be investigated, some of these genes may be found expressed in these new samples and thereby cease to be specific to hESCs. Specificity also depends on the sensitivity of the assay investigating expression of a given gene. For example, POU5F1/OCT3/4 has been reported to be expressed in germinal cells and even in bone marrow by RT-PCR assays [34, 35]. By contrast, microarray analysis show that this gene, clearly expressed at a high level in hESCs and teratocarcinoma samples, is neither detected by this technique in testis, ovary, bone marrow samples, nor in a pure oocyte population (Figure 3A and unpublished data). These observations suggest that the properties of hESCs, comprising self-renewal, unrestrained proliferation and pluripotency, are mediated by the expression of few specific genes, if any, together with genes which individually are not hESC specific, but whose combined expression is specific to hESCs. The “consensus hESC gene list” should encompass many of those genes contributing to the embryonic stem cell characteristics.
Transcriptome approaches have several limitations. Each technique has its own technical limits, but this meta-analysis partly circumvented these by the simultaneous analysis of different, complementary methods. Another drawback is that by looking at the transcriptome, we consider gene expression at the RNA level only, eluding all forms of post-transcriptional
regulation. It will therefore be important in the future to look the differential expression of the genes described in the hESC and differentiation lists at these hESC and differentiation gene lists at the protein level. For that matter, this meta-analysis provides a list of pertinent genes for further protein validation. In line with this proposition, we chose to investigate more thoroughly two cell surface protein-encoding genes, which may serve as new hESC markers: CD24 and SEMA6A. Though these two genes have been found to be overexpressed in hESCs by 9 and 15 studies, respectively, we found that hESCs shared this RNA expression with several adult tissues as substantiated by microarray results (Figure 2). However, purification of hESCs requires only distinguishing them from differentiating stem cells and from the co-cultured feeder cells. CD24 expression is low in differentiating hESCs, and is absent in human fibroblasts. We were thus able to purify by flow cytometry pure hESC populations. This provides a new tool to isolate highly enriched populations of hESCs for subsequent experiments, including microarray analysis. We observed that CD24 was also highly expressed on various malignant cell types, as previously reported [36, 37]. Since CD24 is a ligand for P-selectin, it has been suggested that CD24 could be important in the dissemination of tumor cells by facilitating the interaction with endothelial cells [38]. The role of CD24 in hESCs is less clear because P-selectin is not expressed by human fibroblasts nor by hESCs themselves (data not shown), suggesting that CD24 may have other molecular functions. Semaphorins have been initially identified for their role in neuronal guidance as chemorepellents, but it is becoming clear that this large family of genes also plays important roles in organogenesis, vascularization, angiogenenesis and B lymphocyte signaling. We show here a clear protein expression of semaphorin 6A in hESCs, with an overexpression in hESCs compared to many other cells types, suggesting a functional role for this transmembrane molecule in cell-to-cell interaction or signaling in hESCs.
The clustering of the “consensus hESC gene list” based on the “detection call” identified a cluster of 40 genes with a high specificity in hESCs, with no expression in most samples from more than 100 different fetal and adult cell tissues (Table 4). In addition to genes clearly expected such as POU5F1/OCT3/4, NANOG or TDGF1, this cluster included genes whose hESC specificity had been overlooked. For example the expression of the G protein-coupled receptor 19 (GPR19) is restricted to hESCs and, if functional, may offer a possibility for in vitro intervention on proliferation or pluripotency of hESCs. Other hESC specific genes comprise the cytochrome P450 CYP26A1 which is responsible for retinoic acid degradation [39] or the helicase HELLS which is expressed at a moderate level in a few lymphoid samples but most importantly in hESCs and could be involved in DNA strand separation, including replication, repair, recombination, and transcription [40] (Figure 3A). Our meta-analysis also spotted additional interesting genes such as FZD7 which was identified as the frizzled receptor preferentially expressed on hESCs. Based on this expression, we hypothesize that FZD7 could be a major WNT receptor in hESCs. Thus, FZD7 could contribute to the pluripotency signal mediated by WNT previously reported in hESCs [41]. Regarding the “consensus differentiation gene list”, many genes are clearly related to differentiation such as collagen and keratin genes. We note that the transducing chain IL6ST/GP130, which is necessary to convey the signals from the IL-6 growth factor family including LIF, is expressed at a very low level in hESCs as compared to most differentiated adult tissues. This is in line with the largely accepted view that LIF signaling is dispensable for pluripotency in hESCs [2].
Conclusion
We analyzed 38 publications studying the hESC transcriptome. We propose a “consensus hESC gene list” and a “consensus differentiation gene list” that identifies the genes found
respectively up- or downregulated in hESCs compared to differentiated samples by at least three publications. We provide the first tool to directly visualize the expression of most human genes in hESCs, and provide direct comparison with their expression in many normal and malignant tissues. This tool may be considered as the first hESC expression Atlas online. By providing an easy access to this large public data, we hope that Amazonia! will help boosting the translation of these invaluable expression information into biological applications.
Acknowledgments
We are grateful to the various labs that gave free access to their complete transcriptome data, in agreement with the MIAME recommendations [42]. We thank Ned Lamb and Cyril Berthenet for support with informatics (IGH de Montpellier), and Hassan Boukhaddaoui for cell imaging (Montpellier RIO Imaging). We are grateful to Isabelle Rodde-Astier, Antoine Héron and Valérie Duverger (MacoPharma) for decisive support for this project. We thank Geneviève Lefort, Marie Ponset and Franck Pellestor for assistance in hESC karyotyping.
References
1. Evans MJ, Kaufman MH. Establishment in culture of pluripotential cells from mouse
embryos. Nature. 1981;292:154-156.
2. Thomson JA, Itskovitz-Eldor J, Shapiro SS, et al. Embryonic stem cell lines derived
from human blastocysts. Science. 1998;282:1145-1147.
3. Chambers I, Colby D, Robertson M, et al. Functional expression cloning of Nanog, a
pluripotency sustaining factor in embryonic stem cells. Cell. Jun 30 2003;113:643-655.
4. Nichols J, Zevnik B, Anastassiadis K, et al. Formation of pluripotent stem cells in the
mammalian embryo depends on the POU transcription factor Oct4. Cell. Nov 30 1998;95:379-391.
5. Hanna LA, Foreman RK, Tarasenko IA, Kessler DS, Labosky PA. Requirement for
Foxd3 in maintaining pluripotent cells of the early mouse embryo. Genes Dev. Nov 15 2002;16:2650-2661.
6. Rogers MB, Hosler BA, Gudas LJ. Specific expression of a retinoic acid-regulated,
zinc-finger gene, Rex-1, in preimplantation embryos, trophoblast and spermatocytes. Development. Dec 1991;113:815-824.
7. Graham V, Khudyakov J, Ellis P, Pevny L. SOX2 functions to maintain neural
progenitor identity. Neuron. Aug 28 2003;39:749-765.
8. Feldman B, Poueymirou W, Papaioannou VE, DeChiara TM, Goldfarb M.
Requirement of FGF-4 for postimplantation mouse development. Science. Feb 13 1995;267:246-249.
9. Lee TI, Jenner RG, Boyer LA, et al. Control of developmental regulators by polycomb
in human embryonic stem cells. Cell. Apr 21 2006;125:301-313.
10. Boyer LA, Lee TI, Cole MF, et al. Core transcriptional regulatory circuitry in human
embryonic stem cells. Cell. Sep 23 2005;122:947-956.
11. Rhodes DR, Yu J, Shanker K, et al. ONCOMINE: a cancer microarray database and
integrated data-mining platform. Neoplasia. Jan-Feb 2004;6:1-6.
12. Al-Shahrour F, Minguez P, Vaquerizas JM, Conde L, Dopazo J. BABELOMICS: a
suite of web tools for functional annotation and analysis of groups of genes in high-throughput experiments. Nucleic Acids Res. Jul 1 2005;33:W460-464.
13. Su AI, Wiltshire T, Batalov S, et al. A gene atlas of the mouse and human
protein-encoding transcriptomes. Proc Natl Acad Sci U S A. Apr 20 2004;101:6062-6067.
14. Golan-Mashiach M, Dazard JE, Gerecht-Nir S, et al. Design principle of gene
expression used by human stem cells: implication for pluripotency. Faseb J. Oct 21 2004:Epub ahead of print.
15. Sato N, Sanjuan IM, Heke M, Uchida M, Naef F, Brivanlou AH. Molecular signature
of human embryonic stem cells and its comparison with the mouse. Dev Biol. Aug 15 2003;260:404-413.
16. Skottman H, Mikkola M, Lundin K, et al. Gene expression signatures of seven
individual human embryonic stem cell lines. Stem Cells. Oct 2005;23:1343-1356.
17. Ge X, Yamamoto S, Tsutsumi S, et al. Interpreting expression profiles of cancers by
genome-wide survey of breadth of expression in normal tissues. Genomics. Aug 2005;86:127-141.
18. Lenburg ME, Liou LS, Gerry NP, Frampton GM, Cohen HT, Christman MF.
Previously unidentified changes in renal cell carcinoma gene expression identified by parametric analysis of microarray data. BMC Cancer. Nov 27 2003;3:31.
19. Hirst CE, Ng ES, Azzola L, et al. Transcriptional profiling of mouse and human ES
cells identifies SLAIN1, a novel stem cell gene. Dev Biol. May 1 2006;293:90-103.
20. Perez-Iratxeta C, Palidwor G, Porter CJ, et al. Study of stem cell function using
microarray experiments. FEBS Lett. Mar 21 2005;579:1795-1801.
21. Haferlach T, kohlmann A, Basso G, et al. A multi-center and multi-national program
to assess the clinical accuracy of the molecular subclassification of leukemia by gene expression profiling. Blood. 2005;106:224a.
22. Irizarry RA, Warren D, Spencer F, et al. Multiple-laboratory comparison of
microarray platforms. Nat Methods. May 2005;2:345-350.
23. Eisen MB, Spellman PT, Brown PO, Botstein D. Cluster analysis and display of
genome-wide expression patterns. Proc Natl Acad Sci U S A. 1998;95:14863-14868.
24. Cowan CA, Klimanskaya I, McMahon J, et al. Derivation of embryonic stem-cell lines
from human blastocysts. N Engl J Med. Mar 25 2004;350:1353-1356.
25. Inzunza J, Gertow K, Stromberg MA, et al. Derivation of human embryonic stem cell
lines in serum replacement medium using postnatal human fibroblasts as feeder cells. Stem Cells. Apr 2005;23:544-549.
26. Elghetany MT, Patel J. Assessment of CD24 expression on bone marrow neutrophilic
granulocytes: CD24 is a marker for the myelocytic stage of development. Am J Hematol. Dec 2002;71:348-349.
27. Semaphorin-Nomenclature-Committee. Unified nomenclature for the
semaphorins/collapsins. Semaphorin Nomenclature Committee. Cell. May 28 1999;97:551-552.
28. Assou S, Anahory T, Pantesco V, et al. The human cumulus-oocyte complex gene
expression profile. Human Reproduction. 2006;21:1705.
29. Sperger JM, Chen X, Draper JS, et al. Gene expression patterns in human embryonic
stem cells and human pluripotent germ cell tumors. Proc Natl Acad Sci U S A. Nov 11 2003;100:13350-13355.
30. Brandenberger R, Wei H, Zhang S, et al. Transcriptome characterization elucidates
signaling networks that control human ES cell growth and differentiation. Nat Biotechnol. Jul 2004;22:707-716.
31. Wei CL, Miura T, Robson P, et al. Transcriptome Profiling of Human and Murine
ESCs Identifies Divergent Paths Required to Maintain the Stem Cell State. Stem Cells. 2005;23:166-185.
32. Fortunel NO, Otu HH, Ng HH, et al. Comment on " 'Stemness': transcriptional
profiling of embryonic and adult stem cells" and "a stem cell molecular signature". Science. Oct 17 2003;302:393; author reply 393.
33. Suarez-Farinas M, Noggle S, Heke M, Hemmati-Brivanlou A, Magnasco MO.
Comparing independent microarray studies: the case of human embryonic stem cells. BMC Genomics. 2005;6:99.
34. Johnson J, Bagley J, Skaznik-Wikiel M, et al. Oocyte generation in adult mammalian
ovaries by putative germ cells in bone marrow and peripheral blood. Cell. Jul 29 2005;122:303-315.
35. Cauffman G, Van de Velde H, Liebaers I, Van Steirteghem A. Oct-4 mRNA and
protein expression during human preimplantation development. Mol Hum Reprod. Mar 2005;11:173-181.
36. Kristiansen G, Schluns K, Yongwei Y, Denkert C, Dietel M, Petersen I. CD24 is an
independent prognostic marker of survival in nonsmall cell lung cancer patients. Br J Cancer. Jan 27 2003;88:231-236.
37. Lavabre-Bertrand T, Duperray C, Brunet C, et al. Quantification of CD24 and CD45
antigens in parallel allows a precise determination of B-cell maturation stages: relevance for the study of B-cell neoplasias. Leukemia. Mar 1994;8:402-408.
38. Aigner S, Sthoeger ZM, Fogel M, et al. CD24, a mucin-type glycoprotein, is a ligand
for P-selectin on human tumor cells. Blood. May 1 1997;89:3385-3395.
39. White JA, Beckett-Jones B, Guo YD, et al. cDNA cloning of human retinoic
acid-metabolizing enzyme (hP450RAI) identifies a novel family of cytochromes P450. J Biol Chem. Jul 25 1997;272:18538-18541.
40. Geiman TM, Durum SK, Muegge K. Characterization of gene expression, genomic
structure, and chromosomal localization of Hells (Lsh). Genomics. Dec 15 1998;54:477-483.
41. Sato N, Meijer L, Skaltsounis L, Greengard P, Brivanlou AH. Maintenance of
pluripotency in human and mouse embryonic stem cells through activation of Wnt signaling by a pharmacological GSK-3-specific inhibitor. Nat Med. Jan 2004;10:55-63.
42. Ball C, Sherlock G, Parkinson H, et al. A guide to microarray experiments--an open
letter to the scientific journals. Lancet. Sep 28 2002;360:1019.
43. Abeyta MJ, Clark AT, Rodriguez RT, Bodnar MS, Pera RA, Firpo MT. Unique gene
expression signatures of independently-derived human embryonic stem cell lines. Hum Mol Genet. Mar 15 2004;13:601-608.
44. Aghajanova L, Skottman H, Stromberg AM, Inzunza J, Lahesmaa R, Hovatta O.
Expression of leukemia inhibitory factor and its receptors is increased during differentiation of human embryonic stem cells. Fertil Steril. Oct 2006;86 Suppl 4:1193-1209.
45. Armstrong L, Hughes O, Yung S, et al. The role of PI3K/AKT, MAPK/ERK and
NFkappabeta signalling in the maintenance of human embryonic stem cell pluripotency and viability highlighted by transcriptional profiling and functional analysis. Hum Mol Genet. Jun 1 2006;15:1894-1913.
46. Beqqali A, Kloots J, Ward-van Oostwaard D, Mummery C, Passier R. Genome-wide
transcriptional profiling of human embryonic stem cells differentiating to cardiomyocytes. Stem Cells. Aug 2006;24:1956-1967.
47. Bhattacharya B, Miura T, Brandenberger R, et al. Gene expression in human
embryonic stem cell lines: unique molecular signature. Blood. Apr 15 2004;103:2956-2964.
48. Bhattacharya B, Cai J, Luo Y, et al. Comparison of the gene expression profile of
undifferentiated human embryonic stem cell lines and differentiating embryoid bodies. BMC Dev Biol. Oct 5 2005;5:22.
49. Brandenberger R, Khrebtukova I, Thies RS, et al. MPSS profiling of human
embryonic stem cells. BMC Dev Biol. Sep 10 2004;4:10.
50. Brimble SN, Zeng X, Weiler DA, et al. Karyotypic stability, genotyping,
differentiation, feeder-free maintenance, and gene expression sampling in three human embryonic stem cell lines derived prior to August 9, 2001. Stem Cells Dev. Dec 2004;13:585-597.
51. Brimble SN, Sherrer ES, Uhl EW, et al. The Cell Surface Glycosphingolipids SSEA-3
and SSEA-4 are not Essential for Human ES Cell Pluripotency. Stem Cells. Sep 28 2006.
52. Cai J, Chen J, Liu Y, et al. Assessing self-renewal and differentiation in hESC lines.
Stem Cells. Nov 17 2005.
53. Calhoun JD, Rao RR, Warrenfeltz S, et al. Transcriptional profiling of initial
differentiation events in human embryonic stem cells. Biochem Biophys Res Commun. Oct 15 2004;323:453-464.
54. Darr H, Mayshar Y, Benvenisty N. Overexpression of NANOG in human ES cells
enables feeder-free growth while inducing primitive ectoderm features. Development. Mar 2006;133:1193-1201.
55. Dvash T, Mayshar Y, Darr H, et al. Temporal gene expression during differentiation
of human embryonic stem cells and embryoid bodies. Hum Reprod. Dec 2004;19:2875-2883.
56. Enver T, Soneji S, Joshi C, et al. Cellular differentiation hierarchies in normal and
culture-adapted human embryonic stem cells. Hum Mol Genet. Nov 1 2005;14:3129-3140.
57. Ginis I, Luo Y, Miura T, et al. Differences between human and mouse embryonic stem
cells. Dev Biol. May 15 2004;269:360-380.
58. Josephson R, Sykes G, Liu Y, et al. A molecular scheme for improved
characterization of human embryonic stem cell lines. BMC Biol. 2006;4:28.
59. Kim CG, Lee JJ, Jung DY, et al. Profiling of differentially expressed genes in human
stem cells by cDNA microarray. Mol Cells. Jun 30 2006;21:343-355.
60. Li H, Liu Y, Shin S, et al. Transcriptome coexpression map of human embryonic stem
cells. BMC Genomics. 2006;7:103.
61. Liu Y, Shin S, Zeng X, et al. Genome wide profiling of human embryonic stem cells
(hESCs), their derivatives and embryonal carcinoma cells to develop base profiles of U.S. Federal government approved hESC lines. BMC Dev Biol. 2006;6:20.
62. Miura T, Luo Y, Khrebtukova I, et al. Monitoring early differentiation events in
human embryonic stem cells by massively parallel signature sequencing and expressed sequence tag scan. Stem Cells Dev. Dec 2004;13:694-715.
63. Player A, Wang Y, Bhattacharya B, Rao M, Puri RK, Kawasaki ES. Comparisons
between transcriptional regulation and RNA expression in human embryonic stem cell lines. Stem Cells Dev. Jun 2006;15:315-323.
64. Pyle AD, Donovan PJ, Lock LF. Chipping away at 'stemness'. Genome Biol.
2004;5:235.
65. Rao M. Conserved and divergent paths that regulate self-renewal in mouse and human
embryonic stem cells. Dev Biol. Nov 15 2004;275:269-286.
66. Rao RR, Calhoun JD, Qin X, Rekaya R, Clark JK, Stice SL. Comparative
transcriptional profiling of two human embryonic stem cell lines. Biotechnol Bioeng. Nov 5 2004;88:273-286.
67. Rao RR, Stice SL. Gene expression profiling of embryonic stem cells leads to greater
understanding of pluripotency and early developmental events. Biol Reprod. Dec 2004;71:1772-1778.
68. Richards M, Tan SP, Tan JH, Chan WK, Bongso A. The transcriptome profile of
human embryonic stem cells as defined by SAGE. Stem Cells. 2004;22:51-64.
69. Richards M, Tan SP, Chan WK, Bongso A. Reverse serial analysis of gene expression
(SAGE) characterization of orphan SAGE tags from human embryonic stem cells identifies the presence of novel transcripts and antisense transcription of key pluripotency genes. Stem Cells. May 2006;24:1162-1173.
70. Robson P. The maturing of the human embryonic stem cell transcriptome profile.
Trends Biotechnol. Dec 2004;22:609-612.
71. Sato N, Brivanlou AH. Microarray approach to identify the signaling network
responsible for self-renewal of human embryonic stem cells. Methods Mol Biol. 2006;331:267-283.
72. Skottman H, Stromberg AM, Matilainen E, Inzunza J, Hovatta O, Lahesmaa R.
Unique gene expression signature by human embryonic stem cells cultured under serum-free conditions correlates with their enhanced and prolonged growth in an undifferentiated stage. Stem Cells. Jan 2006;24:151-167.
73. Sun BW, Yang AC, Feng Y, et al. Temporal and parental-specific expression of
imprinted genes in a newly derived Chinese human embryonic stem cell line and embryoid bodies. Hum Mol Genet. Jan 1 2006;15:65-75.
74. Xu RH, Chen X, Li DS, et al. BMP4 initiates human embryonic stem cell
differentiation to trophoblast. Nat Biotechnol. Dec 2002;20:1261-1264.
75. Zeng X, Miura T, Luo Y, et al. Properties of pluripotent human embryonic stem cells
BG01 and BG02. Stem Cells. 2004;22:292-312.
Tables
Table 1 – hESC: laboratory of origin and karyotype
hESC Laboratory of origin Karyotype
HUES1 Douglas Melton, Harvard p20 - 46,XX
p30 - 46,XX p40 - 46,XX, t(1;10)
HUES3 Douglas Melton, Harvard p23 - 46,XY
p49 - 47,XXY
HS293 Outi Hovatta, Karolinska
Institute
p49 - 46,XY
HS235 Outi Hovatta, Karolinska
Institute
p75 - 46,XX
Table 2 – 43 original studies or reviews analyzing hESC transcriptome
Reference Technique/Review
(Abeyta et al., 2004) [43] Microarray
(Aghajanova et al., 2006) [44] Microarray
(Armstrong et al., 2006) [45] Microarray
(Beqqali et al. 2006)[46] Microarray
(Bhattacharya et al., 2004) [47] Microarray
(Bhattacharya et al., 2005) [48] Microarray
(Boyer et al., 2005) [10] ChIP chip
(Brandenberger et al., 2004b) [30] ESTs
(Brandenberger et al., 2004a) [49] MPSS
(Brimble et al., 2004) [50] MPSS
(Brimble et al. 2006) [51] Microarray
(Cai et al., 2005) [52] Illumina BeadChips
(Calhoun et al., 2004) [53] Microarray
(Darr et al., 2006) [54] Microarray
(Dvash et al., 2004) [55] Microarray
(Enver et al., 2005) [56] Microarray
(Ginis et al., 2004) [57] Microarray
(Golan-Mashiach et al., 2004) [14] Microarray
(Hirst et al.,2006) [19] Microarray
(Josephson et al. 2006) [58] Illumina BeadChips
(Kim et al., 2006) [59] Microarray
(Li et al. 2006) [60] Illumina BeadChips
(Liu et al. 2006) [61] Illumina BeadChips
(Miura et al., 2004) [62] MPSS and EST
(Perez-Iratxeta et al., 2005) [20] Microarray
(Player et al., 2006) [63] Microarray
(Pyle et al., 2004) [64] Review
(Rao M., 2004) [65] Review
(Rao R. et al., 2004) [66] Microarray
(Rao R. and Stice, 2004) [67] Review
(Richards et al., 2004) [68] SAGE
(Richards et al., 2006) [69] SAGE
(Robson, 2004) [70] Review
(Sato et al., 2003) [15] Microarray
(Sato and Brivanlou, 2006) [71] Microarray (protocol
description)
(Skottman et al., 2005) [16] Microarray
(Skottman et al., 2006) [72] Microarray
(Sperger et al., 2003) [29] Microarray
(Suarez-Fariñas et al., 2005) [33] Meta-analysis
(Sun et al., 2006) [73] Microarray
(Wei et al., 2005) [31] MPSS
(Xu et al. 2002) [74] Microarray
(Zeng et al., 2004) [75] Microarray
Table 3 - 48 genes overexpressed in hESCs compared to differentiated cell types in at
least 10 studies
Abbreviation Name Chr. (£) Unigene
Nb of
studies Ratio Und/Dif Signal (§)
POU5F1 POU domain, class 5, transcription factor 1 6p21.31 Hs.249184 20 56.4
TDGF1 Teratocarcinoma-derived growth factor 1 3p21.31 Hs.385870 17 55.0
DPPA4 Developmental pluripotency associated 4 3q13.13 Hs.317659 16 30.1
LIN28 Lin-28 homolog (C. elegans) 1p36.11 Hs.86154 16 24.8
NANOG Nanog homeobox 12p13.31 Hs.329296 15 88.9
DNMT3B DNA (cytosine-5-)-methyltransferase 3 beta 20q11.2 Hs.251673 15 27.8
TERF1 Telomeric repeat binding factor (NIMA-interacting) 1 8q13 Hs.442707 15 18.9
SEMA6A Semaphorin 6A 5q23.1 Hs.156967 15 12.3
M6PR Mannose-6-phosphate receptor (cation dependent) 12p13 Hs.134084 15 10.6
SNRPN Small nuclear ribonucleoprotein polypeptide N 15q11.2 Hs.525700 15 7.3
FLJ10884 Hypothetical protein FLJ10884 1p31.3 Hs.562195 14 260.7
LEFTY1 Left-right determination factor 1 1q42.1 Hs.278239 14 34.1
GAL Galanin 11q13.2 Hs.278959 14 21.4
SEPHS1 Selenophosphate synthetase 1 10p14 Hs.124027 14 6.3
GABRB3 Gamma-aminobutyric acid (GABA) A receptor, beta 3 15q11.2-q1 Hs.302352 13 15.3
SOX2 SRY (sex determining region Y)-box 2 3q26.3-q27 Hs.518438 13 15.3
LECT1 Leukocyte cell derived chemotaxin 1 13q14-q21 Hs.421391 12 37.2
LOC90806 Similar to RIKEN cDNA 2610307I21 1q32.3 Hs.157078 12 14.6
BUB1 BUB1 budding uninhibited by benzimidazoles 1 homolog 2q14 Hs.469649 12 11.2
PSIP1 PC4 and SFRS1 interacting protein 1 9p22.3 Hs.493516 12 5.4
INDO Indoleamine-pyrrole 2,3 dioxygenase 8p12-p11 Hs.840 11 34.4
HELLS Helicase, lymphoid-specific 10q24.2 Hs.546260 11 19.3
GPC4 Glypican 4 Xq26.1 Hs.58367 11 15.4
ITGB1BP3 Integrin beta 1 binding protein 3 19p13.3 Hs.135458 11 15.3
CYP26A1 Cytochrome P450, family 26, subfamily A, polypeptide 1 10q23-q24 Hs.150595 11 14.2
MCM5 MCM5 minichromosome maintenance deficient 5 22q13.1 Hs.517582 11 11.9
MTHFD1 Methylenetetrahydrofolate dehydrogenase 1 14q24 Hs.435974 11 8.7
PPAT Phosphoribosyl pyrophosphate amidotransferase 4q12 Hs.331420 11 8.3
SLC16A1 AKR7 family pseudogene 1p12 Hs.75231 11 7.8
NASP Nuclear autoantigenic sperm protein (histone-binding) 1p34.1 Hs.319334 11 7.4
DLG7 Discs, large homolog 7 (Drosophila) 14q22.3 Hs.77695 11 6.7
UGP2 UDP-glucose pyrophosphorylase 2 2p14-p13 Hs.516217 11 6.1
MSH2 MutS homolog 2, colon cancer, nonpolyposis type 1 2p22-p21 Hs.156519 11 3.4
ZIC3 Zic family member 3 heterotaxy 1 Xq26.2 Hs.111227 10 30.7
PIM2 Pim-2 oncogene Xp11.23 Hs.496096 10 18.5
HRASLS3 HRAS-like suppressor 3 11q12.3-q1 Hs.502775 10 16.8
ALPL Alkaline phosphatase, liver/bone/kidney 1p36.1-p34 Hs.75431 10 15.0
AASS Aminoadipate-semialdehyde synthase 7q31.3 Hs.433075 10 13.8
MGST1 Microsomal glutathione S-transferase 1 12p12.3-p1 Hs.389700 10 10.9
GDF3 Growth differentiation factor 3 12p13.1 Hs.86232 10 9.5
HSPA4 Heat shock 70kDa protein 4 5q31.1-q31 Hs.90093 10 9.2
PHF17 PHD finger protein 17 4q26-q27 Hs.12420 10 9.2
UNG Uracil-DNA glycosylase 12q23-q24. Hs.191334 10 6.7
USP9X Ubiquitin specific peptidase 9, X-linked Xp11.4 Hs.77578 10 5.7
CEBPZ CCAAT/enhancer binding protein zeta 2p22.2 Hs.135406 10 5.4
CRMP1 Collapsin response mediator protein 1 4p16.1-p15 Hs.135270 10 5.3
BMPR1A Bone morphogenetic protein receptor, type IA 10q22.3 Hs.524477 10 5.1
ORC1L Origin recognition complex, subunit 1-like (yeast) 1p32 Hs.17908 10 3.9
(£) Chromosomal location. (§) Ratio of mean expression in hESC samples to mean expression in non-hESC samples.
Table 4 - 40 genes specifically expressed in hESCs (cluster “a” in Figure 1C)
Abbreviation Name Chr. (£) Unigene
Nb of studies Ratio Und/Dif Signal (§) Presence Call in non-hESC tissues (#)
NANOG Nanog homeobox 12p13.31 Hs.329296 15 88.9 0
POU5F1 POU domain, class 5, transcription factor 1 6p21.31 Hs.249184 20 56.4 0
LIN28 lin-28 homolog (C. elegans) 1p36.11 Hs.86154 16 24.8 0
CDC25A cell division cycle 25A 3p21 Hs.1634 5 19.4 0
PRDM14 PR domain containing 14 8p21-p12 Hs.287532 6 13.5 0
SLD5 SLD5 homolog 8p11.21 Hs.521557 5 13.2 0
C14orf115 chromosome 14 open reading frame 115 14q24.3 Hs.196530 9 12.9 0
GDF3 growth differentiation factor 3 12p13.1 Hs.86232 10 9.5 0
GPR19 G protein-coupled receptor 19 12p12.3 Hs.92458 6 6.3 0
GPR23 G protein-coupled receptor 23 Xq13-q21.1 Hs.522701 3 2.7 0
FLJ10884 hypothetical protein FLJ10884 1p31.3 Hs.562195 14 260.7 1
ZIC3 Zic family member 3 heterotaxy 1 Xq26.2 Hs.111227 10 30.7 1
CLDN6 claudin 6 16p13.3 Hs.533779 9 14.4 1
CYP26A1 cytochrome P450, family 26, A1 10q23-q24 Hs.150595 11 14.2 1
CXorf15 chromosome X open reading frame 15 Xp22.2 Hs.555961 3 12.4 1
HESX1 homeo box (expressed in ES cells) 1 3p21.2-p21 Hs.171980 5 10.3 1
KIAA0523 KIAA0523 protein 17p13.2 Hs.370166 4 6.5 1
MGC3101 hypothetical protein MGC3101 16q24.3 Hs.301394 5 5.0 1
CHEK2 CHK2 checkpoint homolog (S. pombe) 22q11 Hs.558896 7 3.3 1
RNU3IP2 RNA, U3 small nucleolar interacting protein 2 3p21.2 Hs.153768 4 3.0 1
GJA7 gap junction protein, alpha 7 17q21.31 Hs.532593 4 2.3 1
ETV4 ets variant gene 4 17q21 Hs.434059 9 9.8 2
DNMT3A DNA (cytosine-5-)-methyltransferase 3 alpha 2p23 Hs.515840 5 4.2 2
DCC1 defective in sister chromatid cohesion homolog 1 8q24.12 Hs.315167 5 3.5 2
SLC5A6 solute carrier family 5, member 6 2p23 Hs.435735 3 2.9 2
TDGF1 teratocarcinoma-derived growth factor 1 3p21.31 Hs.385870 17 55.0 3
PWP2H PWP2 periodic tryptophan protein homolog 21q22.3 Hs.449076 4 27.0 3
ABHD9 abhydrolase domain containing 9 19p13.12 Hs.156457 3 9.7 3
EPHA1 EPH receptor A1 7q34 Hs.89839 7 8.0 3
MYBL2 v-myb homolog-like 2 20q13.1 Hs.179718 3 4.0 3
PRO1853 hypothetical protein PRO1853 2p22.2 Hs.433466 5 5.9 4
ORC1L origin recognition complex, subunit 1-like (yeast) 1p32 Hs.17908 10 3.9 4
MCM10 minichromosome maintenance deficient 10 10p13 Hs.198363 5 3.8 4
FLJ20105 FLJ20105 protein Xq13.1 Hs.47558 5 3.3 4
ORC2L origin recognition complex, subunit 2-like (yeast) 2q33 Hs.444870 3 2.6 4
FLJ12484 interferon stimulated exonuclease like 1 15q26.1 Hs.37747 6 4.0 5
HELLS helicase, lymphoid-specific 10q24.2 Hs.546260 11 19.3 6
BRRN1 barren homolog (Drosophila) 2q11.2 Hs.308045 5 4.6 6
RBM14 RNA binding motif protein 14 11q13.2 Hs.11170 3 4.1 7
DTYMK deoxythymidylate kinase (thymidylate kinase) 2q37.3 Hs.471873 3 3.1 7
(£) Chromosomal location. (§) Ratio of mean expression in hESC samples to mean expression in non-hESC samples. (#) number of non-hESC samples with a detection call “Present” (out of 193 non-hESC samples).
Table 5 – 30 selected genes underexpressed in hESCs compared to differentiated cell
types and found by at least 6 studies
Abbreviation Name Unigene
Chr. (£) Nb of
studies
Ratio Dif/Und Signal (§)
LUM Lumican Hs.406475 12q21.3 9 18.1
COL3A1 Collagen, type III, alpha 1 Hs.443625 2q31 9 14.0
COL1A1 Collagen, type I, alpha 1 Hs.172928 17q21.3 9 5.8
IGFBP3 Insulin-like growth factor binding protein 3 Hs.450230 7p13-p12 8 14.1
ACTA2 Actin, alpha 2, smooth muscle, aorta Hs.500483 10q23.3 8 14.0
P4HA2 Procollagen-proline, 2-oxoglutarate 4-dioxygenase A2 Hs.519568 5q31 8 5.5
SPARC Secreted protein, acidic, cysteine-rich (osteonectin) Hs.111779 5q31.3 8 4.7
COL1A2 Collagen, type I, alpha 2 Hs.489142 7q22.1 8 4.6
KRT18 Keratin 18 Hs.406013 12q13 8 3.8
DCN Decorin Hs.156316 12q13.2 7 39.9
BMP4 Bone morphogenetic protein 4 Hs.68879 14q22 7 15.0
COL5A1 Collagen, type V, alpha 1 Hs.210283 9q34 7 12.6
COL2A1 Collagen, type II, alpha 1 Hs.408182 12q13 7 10.5
RHOBTB3 Rho-related BTB domain containing 3 Hs.445030 5q15 7 6.4
NDRG1 N-myc downstream regulated gene 1 Hs.372914 8q24.3 7 6.1
COL6A3 Collagen, type VI, alpha 3 Hs.233240 2q37 7 6.0
CST3 Cystatin C Hs.304682 20p11.21 7 5.3
KRT8 Keratin 8 Hs.533782 12q13 7 5.2
CD47 CD47 antigen (Rh-related antigen) Hs.446414 3q13.1 7 3.5
HAND1 Heart and neural crest derivatives expressed 1 Hs.152531 5q33 6 61.9
IGF2 Insulin-like growth factor 2 (somatomedin A) Hs.373908 11p15.5 6 23.6
CXCL14 Chemokine (C-X-C motif) ligand 14 Hs.483444 5q31 6 10.5
COL11A1 Collagen, type XI, alpha 1 Hs.523446 1p21 6 8.7
IGFBP7 Insulin-like growth factor binding protein 7 Hs.479808 4q12 6 8.0
IL6ST Interleukin 6 signal transducer (gp130) Hs.532082 5q11 6 7.6
COL5A2 Collagen, type V, alpha 2 Hs.445827 2q14-q32 6 6.8
KRT7 Keratin 7 Hs.411501 12q12 6 6.5
KRT19 Keratin 19 Hs.514167 17q21.2 6 6.5
BMP1 Bone morphogenetic protein 1 Hs.1274 8p21 6 6.1
CDKN1A/P21 Cyclin-dependent kinase inhibitor 1A (p21, Cip1) Hs.370771 6p21.2 6 4.6
(£) Chromosomal location. (§) Ratio of mean expression in non-hESC samples to mean expression in hESC samples.
Supplemental Tables:
- Supplemental Table S1 : details on the 43 hESC transcriptome publications including the hESC used, the number of genes found up and down regulated (Excel file)
- Supplemental Table S2 : 1959 genes found in at least two hESC lists, including the hESC consensus list (Excel file)
- Supplemental Table S3: 1560 genes found in at least two differentiation gene lists, including the consensus differentiation list (Excel file)
- Supplemental Table S4: signal and detection call of 14 074 probesets from the U33A microarray (Affymetrix) in 217 hESC and non-hESC samples from 8 studies (Excel file) - Supplemental Table S5: 4 clusters of genes highlighted in figure 1C (Excel file)
Legends to Figures
Figure 1: Meta-analysis of published “hESC” and “differentiation” gene lists
1959 different genes were found overexpressed in hESCs compared to differentiated tissues by at least two out of 20 independent studies (purple pyramid) (A). Of these, 1076 genes were found by at least three studies, 48 genes by at least 10 studies and only 1 gene (POU5F1) by all studies. Eleven studies provided lists of genes downregulated in hESCs compared to more differentiated samples (yellow pyramid) (B). 1560 genes were found downregulated in hESC by at least two studies, 783 by at least 3 different studies, three by at least 9 different studies and none by all studies.
Heat map of gene expression detection for the hESC gene list across 24 hESC and 193 fetal and adult tissues samples analyzed with the U133A microarray (828 probesets) (C). Red stands for a “Present” detection call (i.e. gene expression confidently detected according to the GCOS 1.2 software), grey for “Marginal” and yellow for “Absent”. Cluster a: genes exclusively expressed in hESCs; b: gene expressed in hESCs and central nervous system samples; c: cell cycle genes; d: genes expressed in hESCs and in most tissues analyzed. The clustering was carried out using the Cluster and Treeview software. Only genes were clustered. hFF: human foreskin fibroblasts; OV: ovary; CNS: central nervous system; PNS: peripheral nervous system; SK: skin and keratinocytes; LU: lung; DT: digestive tract; TH: thyroid; AD: adipocytes; K&P: kidney and prostate; H&M: heart and muscle; HEMATO: various hematopoietic tissues; UT: uterus; PL: placenta.
Comparison of GO annotations between hESC genes and differentiation genes (D). We compared the frequency of GO annotations of genes overexpressed in hESCs to those underexpressed in hESCs. The statistical analysis was carried out using the Babelomics webtool (http://babelomics.bioinfo.cipf.es/). Histograms show the percentage of genes with
the specified GO annotation in the group of genes overexpressed in hESCs (purple) or in differentiated tissues (yellow). P : adjusted FDR P-value.
Figure 2: CD24 and SEMA6A are two new hESC markers
Expression histograms of CD24 across the U133A compendium (A). These histograms were obtained from our Amazonia! website from the U133A oligonucleotide microarray (Affymetrix) datasets. The Y-axis features the signal value obtained with GCOS 1.2 software. Microarray expression histograms of CD24 gene before and after non-lineage differentiation into EBs (data from the study of [56]) (B). Mean U133A microarray signal value of CD24 (C) and CD44 (D) in 24 hESC samples versus two human fibroblasts samples. Flow cytometry analysis of CD24 on HUES1 hESCs co-cultured with hFF (E), of hFF alone (F) and of CD44 on hFF alone (G), and double CD24 and CD44 labeling of HUES1 (passage 37), HUES3 (p43), HS235 (p30) and HS293 (p68) cells co-cultured with hFF (H). Expression histogram of SEMA6A (I). Microarray expression histograms of SEMA6A gene before and after differentiation into EBs (data from the study of [56]) (J). Mean U133A microarray signal value of SEMA6A in 24 hESC samples versus two human fibroblasts samples (K). Indirect immunofluorescence localization of SEMA6A, POU5F1/OCT3/4, or both and corresponding Hoechst nuclear staining in the HUES1 (L) and HUES3 hESCs (M) cultured on murine embryonic and human fibroblasts, respectively. Scale bar: 25µm. White arrow: MEF (L) or hFF (M).
Figure 3: expression of selected genes using Amazonia!
Expression histograms of five hESC specific genes (POU5F1, NANOG, GPR19, HELLS and CYP26A1), two genes expressed in nonlineage-differentiated hESC cells (HAND1 and IGF2), two factors highly expressed by human fibroblasts and smooth muscle that may contribute to the supporting properties of fibroblasts to hESC culture (Gremlin and MMP1), one