HAL Id: hal-02973471
https://hal.archives-ouvertes.fr/hal-02973471
Submitted on 21 Oct 2020HAL is a multi-disciplinary open access
archive for the deposit and dissemination of sci-entific research documents, whether they are pub-lished or not. The documents may come from teaching and research institutions in France or abroad, or from public or private research centers.
L’archive ouverte pluridisciplinaire HAL, est destinée au dépôt et à la diffusion de documents scientifiques de niveau recherche, publiés ou non, émanant des établissements d’enseignement et de recherche français ou étrangers, des laboratoires publics ou privés.
Experimental validation and comparison of a SiC
MOSFET based 100 kW 1.2 kV 20 kHz three-phase dual
active bridge converter using two vector groups
Thomas Lagier, Piotr Dworakowski, Cyril Buttay, Philippe Ladoux, Andrzej
Wilk, Philippe Camail, Elissa Cresenta Anak Justin
To cite this version:
Thomas Lagier, Piotr Dworakowski, Cyril Buttay, Philippe Ladoux, Andrzej Wilk, et al.. Experimen-tal validation and comparison of a SiC MOSFET based 100 kW 1.2 kV 20 kHz three-phase dual active bridge converter using two vector groups. EPE’20 ECCE Europe, Sep 2020, Lyon ( virtual ), France. �10.23919/EPE20ECCEEurope43536.2020.9215631�. �hal-02973471�
Experimental validation and comparison of a SiC MOSFET based 100 kW
1.2 kV 20 kHz three-phase dual active bridge converter using two vector
groups
Thomas LAGIER1, Piotr DWORAKOWSKI1, Cyril BUTTAY1,2, Philippe LADOUX3, Andrzej
WILK4, Philippe CAMAIL1,2, Elissa Cresenta ANAK JUSTIN1 1 SUPERGRID INSTITUTE
23 rue Cyprian 69100 Villeurbanne, France URL: http://www.supergrid-institute.com
2 Université de Lyon, Laboratoire Ampére, INSA Lyon, CNRS
21 bis avenue Jean Capelle 69100 Villeurbanne, France URL: http://www.ampere-lab.fr
3 LAPLACE, UNIVERSITÉ DE TOULOUSE, CNRS, INPT, UPS
2 rue Charles Camichel 31000 Toulouse, France URL: http://www.laplace.univ-tlse.fr
4 GDAŃSK UNIVERSITY OF TECHNOLOGY, FACULTY OF ELECTRICAL AND CONTROL
ENGINEERING Gabriela Narutowicza 11/12
80-233 Gdańsk, Poland
Acknowledgements
This work was supported by a grant overseen by the French National Research Agency (ANR) as part of the “Investissements d’Avenir” Program (ANE-ITE-002-01).
Keywords
High Voltage power converter, Voltage Source Converter (VSC), MOSFET, Silicon Carbide (SiC), ZVS converters.
Abstract
The Dual Active Bridge appears as a promising DC-DC converter topology when galvanic isolation and bidirectional power flow are required. Among its advantages, Zero Voltage Switching allows the switching losses to be significantly reduced. For high power applications, the three-phase topology variant may be interesting in order to reach a higher power density, especially when a three-phase transformer is implemented instead of three single-phase transformers. Moreover, the transformer vector group offers a new degree of freedom for the designers. In this paper, the authors present the experimental validation of a 1.2 kV – 100 kW – 20 kHz three-phase Dual Active Bridge converter using two medium frequency transformers and different vector groups.
Introduction
The Dual Active Bridge (DAB) topology is an interesting candidate for high power DC-DC converters when galvanic isolation and bidirectional power flow are required. In addition to its modularity and simplicity, Zero Voltage Switching (ZVS) operation allows a higher switching frequency, which in turn enables a higher power density. Compared to the single-phase DAB, the three-phase topology variant, depicted in Fig. 1, allows reducing the input and output filters and transformer size [1–6].
Moreover, since several vector groups (Yy, ΔΔ and even YΔ) can be chosen for the three-phase transformer, a new degree of freedom can be used to optimize the design. Some papers have already studied the three-phase DAB, but the use of a single three-phase medium frequency transformer (instead of three single-phase transformers) is not well documented. Moreover, in this paper, the authors propose a global comparison between two Medium Frequency Transformers (MFT) with two vector groups (Yy and ΔΔ).
After a short introduction of the topology and the DC-DC converter prototype, this paper compares the performance of the transformers and the voltage source inverters (VSI). Then, the performances are summarized in order to identify the configuration which presents the best compromise for this application.
Fig. 1. Three-phase dual active bridge converter
Three phase dual active bridge converter
The three-phase DAB is composed of two VSIs and a MFT. The theoretical analysis of the circuit [2] allows the calculation of the expressions for the transmitted power and the ZVS operating range as a function of the input voltage (Vin), the reactance of leakage inductance seen from the primary side of the
transformer (Xl) and the ratio between the input and output voltages, calculated by (1)
𝑘 = 𝑉𝑜𝑢𝑡 𝑚𝑉𝑖𝑛
(1)
where m is the transformer’s turns ratio.
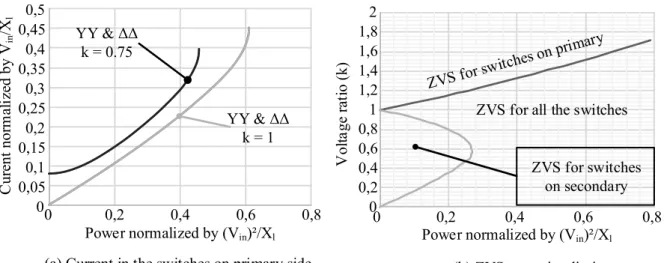
Fig. 2 compares the theoretical RMS currents in the switches and the ZVS operating limits for Yy and ΔΔ vector groups.
Fig. 2. Theoretical current in the switches and ZVS operating ranges for Yy and ΔΔ vector groups calculated using the equations of [2].
1 : m Qd Qa Qb Vin iin iac/U Q5 Q6 Vout iout Q3 Q4 Q1 Q2 Qc iac/V Qe Qf iac/W C ur ent no rm al iz ed b y V in /Xl Power normalized by (Vin)²/Xl 0 0,05 0,1 0,15 0,2 0,25 0,3 0,35 0,4 0,45 0,5 0 0,2 0,4 0,6 0,8 YY & ΔΔ k = 0.75 YY & ΔΔ k = 1 V ol ta ge r at io (k ) Power normalized by (Vin)²/Xl 0 0,2 0,4 0,6 0,8 1 1,2 1,4 1,6 1,8 2 0 0,2 0,4 0,6 0,8 ZVS for switches on secondary ZVS for all the switches
As it can be seen, there is no difference between the two solutions. Consequently, the performances and losses of the power switches are expected to be similar.
Experimental validation
Two three-phase MFT prototypes have been developed in order to perform a comparative analysis. For the first prototype T1, the vector group can be changed between Yy and ΔΔ while the Yy vector group has been selected for the second prototype T2. Both transformer prototypes were built using MnZn ferrite 3C90 and Litz wire. The design details are presented in [7], [8]. The main transformer specifications for k = 1 are presented in Table 1. The core power loss calculation is based on [9], [10] and the winding power loss is based on [11], [12].
Table 1. Three-phase medium frequency transformer specifications at k = 1: MFT T1
(Yy and ΔΔ) and MFT T2 (Yy only)
T1 ΔΔ T1 Yy T2 Yy
Winding voltage (V) 980 566 566
Winding current (A) 36 65 65
Core flux density (T) 0.22 0.15 0.27
Winding current density (A/mm2) 1.2 2.1 2.1
Core power loss at 100°C (W) 432 122 230
Winding power loss at 80°C (W) 155 229 214
Equivalent series resistance (mΩ) 13.7 18.1 17.1 Equivalent magnetizing inductance (mH) 0.2 ... 0.7 0.5 ... 2 1 ... 2.5 Equivalent leakage inductance (μH) 11.3 34 15.8
Dimensions (cm) 67 x 20 x 35 45 x 20 x 30
Weight (kg) 57 36
Even if the theoretical studies have shown similar performances for the two configurations, experimental validations were necessary to validate and compare the behavior of the converter. In order to investigate this, a Silicon Carbide (SiC) based 1.2 kV – 100 kW – 20 kHz DC-DC converter prototype was developed and presented in [1]. The three-phase DAB test bench implementation is presented in Fig. 3.
The power circuit is arranged in back-to-back fashion in order to test the DC-DC converter at full power with a minimum energy consumption. The converter output is connected to its input and the whole is supplied from the DC power supply which sets the voltage reference and compensates for the power losses in the converter.
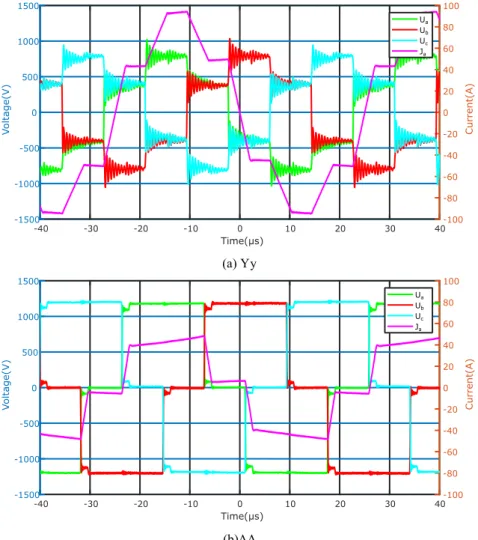
Fig. 4 presents the experimental waveforms for Yy and ΔΔ vector groups, obtained with the MFT T1 prototype.
Fig. 4. Experimental waveforms showing the voltages and currents across the windings of the transformer (Vin = 1 kV and Pdc = 80 kW)
Fig. 5 presents the measured efficiency for all the configurations.
(a) Yy
Fig. 5. Measured efficiency for the three configurations at Vin = 1.2 kV and k = 1.
As it can be seen, the Yy vector groups present the best efficiency over the entire power range. The following sections explain this difference.
Study of the power losses in the transformer
Fig. 6 presents the RMS current values in the windings on the primary side of the transformer. The currents are similar on the secondary side.
Fig. 6. Comparison of the RMS currents in the transformer primary winding
As expected, the currents in the windings are lower for the ΔΔ configuration, except at low power, where the contribution of the transformer magnetizing current is higher. This causes higher copper losses with ΔΔ configuration for a power lower than 7 kW.
At high power, the ΔΔ currents are lower by a factor of about √3. Consequently, at nominal power, the copper losses (𝑅𝐼𝑎𝑐2 ) are expected to be smaller, by a ratio of 3 ((√3)2).
Regarding the core losses, the Improved General Steinmetz equation (2-4) [10] can be used to understand their evolution. These losses depend on the voltage across the i-th winding (ui where i =
1…6), the maximum flux density (Bmax), the core volume (Vc), the core cross-section (Ac), the frequency
(fac) and the temperature (T). The coefficients used in the equations are depicted in Table 2. With the ΔΔ
vector group, the voltage applied on the windings is √3 higher than with Yy. However, the maximum flux density is less than √3 higher (Table 1). Considering the same transformer design for ΔΔ and Yy,
95% 96% 97% 98% 99% 100% 20 40 60 80 100 E ff icien cy ( %) Power (kW) T1 Yy T2 ΔΔ T2 Yy 0 10 20 30 40 50 60 70 0 20 40 60 80 100 C ur ren t ( A ) Power (kW) T1 Yy T1 ΔΔ T2 Yy
the core losses are obviously higher with ΔΔ. However, if there were two independent designs, one for ΔΔ and one for Yy, then core losses would be lower with ΔΔ.
Table 2. Ferrite 3C90 Steinmetz coefficients [13]
Parameter Value k 3.2 α 1.46 β 2.75 c0 2.45 c1 3.1e-2 c2 1.65e-4 𝑃𝑐 = 𝑘𝑠𝑘𝑇𝑉𝑐(2𝐵𝑚𝑎𝑥)𝛽−𝛼𝑓𝑎𝑐∫ | 𝑢𝑖 𝑁1𝐴𝑐| 𝛼 𝑑𝑡 𝑇 0 (2) 𝑘𝑠 = 𝑘 2𝛽+1𝜋𝛼−1(0.2761 + 1.7061 𝛼 + 1.354) (3) 𝑘𝑇 = 𝑐0− 𝑐1𝑇 + 𝑐2𝑇2 (4)
With the ΔΔ vector group, the lower copper losses obtained with the lower currents are not sufficient to compensate the increase in core losses caused by the higher voltage. This is the reason why losses are more important in ΔΔ. Moreover, as the core losses depend only on the voltage, they are expected to be constant with the transmitted power. This would explain why the difference in efficiency reduces when the transmitted power increases.
Study of the power losses in the VSI
Fig. 7 presents the RMS current value in the switches of the primary VSI. The currents are similar on the secondary side.
Fig. 7. Comparison of the RMS currents in the switches for the primary VSI (Vin = 1.2 kV, k = 1).
It can be seen that the currents are approximately the same for all the configurations. However, for low power (< 60 kW), the higher magnetizing current and higher core losses cause a small increase in the switches current for the ΔΔ vector group. However, the corresponding effect on the conduction losses of the switches is not significant enough to explain the difference in the efficiency.
Regarding the switching losses, a previous study [14] has shown that the soft switching operation depends on the parameters and the configuration of the circuit (leakage inductance, current, voltage). For some conditions, proper soft switching operation might not be obtained, resulting in higher
0 5 10 15 20 25 30 35 40 45 50 0 20 40 60 80 100 C ur ren t ( A ) Power (kW) T1 Yy T1 ΔΔ T2 Yy
switching losses. In [14], three cases have been identified as shown in Fig. 8, for the case of our prototype:
1. Case 1: Spontaneous turn-on failure. In this case, the energy stored in the leakage inductance is not important enough to fully discharge the Drain-Source Capacitance (Cds) of the MOSFETs
2. Case 2: Dead time too long. In this case, the energy stored in the leakage inductance is sufficient to discharge the Cds capacitance but because of the freewheeling sequence and the voltage applied by
the secondary inverter, the current in the MOSFET cancels before the MOSFET turns-off.
3. Case 3: Soft switching operation. In this case the spontaneous commutation is obtained allowing the reduction of the switching losses.
Fig. 8. Switching waveforms for the three cases with the ΔΔ vector group (Vin = 1.2 kV, k = 1). The measured soft switching operating ranges obtained with all the configurations are summarized in Table 3.
Table 3. Soft switching operating range for all configurations (dead time = 500 ns,
Vin = 1.2 kV, k = 1)
T1 ΔΔ T1 Yy T2 Yy
Leakage inductance (µH) 11.3 34 15.8
Case 1: Spontaneous turn-on failure 0 → 28 kW 0 → 25 kW 0 → 40 kW
Case 2: Dead time too long 0 → 55 kW N.A. N.A.
Case 3: Soft switching operation 55→ 100 kW 25 → 100 kW 40 → 100 kW As it can be seen, the Yy vector group allows the soft switching operation at lower power.
Fig. 9 depicts the equivalent scheme seen from the inverter’s leg on the primary side for the two vector groups before the turn-off of the upper switch. The operation is similar for the other switches.
Fig. 9. Equivalent scheme of the primary inverter before the turn-off of Qa (phase A) for the two vector groups
As it can be seen, the configuration, voltage and current before the turn-off are different. This explains the differences in the soft switching operating range. Moreover, simplified simulations have confirmed the experimental observations. A complete study, out of the scope of this paper, is nevertheless required
(a) Case 1 (28 kW) (b) Case 2 (55 kW) (c) Case 3 (100 kW) Ids Vds Ids Vds Ids Vds in V in kV in kV 0 I I 0 Qa Qb
(a) Yy vector group (b) ΔΔ vector group 3 2Vin k 3 in kV 3 in kV y I 2 y I y I in V Qa Qb
to give more details. However, it clearly appears that the Yy vector group is more favorable to the ZVS operation because of the following reasons:
1. Higher leakage inductance with a higher current in the windings, allowing to get more energy stored in the leakage inductance.
2. Lower voltage applied by the VSI which causes a lower 𝑑𝑖/𝑑𝑡 after the spontaneous commutation of the diodes and a shorter switching duration [14].
Summary
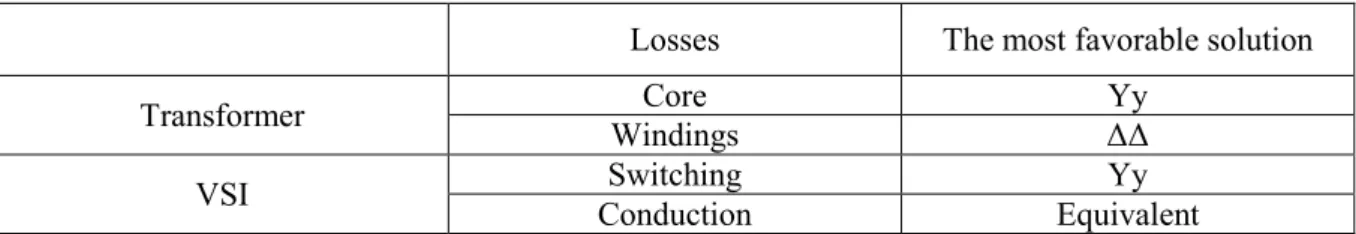
Thanks to the measurement performed and presented in this paper, Table 4 summarizes the observations made in this paper.
Table 4. General comparison of the different vector groups with a single MFT design
Losses The most favorable solution
Transformer Core Yy
Windings ΔΔ
VSI Switching Yy
Conduction Equivalent
Because of the high switching frequency of the prototype, switching losses have the biggest impact on the efficiency of the converter. It explains why Yy vector group shows the best efficiency.
Conclusion
The three-phase Dual Active Bridge is a promising topology when galvanic insulation and bidirectional power flow are required. Among all the degrees of freedom available for the design of the converter, the transformer vector group can be used to optimize the converter. At first glance, Yy and ΔΔ vector groups can be expected to show similar performance. However, technical aspects experimentally differentiated the two solutions and the Yy configuration showed the best performance.
References
[1] T. Lagier, L. Chédot, F. W. L. Ghossein, B. Lefebvre, P. Dworakowski, M. Mermet-Guyennet, and C. Buttay, “A 100 kW 1.2 kV 20 kHz DC-DC converter prototype based on the Dual Active Bridge topology,” in 2018 IEEE International Conference on Industrial Technology (ICIT), 2018, pp. 559–564.
[2] R. W. A. A. D. Doncker, D. M. Divan, and M. H. Kheraluwala, “A three-phase soft-switched high-power-density DC/DC converter for high-power applications,” IEEE Transactions on
Industry Applications, vol. 27, no. 1, pp. 63–73, Jan. 1991.
[3] N. Soltau, H. Stagge, R. W. D. Doncker, and O. Apeldoorn, “Development and demonstration of a medium-voltage high-power DC-DC converter for DC distribution systems,” in 2014 IEEE 5th
International Symposium on Power Electronics for Distributed Generation Systems (PEDG),
2014, pp. 1–8.
[4] Y. Lee, G. Vakil, A. J. Watson, and P. W. Wheeler, “Geometry optimization and characterization of three-phase medium frequency transformer for 10kVA Isolated DC-DC converter,” in 2017
IEEE Energy Conversion Congress and Exposition (ECCE), 2017, pp. 511–518.
[5] J. Xue, F. Wang, D. Boroyevich, and Z. Shen, “Single-phase vs. three-phase high density power transformers,” in 2010 IEEE Energy Conversion Congress and Exposition, 2010, pp. 4368–4375. [6] A. Garcia-Bediaga, I. Villar, A. Rujas, I. Etxeberria-Otadui, and A. Rufer, “Analytical Models of Multiphase Isolated Medium-Frequency DC–DC Converters,” IEEE Transactions on Power
Electronics, vol. 32, no. 4, pp. 2508–2520, 2017.
[7] P. Dworakowski, A. Wilk, M. Michna, B. Lefebvre, and T. Lagier, “3-phase medium frequency transformer for a 100kW 1.2kV 20kHz Dual Active Bridge converter,” in 2019 45th Annual
[8] P. Dworakowski, A. Wilk, M. Michna, B. Lefebvre, F. Sixdenier, and M. Mermet-Guyennet, “Effective Permeability of Multi Air Gap Ferrite Core 3-Phase Medium Frequency Transformer in Isolated DC-DC Converters,” Energies, 2020.
[9] C. P. Steinmetz, “On the Law of Hysteresis,” Transactions of the American Institute of Electrical
Engineers, vol. IX, no. 1, pp. 1–64, Jan. 1892.
[10] K. Venkatachalam, C. R. Sullivan, T. Abdallah, and H. Tacca, “Accurate prediction of ferrite core loss with nonsinusoidal waveforms using only Steinmetz parameters,” in 2002 IEEE Workshop
on Computers in Power Electronics, 2002. Proceedings., 2002, pp. 36–41.
[11] P. L. Dowell, “Effects of eddy currents in transformer windings,” Proceedings of the Institution
of Electrical Engineers, vol. 113, no. 8, pp. 1387–1394, Aug. 1966.
[12] F. Tourkhani and P. Viarouge, “Accurate analytical model of winding losses in round Litz wire windings,” IEEE Transactions on Magnetics, vol. 37, no. 1, pp. 538–543, Jan. 2001.
[13] Ferroxcube, “Design of planar power transformers, application note," http://ferroxcube.home.pl/appl/info/plandesi.pdf.” .
[14] T. Lagier and P. Ladoux, “Theoretical and experimental analysis of the soft switching process for SiC MOSFETs based Dual Active Bridge converters,” in 2018 International Symposium on


![Table 2. Ferrite 3C90 Steinmetz coefficients [13]](https://thumb-eu.123doks.com/thumbv2/123doknet/14400300.509879/7.892.270.773.176.498/table-ferrite-c-steinmetz-coefficients.webp)