HAL Id: hal-02818801
https://hal.inrae.fr/hal-02818801
Submitted on 6 Jun 2020
HAL is a multi-disciplinary open access archive for the deposit and dissemination of sci-entific research documents, whether they are pub-lished or not. The documents may come from teaching and research institutions in France or abroad, or from public or private research centers.
L’archive ouverte pluridisciplinaire HAL, est destinée au dépôt et à la diffusion de documents scientifiques de niveau recherche, publiés ou non, émanant des établissements d’enseignement et de recherche français ou étrangers, des laboratoires publics ou privés.
PART II National Focal Centre Reports : France
Anne Probst, Sophie Leguédois
To cite this version:
Anne Probst, Sophie Leguédois. PART II National Focal Centre Reports : France. 2008. �hal-02818801�
CCE S����� R����� 2008
-80
-60
0
60
80
C������� L���,
D������ M�������� ���
I����� A���������
�� E�����
Critical Load, Dynamic Modelling and
Impact Assessment in Europe
Critical Load, Dynamic Modelling and
Impact Assessment in Europe
CCE Status Report 2008
wge
of theWorking Group on Effects
Convention on Long-range Transboundary Air Pollution
Convention on Long‐range Transboundary Air Pollution
Critical load, dynamic modelling and impact assessment in Europe CCE Status Report 2008
4
Critical Load, Dynamic Modelling and Impact Assessment in Europe
CCE Status Report 2008 Report 500090003 J‐P. Hettelingh, M. Posch, J. Slootweg (eds.) Contact karin.vandoremalen@pbl.nl ISBN: 978‐90‐6960‐211‐0 This research has been performed by order and for the account of the Directorate for Climate Change and Industry of the Dutch Ministry of Housing, Spatial Planning and the Environment within the framework of PBL project M/500090, ‘Coordination Centre for Effects (CCE)’; for the account of the European Commission LIFE III Programme within the framework of PBL project E/555065 ‘Euro‐ pean Consortium for Modelling Air Pollution and Climate Strategies (EC4MACS)’ and for the account of (the Working Group on Effects within) the trust fund for the partial funding of effect‐oriented activities under the Convention on Long‐range Transboundary Air Pollution. © CCE 2008 Parts of this publication may be reproduced provided that reference is made to the source. A comprehensive reference to the report reads as ‘Hettelingh JP, Posch M, Slootweg J (eds.) (2008) Critical load, dynamic modelling and impact assessment in Europe: CCE Status Report 2008, Coordination Centre for Effects, Netherlands Environmental Assessment Agency, www.pbl.nl/cce (www.mnp.nl/cce until 2009).
France
133
France
National Focal Centre
Dr Anne Probst — Dr Sophie Leguédois
ÉcoLab (UMR 5245 CNRS/UPS/INPT) Campus ENSAT-INP Av. de l’Agrobiopole Auzeville-Tolosane BP 32607 F-31 326 Castanet-Tolosan cedex Email: anne.probst@ensat.fr Email: sophie.leguedois@ensat.fr
Collaborating institutions
Dr Laurence Galsomiès — Dr Christian Elichegaray
ADEME
Centre de Paris - Vanves
Dép. Surveillance de la Qualité de l’Air 27, rue Louis Vicat
F-75 737 Paris cedex 15
Dr Jean-Paul Party
Sol-Conseil
251 rte La Wantzenau - Robertsau F-67 000 Strasbourg
Dr. Étienne Dambrine
INRA-Centre de Nancy
Biogéochimie des Écosystèmes Forestiers F-54 280 Champenoux
Dr Erwin Ulrich — Dr Luc Croisé
Office National des Forêts Direction Technique Dép. Recherche et Développement RÉNÉCOFOR Boulevard de Constance F-77 300 Fontainebleau Dr Louis-Michel Nageleisen
Ministère de l’Agriculture et de la Pêche Dép. de la Santé des Forêts
Cenre INRA de Nancy F-54 280 Champenoux
Dr Anne-Christine Le Gall
Direction des Risques Chroniques Unité MECO
INERIS BP N°2
F-60 550 Verneuil-en-Halatte
Mr Marc Rico
Ministère de l’Écologie, de l’Énergie, du Dével-oppement Durable et de l’Aménagement du Territoire
Direction de la Pollution et de la Prévention des Risques
20, avenue de Ségur F-75 007 Paris
Critical load, dynamic modelling and impact assessment in Europe CCE Status Report 2008
134
Modelled critical loads and dynamic modelling data
The objectives of this call for data were to submit updated critical loads and to provide time series of modelled chemical variables for different deposition scenarios, i.e. dynamic modelling results. In 2005, the French National Focal Centre (NFC) provided updated critical load values for nitrogen (acid and nutrient) and sulphur as well as dynamic modelling results (Probst et al., 2005). In 2007, the French NFC: (1) tested the updated critical concentrations for the calculation of critical loads of nutri-ent nitrogen proposed by the Coordination Cnutri-entre for Effects (CCE) and, (2) snutri-ent data for dynamic modelling (Probst and Leguédois, 2007). In comparison with 2005, the only major change was the removal of costal ecosystems (EUNIS code B1.4) from the dynamic modelling database as, for those ecosystems, the empirical critical loads were more consistent with observations (Probst et al., 2005). For the 2008 call, the main differences concerned the structure of the database used for submission and the application of more conservative rules for the calibration of the dynamic model. To convert the 2007 data into the 2008 database structure we used the append queries provided by the CCE with VSD-Access version.
With the new calibration rules we had to change the values of the weathering rates (Cawe, Mgwe,
Kwe and Nawe) and the base saturation (bsat) for calcareous soils in order to enable the dynamic
model to calibrate. For these highly weatherable soils (weathering rates for base cations > 2,500 eq. ha-1.a-1), we had to increase the base saturation values to 0.9 and 0.99 for sites with weathering rates at 2,500 and 7,500 eq.ha-1.a-1 respectively. These adjustments were not sufficient for all the calcare-ous sites, so we also decreased the weathering rate down to 2,500 eq.ha-1.a-1. As we had no detailed information about the new calibration rules it was difficult to follow strict guideline for these number changes.
The 2008 results for dynamic modelling were significantly different from the 2007 results (Wilcoxon rank test performed on all the modelled variables cAl, cBc, pH, ANC, bsat, CNrat and cN, n = 244,290 and p < 3 %). Because of the way VSD-Access is built, it was not possible to assess the specific effect, on one side, of the value changes for base saturation and weathering rates, and, on the other side, of the modification of the deposition scenarios. However these changes shouldn’t affect the target loads results as the concerned soils have a high buffering capacity.
Calculation method
The data were computed following the method used in 2005 by the French NFC (Probst et al., 2005) which is in accordance with the Mapping Manual (UBA, 2004). For steady state critical loads, the Simple Mass Balance (SMB) model (Sverdrup and de Vries, 1994) was applied on the soil top-layer (0−20 cm). VSD (Posch et al., 2003) was used for dynamic modelling. For soils with high buffering capacity, the results obtained with VSD show significant differences with more complex models (Probst et al., 2003; Probst et al., 2005). However VSD allows better consistency for impact assess-ment at large scale like across the European territory (Probst et al., 2005).
France
135
Data sources
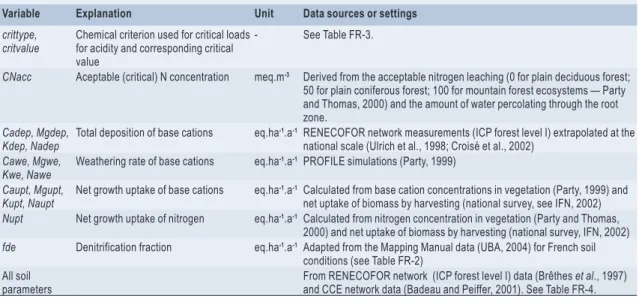
Table FR-1: Sources for the parameters used in the critical load and dynamic modelling.
Variable Explanation Unit Data sources or settings crittype,
critvalue Chemical criterion used for critical loads for acidity and corresponding critical value
- See Table FR-3.
CNacc Aceptable (critical) N concentration meq.m-3 Derived from the acceptable nitrogen leaching (0 for plain deciduous forest;
50 for plain coniferous forest; 100 for mountain forest ecosystems — Party and Thomas, 2000) and the amount of water percolating through the root zone.
Cadep, Mgdep,
Kdep, Nadep Total deposition of base cations eq.ha
-1.a-1 RENECOFOR network measurements (ICP forest level I) extrapolated at the
national scale (Ulrich et al., 1998; Croisé et al., 2002)
Cawe, Mgwe,
Kwe, Nawe Weathering rate of base cations eq.ha
-1.a-1 PROFILE simulations (Party, 1999) Caupt, Mgupt,
Kupt, Naupt Net growth uptake of base cations eq.ha
-1.a-1 Calculated from base cation concentrations in vegetation (Party, 1999) and
net uptake of biomass by harvesting (national survey, see IFN, 2002)
Nupt Net growth uptake of nitrogen eq.ha-1.a-1 Calculated from nitrogen concentration in vegetation (Party and Thomas,
2000) and net uptake of biomass by harvesting (national survey, IFN, 2002)
fde Denitrification fraction eq.ha-1.a-1 Adapted from the Mapping Manual data (UBA, 2004) for French soil
conditions (see Table FR-2) All soil
parameters From RENECOFOR network (ICP forest level I) data (Brêthes et al., 1997) and CCE network data (Badeau and Peiffer, 2001). See Table FR-4.
Table FR-2: Setting of the values for the denitrification fraction (adapted from UBA, 2004).
Soil type fde
Non hydromorphic soil 0.05 to 0.2 Hydromorphic silt or sandy soil 0.3 Hydromorphic clay 0.4 Peat soil and marshes 0.5
Table FR-3: Values for the chemical criterion and the critical limit used in the calculation of the critical loads for acidity.
Soil and bedrock type Chemical criterion crittype critvalue
Soft calcareous sediments Molar [Al]/[BC] 1 1,2 Hard calcareous sediments Molar [Al]/[BC] 1 1,2 Soft acid sediments
Sands pH 4 4,6
Sandy silex formations pH 4 4,6
Others Molar [Al]/[BC] 1 1,2
Hard acid sediments
Schists pH 4 4,6
Sandstones pH 4 4,6
Others Molar [Al]/[BC] 1 1,2
Metamorphic rocks
Acid granite pH 4 4,6
Others Molar [Al]/[BC] 1 1,2
Critical load, dynamic modelling and impact assessment in Europe CCE Status Report 2008
136
Table FR-4: Value of the soil parameters (from Brêthes et al., 1997).
Variable Explanation Units Min Max Median
bulkdens Bulk density g.cm-3 0.732 1.400 0.915 cOrgacids Total concentration of organic acids eq.m-3 0 0.02436 3.48 × 10⁻⁵ CEC Cation exchange capacity meq.kg-1 15 380 140 bsat Base saturation - 0.12 0.99 0.90
Cpool Amount of carbon in the topsoil g.m-2 3920 13 800 9 878 CNrat C/N ratio on the topsoil g.g-1 12 28 15
The total concentration of organic acids in soil solution is calculated from DOC (Dissolved Organic Carbon) which is estimated from pH and clay content in soil layer. Due to the lack of data on partial CO2-pressure in soil solution (pCO2fac), only one value (5 at) was considered for the topsoil.
Results
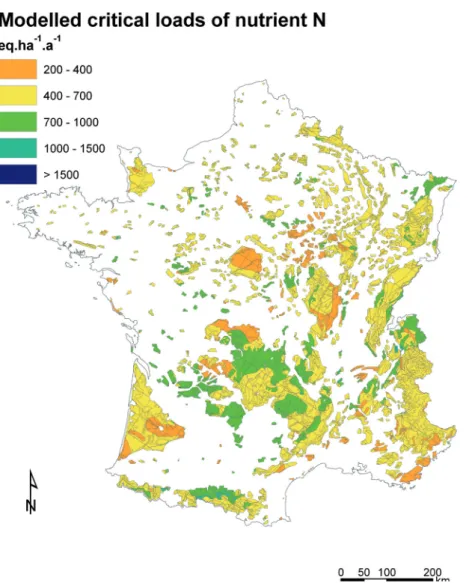
Critical loads of nutrient nitrogen
The most sensitive areas for nitrogen eutrophication are located in Sologne (Centre part of France) and the Landes (SW), the northern part of Massif Central and the eastern Mediterranean area (Figure FR-1).
France
137
The critical loads of nutrient nitrogen show a global sensitivity of the French ecosystems. The lowest critical load values (< 400 eq.ha-1.a-1 or < 5.6 kgN.ha-1.a-1) represent 22,185 km² (12.5 % of the studied area). Critical load values < 700 eq.ha-1.a-1 (< 9.8 kgN.ha-1.a-1) represent 140,375 km² (79.2% of the studied area, i.e. forests and natural grasslands).
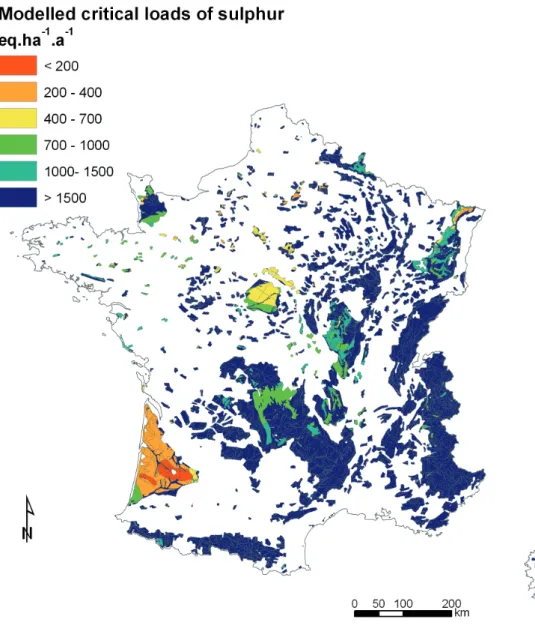
Critical loads of sulphur
Critical loads of sulphur were updated in 2005 (Figure FR-2) with a new computation of cations throughfall deposition, taking into account the cycle between biomass uptake and redeposition. Globally, the French ecosystems are not very sensitive to acidification by sulphur. The most sensi-tive areas are the Landes (SW), Sologne, some parts of the Massif Central as well as the Vosges mountains.
Critical load, dynamic modelling and impact assessment in Europe CCE Status Report 2008
138
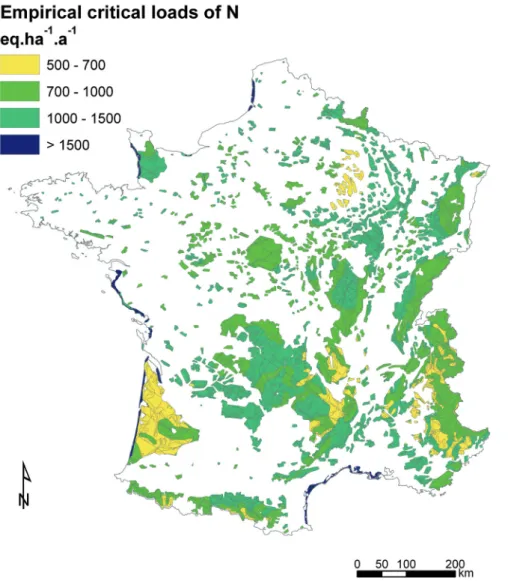
Empirical critical loads of nutrient nitrogen
Method
The determination of empirical critical loads of nitrogen for French ecosystems was based on the method described in chapter 5.2 of the Mapping Manual (UBA, 2004). The values given in table 5.1 of the Mapping Manual (UBA, 2004) were adapted to the French terrestrial ecosystems (Party et al., 2001). The adaptation was based on: (1) the information available on the potential vegetation and the land use for each ecosystem and, (2) the adaptation rules given in table 5.2 of UBA (2004) using temperature, frost period and base cation availability estimated by expert judgement. The subse-quent empirical critical loads are given in Table FR-5.
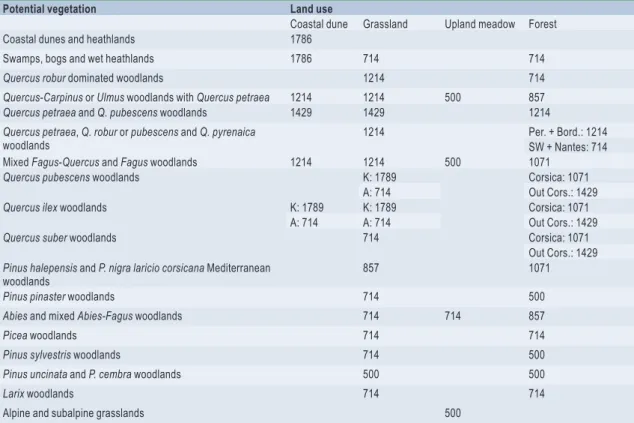
Table FR-5: Empirical critical loads, in eq.ha-1.a-1, derived for the French ecosystems (adapted from Party et al., 2001).
Potential vegetation Land use
Coastal dune Grassland Upland meadow Forest Coastal dunes and heathlands 1786
Swamps, bogs and wet heathlands 1786 714 714
Quercus robur dominated woodlands 1214 714
Quercus-Carpinus or Ulmus woodlands with Quercus petraea 1214 1214 500 857
Quercus petraea and Q. pubescens woodlands 1429 1429 1214
Quercus petraea, Q. robur or pubescens and Q. pyrenaica
woodlands 1214 Per. + Bord.: 1214SW + Nantes: 714 Mixed Fagus-Quercus and Fagus woodlands 1214 1214 500 1071
Quercus pubescens woodlands K: 1789 Corsica: 1071
A: 714 Out Cors.: 1429
Quercus ilex woodlands K: 1789 K: 1789 Corsica: 1071
A: 714 A: 714 Out Cors.: 1429
Quercus suber woodlands 714 Corsica: 1071
Out Cors.: 1429
Pinus halepensis and P. nigra laricio corsicana Mediterranean
woodlands 857 1071
Pinus pinaster woodlands 714 500
Abies and mixed Abies-Fagus woodlands 714 714 857
Picea woodlands 714 714
Pinus sylvestris woodlands 714 500
Pinus uncinata and P. cembra woodlands 500 500
Larix woodlands 714 714
Alpine and subalpine grasslands 500
K: calcareous ecosystem; A: acidic ecosystem;Out Cors.: outside Corsica; Per.+Bord.: Perigord and Bordeaux regions;SW+Nantes: South-West and Nantes regions.
Data Sources
The French ecosystem classification and map was updated in 2003 for calculation and mapping of the critical loads of acidity and nutrient nitrogen (Probst et al., 2003 ; Moncoulon et al., 2004). The map of potential vegetation was synthesised for the French territory by Party (1999) from various vegeta-tion maps (Dupias and Rey, 1985; Houzard, 1986; Ozenda and Lucas, 1987). Land use was derived from the map of forested and grassland areas in de Monza (1989) as well as the Digital Elevation Model GTOPO30 (USGS, 1996).
France
139
Results
The most sensitive areas to nitrogen deposition are located in the Landes (SW), the eastern part of the Paris basin, the eastern part of the Massif Central as well as in the Alps (Figure FR-3). Empiri-cal critiEmpiri-cal loads of nitrogen are higher than critiEmpiri-cal loads for nutrient nitrogen determined with the Steady State Mass Balance (SMB) model (see Figure FR-1 as well as Party and Thomas, 2000). Conse-quently, the sensitivity of the ecosystems is lower when derived from the empirical method. Compar-atively to the SMB model, most of the ecosystems shifted to a higher critical load class with the empirical method (+ 1 class for 49 % of the ecosystems and + 2 classes for 35 % of the ecosystems).
Critical load, dynamic modelling and impact assessment in Europe CCE Status Report 2008
140
References
Badeau V., Peiffer M. (2001) Base des données écologiques des placettes françaises du Réseau Européen de suivi des dommages forestiers (réseau 16 × 1 km). Premier inventaire : juillet 1993 – Octobre 1994 Deuxième inventaire : mai à août 1999. Département Santé des Forêts Antenne Spécialisée. 17p. Brêthes A., Ulrich E. (1998) RENECOFOR : Caractéristiques pédologiques des 102 peuplements du
réseau. Office National des Forêts, Département des Recherches Techniques, 573 p.
Croisé L., Ulrich E., Duplat P., Jaquet O. (2005) Two independant methods for mapping bulk deposi-tion in France. Atmospheric Environment, 39:3923−3941.
Dupias G. et Rey P. (1985) Document pour un zonage des régions phyto-écologiques. CNRS, Centre d’écologie des ressources renouvelables. Toulouse. 39 p. + maps.
Houzard G. 1989. Les forêts primitives de France. In de Monza J.-P. (éd.), Le grand atlas de la France rurale. INRA et SCEES, pp. 348−349.
Inventaire Forestier National (2002) Synthèse par département. http://www.ifn.fr/pages/index-fr.html. Moncoulon D., Probst A., Party J.-P. (2004) Critical loads of acidity : importance of weathering,
atmospheric deposition and vegetation uptake for ecosystem sensitivity determination. C.R. Geoscience, 336 :1417−1426.
Monza (de) J.-P. (ed.). Le grand atlas de la France rurale. INRA et SCEES.
Ozenda P. and Lucas M.J.(1987) Esquisse d’une carte de la végétation potentielle de la France à 1/1 500 000. Documents de Cartographie Ecologique, XXX :49–80.
Party J.-P., 1999: Acidification des sols et des eaux de surface des écosystèmes forestiers français: facteurs, mécanismes et tendances. Taux d’altération sur petits bassins versants silicatés. Application au calcul des charges critiques d’acidité. Thèse de Doctorat, Université Louis Pasteur de Strasbourg. 233 p. Party J.-P., Probst A., Thomas A.-L., Dambrine É. (2001) Critical loads for nutrient nitrogen: calculations
and mapping by empirical method for France [in French]. Pollution Atmosphérique. 172:531–544. Party J.-P. and Thomas A.-L. (2000) Cartographie de la végétation et charges critiques azotées pour la
France. Rapport ADEME définitif (marché n°99 62 020).
Posch M., Reinds G.J. (2003) VSD — User manual of the Very Simple Dynamic soil acidification model. Coordination Centre for Effects, National Institute for Public Health and the Environment (RIVM), Bilthoven, The Netherlands.
Probst A., Moncoulon D., Party J.-.P. (2003) French National Focal Center report. In M. Posch, J.P. Hettelingh, J. Slootweg, R.J. Downing (eds), Modelling and Mapping of Critical Treshold in Europe, Status Report 2003, Coordination Center for Effects, RIVM, Bilthoven, pp. 73−80. Probst A., Moncoulon D., Party J.-.P. (2005) French National Focal Center report. In M. Posch, , J.
Slootweg, J.P. Hettelingh (eds), European Critical Loads and Dynamic MOdelling, Status Report 2005, Coordination Center for Effects, RIVM, Bilthoven, pp. 109−115.
Probst A., Leguédois S. (2007) France. In M. Posch, , J. Slootweg, J.P. Hettelingh (eds), European Critical Loads and Dynamic MOdelling, CCE Status Report 2007, Coordination Center for Effects, RIVM, Bilthoven, pp. 139−143.
Sverdrup H, de Vries W. (1994). Calculating critical loads for acidity with the simple mass balance method. Water, Air & Soil Pollution, 72:143–162.
UBA (2004) Manual on methodologies and criteria for modelling and mapping critical loads & levels and air pollution effects, risks and trends. Umweltbundesamt Texte 52/04, Berlin.
www.icpmapping.org
Ulrich E., Lanier M., Combes D. (1998) RENECOFOR — Dépôts atmosphériques, concentrations dans les brouillards et dans les solutions de sol (sous-réseau CATAENAT). Rapport scientifique sur les années 1993 à 1996. Office National des Forêts, Département des Recherches Techniques, ISBN 2-84207-134-4, 135p.