HAL Id: tel-02003629
https://tel.archives-ouvertes.fr/tel-02003629
Submitted on 1 Feb 2019HAL is a multi-disciplinary open access
archive for the deposit and dissemination of sci-entific research documents, whether they are pub-lished or not. The documents may come from teaching and research institutions in France or abroad, or from public or private research centers.
L’archive ouverte pluridisciplinaire HAL, est destinée au dépôt et à la diffusion de documents scientifiques de niveau recherche, publiés ou non, émanant des établissements d’enseignement et de recherche français ou étrangers, des laboratoires publics ou privés.
Lysosomal degradation of insulin granules promotes
β-cell failure in type 2 diabetes
Adrien Pasquier
To cite this version:
Adrien Pasquier. Lysosomal degradation of insulin granules promotes β-cell failure in type 2 diabetes. Endocrinology and metabolism. Université de Strasbourg, 2016. English. �NNT : 2016STRAJ083�. �tel-02003629�
UNIVERSITÉ DE STRASBOURG
ÉCOLE DOCTORALE DES SCIENCES DE LA VIE ET DE LA SANTÉ
IGBMC
THÈSE
présentée par :Adrien PASQUIER
soutenue le : 08 Novembre 2016
pour obtenir le grade de : Docteur de l’université de Strasbourg Discipline/ Spécialité
: Biologie moléculaire et cellulaire
Lysosomal degradation of insulin
granules promotes β-cell failure in type
2 diabetes
THÈSE dirigée par :
M. RICCI Romeo Professeur, Université de Strasbourg
RAPPORTEURS :
M. SAFTIG Paul Professeur, Université de Kiel, Allemagne
M. DONATH Marc Professeur, Université de Bâle, Suisse
AUTRE MEMBRE :
2
Acknowledgements
I first would like to thanks the committee members for accepting to review my thesis and coming to my defence.
I would like thanks Prof. Romeo Ricci, for giving me the opportunity to work in his team. Your support and patience were really valuable for me who came from a different background. I learn a lot in your lab, scientifically and humanly. I would like to emphasize the constant passion that drive both your work and hobbies, which is exemplary and contagious. Thanks a lot.
J’aimerais ensuite remercier Eric Erbs pour son aide précieuse, les très bons moments, et ses conseils avisés. Je n’oublierai pas le partage de nos points de vue sur des sujets plus ou moins scientifiques mais à chaque fois très importants.
My acknowledgements also go to Alexander Goginashvili who is now in San Diego. Thank you for setting up the project and always give positive and constructive inputs in the numerous skype discussion we had and will have on this project.
I would like to say a big 谢谢 to Zhirong Zhang for teaching me the new CRISPR/Cas9 technique which I am sure will be of great use in a near future. Your determination and kindness were great models for me.
J’aimerais aussi remercier les étudiants que j’ai pu encadrer, David Kaiser et surtout Victor Aubert sans qui le projet n’aurait pas pu aller aussi loin, bonne chance à Caen !
My thoughts also go to the people who formed me at the beginning, Joelle Morvan and Helmuth Gehart. I would also like to thanks all the member of the lab, Gergö for the great help with the mice and the football game, Yan Fan for the delicious tea and Olga for the tiramisu. Thank you also to the members of the Sumara lab.
A big thank to my former Italo-Canadian flat mate Marco Incarbone, who is definitely the alpha male (after Matumbo). Say hi to Marion!
Un grand merci à ma famille pour votre soutien et encouragements, ça a beaucoup compté dans les moments difficiles et les périodes de doutes. Moi + !
Infine, il mio pensiero va a Vale. Condividere la mia vita con te è la mia più grande fonte di felicità !
3
Table of contents
Acknowledgements ... 2 Table of contents ... 3 Figure list ... 6 Annexes list ... 7 Introduction ... 9I. Glucose sensing and homeostasis at the organismal level ... 10
A. Pancreatic islets and glucose homeostasis ... 11
B. The α-cells and glucagon... 12
1. Glucagon secretion: Molecular mechanisms ... 13
2. Glucagon signalling ... 13
C. The β-cells and insulin ... 15
1. Canonical Insulin secretion mechanisms ... 15
2. Potentiation of insulin secretion by incretins ... 15
3. Other mechanisms regulating insulin secretion ... 16
4. Neuronal control of insulin secretion ... 17
5. Insulin granule biogenesis ... 17
6. Insulin signalling pathway ... 18
II. Nutrient sensing and homeostasis at the cellular level ... 20
A. Lipid and glucose sensing ... 21
1. Lipid sensing ... 21
2. Glucose sensing ... 22
B. AMPK and energy sensing ... 23
1. AMPK activation ... 23
2. Effects of AMPK activation ... 24
C. mTORC1 and amino acid sensing. ... 27
1. mTORC1 activation ... 28
2. Effects of mTORC1 activation ... 30
D. ULK1 and macroautophagy ... 32
1. Macroautophagy molecular regulation ... 32
1. Autophagy in a disease context ... 35
E. Lysosomes as a regulatory hub for nutrient sensing ... 36
4
A. Lysosomal degradation of insulin granules in pancreatic β-cells ... 38
B. PKD functions in pancreatic β-cells ... 39
IV. T2DM and pancreatic β-cells ... 40
Aim of the project ... 42
Material and Methods ... 43
I. Materials ... 44
II. Methods ... 44
A. Mouse maintenance and experimentation ... 44
B. Molecular cloning and knock-in cell line generation ... 45
C. Cell lines and transfections ... 46
D. Isolation of pancreatic islets ... 47
E. Cell lysis ... 47 F. Western blot ... 47 G. qPCR analysis ... 47 H. Immunofluorescence ... 48 I. Histochemistery ... 48 J. Colocalisation analysis ... 49
K. Transmission electron microscopy (TEM) ... 49
L. α-cells isolation ... 50
M. Statistical analysis ... 50
Results ... 51
I. Targeting of insulin granules to CD63-positive compartments is increased in diabetic β-cells ... 52
A. Pancreatic β-cells from diabetic BTBR ob/ob mice contain numerous Granule-Containing Lysosomes (GCLs) ... 52
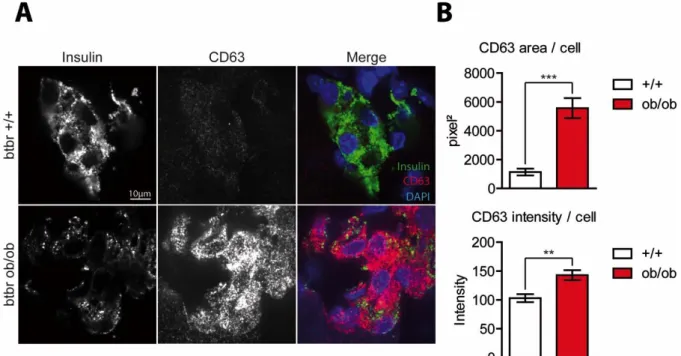
A. Dramatic changes in CD63 expression and localization in diabetic β-cells ... 54
B. Generation of a double knock-in INS1 cell line expressing CD63-DsRed and Phogrin-eGFP ... 57
C. Insulin granules are targeted to CD63 compartments in double knock-in INS1 cells in response to glucolipotoxicity stress ... 60
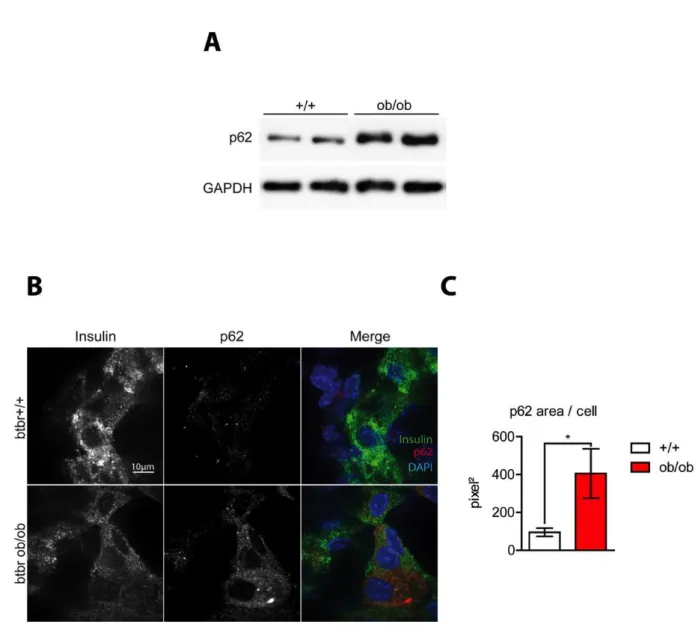
D. Diabetic conditions inhibit autophagic flux and autophagosome formation ... 61
E. Inhibition of lysosomal degradation and autophagy by BafA1 enhances co-localization of CD63 and phogrin ... 64
5 F. mTOR is recruited to CD63-positive compartments during glucolipotoxicity challenge
66
G. Knock-down of CD63 restores insulin granules in response to a glucolipotoxic stress 67
II. PKD inhibition contributes to β-cell failure in diabetes ... 67
A. PKD1 expression is reduced upon onset of diabetes ... 67
B. PKD1 inhibition increases co-localisation of CD63-positive compartments and insulin granules ... 69
C. CD63 knock-down partially rescues insulin content in PKD1 depleted INS1 cells .... 70
D. PKD inhibition in vivo leads to faster onset of diabetes in our murine model ... 71
III. PKD1 activation leads to restoration of the insulin content and improved glucose homeostasis in mice. ... 73
A. p38δ inhibition activates PKD ... 74
B. PKD activation in vivo delays onset of diabetes ... 74
C. PKD activation increases insulin granules levels in normal and diabetic human islets75 IV. LIMP2 is highly expressed in alpha-cells. ... 76
Discussion ... 79
References ... 89
Annexes ... 101
Résumé ... 121
6
Figure list
Figure 1 : Pancreatic islets are at the centre of glucose homeostasis in mammals. ... 12
Figure 2 : The interplay between pancreatic islets and other metabolic tissues. ... 19
Figure 3 : AMPK is pivotal in the regulation cellular metabolism. ... 27
Figure 4 : mTORC1 regulation at the lysosomal membrane... 29
Figure 5 : Molecular mechanisms governing macroautophagy.. ... 33
Figure 6: Proposed Mechanisms for Reciprocal Regulation of mTORC1 and AMPK at the Cytoplasmic Surface of the Lysosome. ... 37
Figure 7 : SINGD inhibits autophagy and is controlled by PKD. ... 39
Figure 8. Colocalisation analysis scheme using the Colocalisation Threshold plugin from Fiji. ... 49
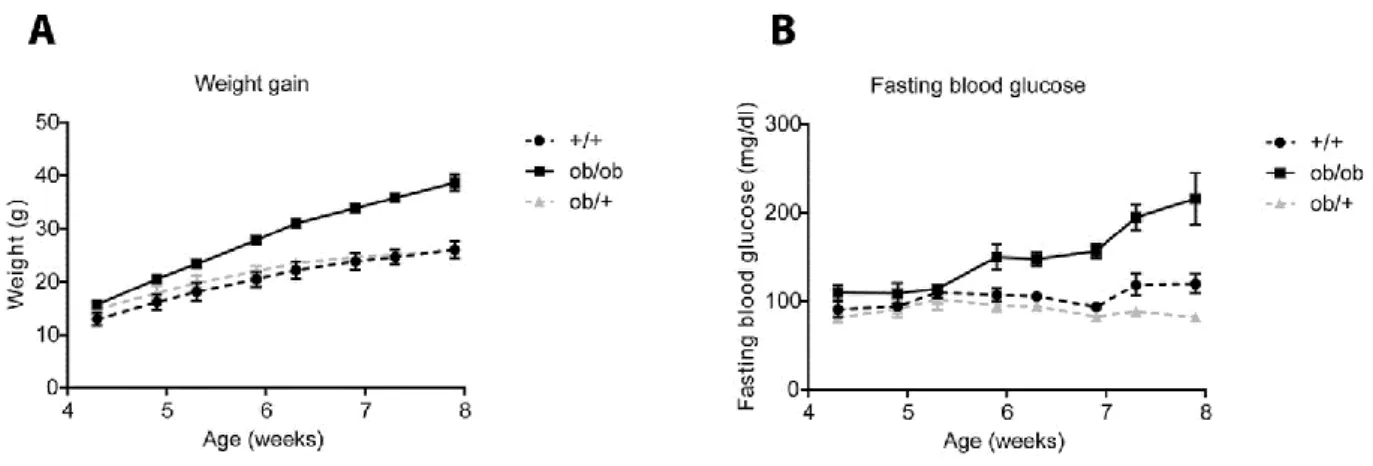
Figure 9. BTBR ob/ob mice become severely obese and diabetic 8 weeks after birth. ... 52
Figure 10. Increased numbers of GCLs in β-cells of diabetic mice. ... 53
Figure 11. Expression of LAMP1 is unchanged, while LAMP2 expression is slightly decreased in β-cells of diabetic islets . ... 55
Figure 12. CD63 staining is strongly enhanced in diabetic β-cells. ... 56
Figure 13. mRNA and protein levels of CD63 are enhanced in a diabetic context. ... 56
Figure 14. Increase in co-localisation between CD63 and insulin upon glucolipotoxic stress. 57 Figure 15. Generation of CD63-DsRed single knock-in INS1 cells. ... 58
Figure 16. Generation of CD63-DsRed/Phogrin-eGFP double knock-in INS1 cells. ... 59
Figure 17. Increase in colocalisation between CD63-Dsred and Phogrin-GFP upon glucolipotoxic stress. ... 61
Figure 18. Autophagic flux is decreased in diabetic β-cells. ... 62
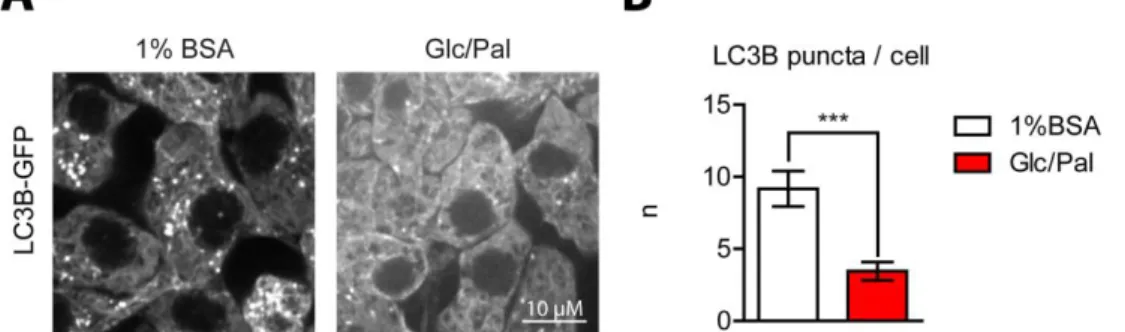
Figure 19 : LC3B-GFP dots decrease under glucolipotoxic conditions. ... 63
Figure 20. Autophagic flux is decreased in INS1 cells under glucolipotoxic conditions. ... 63
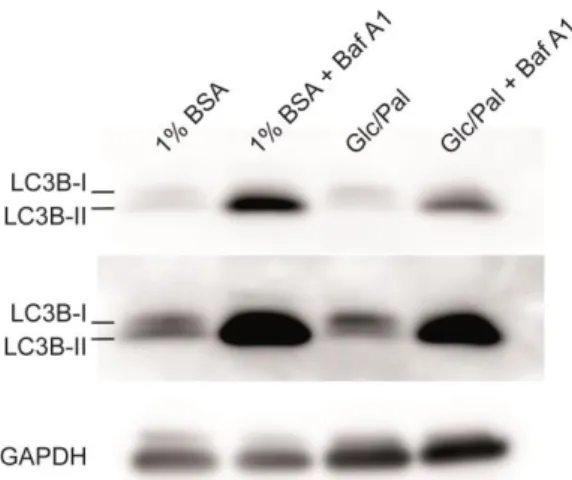
Figure 21 : Glucolipotoxic treatment decreases the levels of LC3B II. ... 64
Figure 22. Bafilomycin A1 treatment enhanced formation of CD63 and phogrin double positive structures. ... 65
Figure 23. mTOR is recruited to CD63-positive structures upon glucolipotoxic conditions. . 66
Figure 24. CD63 knock-down leads to restoration of insulin content under glucolipotoxic conditions. ... 68
7 Figure 26. PKD inhibition led to increased co-localisation between CD63-DsRed and
Phogrin-GFP. ... 70
Figure 27. Knock-down of CD63 restores abundance and localisation of insulin granules in PKD1-depleted cells. ... 71
Figure 28. In vivo inhibition of PKD led to acceleration of diabetes. ... 72
Figure 29. Inhibition of PKD in vivo led to increased GCL formation. ... 73
Figure 30. RA treatment activates PKD1 in human islets. ... 74
Figure 31. Inhibition of p38δ in vivo delayed diabetes development in BTBR ob/ob mice. ... 75
Figure 32. RA treatment increases insulin content in human islets from non-diabetic as well as diabetic donors. ... 76
Figure 33. LIMP2 is higly expressed in α-cells. ... 77
Figure 34. LIMP2 is highly expressed in insulin-negative cells in the periphery of murine islets. ... 77
Figure 35 : LIMP2 co-localises with glucagon in glucagon granules. ... 78
9
10 To properly function, every system needs energy or at least the possibility to extract it from a given source. For living organisms, nutrients represent the principal energy source. Nutrients are simple organic compounds which produce energy through biochemical reactions. The most common nutrients in our organism are glucose and related sugars, amino acids as well as lipids (Efeyan et al., 2015). As complete lack of nutrients would be detrimental, every species have developed mechanisms for nutrient sensing and storing to ensure sufficient nutrient availability during nutrient scarcity. During a period of abundant nutrients, they will be stored. Conversely, during a period of nutrient depletion, nutrient stocks can be mobilized. Unicellular organisms are directly exposed to nutrients from the extracellular environment. In multicellular organisms, blood circulation guarantees nutrient delivery to different organs/cells after food intake. Specialized organs/cells will provide energy for other cells that do not have the capacity to store and mobilize nutrients during fasting. This requires tight regulation and coordination at the organismal level. In humans, nutrient and energy homeostasis are regulated by hormonal cues that induce multiple signalling pathways in target cells. Dysregulation of these mechanisms are at the origin of metabolic disorders, which increasingly become a major health burden in the world-wide population. The mechanisms involved in nutrient sensing and storing at the organismal level in mammals will first be discussed in this chapter; the focus will then be shifted to cellular mechanisms governing nutrient sensing; the third chapter will cover nutrient sensing and responses in pancreatic β-cells and finally the fourth chapter will address how the latter mechanisms in β-cells may contribute to a predominant metabolic disease, type 2 diabetes (T2D).
I.
Glucose sensing and homeostasis at the organismal
level
In mammals, nutrients are extracted from the food along the gastrointestinal (GI) track. After being broken down into small molecules by digestive enzymes, nutrients cross the intestinal lining and reach the blood stream where they can be distributed among organs. To ensure proper functioning, the organism needs to maintain a steady delivery of nutrients to different organs also when they are not available. It is therefore important to stock newly absorbed nutrients during food ingestion for later use when food is scarce. Several organs such as adipose tissue,
11 muscle and liver, are capable of storing nutrients during feeding and of mobilizing them during fasting. Nutrients are delivered to organs through the blood stream allowing for sensing nutrients and the energy status at different levels. The regulatory network of energy homeostasis is comprised of several peripheral organs including the intestinal tract, the liver, the brain, the muscle, the bone, the adipose tissue as well as the pancreas. Among other nutrients such as fatty acids or vitamins, the regulation of glucose levels in mammals and humans is critical and has been extensively studied. Importantly, aberrant glycaemia is a hallmark of diabetes mellitus, a severe metabolic disorder leading to several life-threatening complications.
A.
Pancreatic islets and glucose homeostasis
The blood glucose level, also called glycaemia, needs to be kept at a constant level. In humans, optimal glycaemia, or euglycaemia, is comprised between 70mg/dL and 100mg/dL before a meal. Glycaemia higher than 100 mg/dL is called hyperglycaemia. Glycaemia under 70mg/dL is called hypoglycaemia. After food intake, the body is exposed to a hyperglycaemic phase and blood glucose needs to be decreased. Conversely, upon a long period of fasting the body experiences a hypoglycaemic phase and glycaemia needs to increase. Almost a century ago it has been demonstrated that pancreatectomy (removal of the pancreas) in dogs, resulted in severe hyperglycaemia and diabetes, suggesting that this organ is absolutely crucial to maintain normal glucose homeostasis.
The pancreas is composed of two parts, the exocrine pancreas, which represent ~98% of the organ and is responsible for the secretion of the digestive enzymes into the GI track. 1-2% of the organ is composed of the endocrine part consisting of pancreatic islets, also called islets of Langerhans (named after their discovery by Paul Langerhans), which secrete major regulating hormones into the blood stream. The pancreatic islets are composed of five different cell types secreting specific hormones: the α cells (15-20% of the islet cells) which secrete glucagon, the β-cells (~65-80% of the islet cells ) which co-secrete insulin, amylin and C-peptide, the γ cells (~3-5% of the islet cells) which secrete pancreatic polypeptide (PP), the δ cells (~3-10% of the islets cells) which secrete somatostatin and finally the ε cells (~<1% of the islet cells) which secrete ghrelin (Röder et al., 2016).
Glucose homeostasis is controlled by the two main hormones insulin and glucagon. Upon hyperglycaemia the pancreatic β-cells secrete insulin into the blood stream. Insulin stimulates glucose uptake into muscle and adipose tissue. At the same time, it induces the conversion from glucose into glycogen, a short-term energy storage product, in the liver by a process called
12 glycogenesis. Through these actions, insulin decreases blood glucose levels. On the other hand, hypoglycaemia induces the secretion of glucagon into the blood stream from pancreatic α-cells. Glucagon stimulates the breakdown of glycogen into glucose by a process called glycogenolysis and de novo synthesis of glucose from non-carbohydrate substrates by gluconeogenesis in the liver, allowing restoration of euglycaemia (Figure 1).
B.
The α-cells and glucagon
As mentioned above, the α-cell is the principal source of glucagon, a 29 amino acid peptide hormone, which is secreted at low concentrations under euglycemic conditions. Glucagon
Figure 1 : Pancreatic islets are at the centre of glucose homeostasis in mammals. In the
pancreatic islets, the β-cells (purple) secrete insulin in response to increased blood glucose levels (hyperglycaemia). Insulin secreted in the blood stream binds to the insulin receptor (InsR) on muscle cells, adipocytes and hepatocytes. Binding to its receptor triggers signalling pathways inducing cellular glucose uptake. In hepatocytes, insulin triggers storage of glucose in the form of glycogen through glycogenesis. Conversely, upon low blood glucose levels (hypoglycaemia) the α-cells (pink) secrete glucagon into the blood stream. Upon its binding to its receptor (GCGR) on hepatocytes, glucagon activates signalling pathways stimulating the breakdown of glycogen into glucose (glycogenolysis) and de novo synthesis of glucose through gluconeogenesis
13 secretion dramatically rises upon hypoglycaemia in order to restore glycaemia by triggering release of glucose from the liver (Campbell and Drucker, 2015). Glucagon is derived from a 160 amino acid pro-glucagon polypeptide encoded by the GCG gene. The polypeptide is then cleaved by the pro-hormone convertase 2 (PC2), which is preferentially expressed in α-cells, mainly into glucagon and into the Major proglucagon fragment (MPGF). Proglucagon is directly sorted into dense-core vesicles, indicating that cleavage occurs inside vesicles after leaving the Trans-Golgi-Network (TGN) (McGirr et al., 2013).
1.
Glucagon secretion: Molecular mechanisms
Secretion of glucagon is promoted via the action of voltage-dependent sodium (Na+) and
calcium (Ca2+) channels, which maintain action potentials during times of low glucose. Depolarization increases the Ca2+ influx and subsequent glucagon secretion,which is supported by the activity of ATP-sensitive potassium (KATP) channels. As glucose levels rise, secretion
of glucagon is inhibited through the elevation of cytosolic ATP, blockade of KATP channels and
termination of the Na+-induced and Ca2+-induced action potentials. This process inhibits Ca2+ influx and terminates glucagon secretion (Habegger et al., 2010).
Glucagon secretion is also regulated through paracrine signals. Insulin and somatostatin through binding on their respective receptors on the α-cell membrane strongly inhibit glucagon release. Glucagon secretion is also inhibited by Zn2+ ions and GABA that are co-secreted with insulin. Neuronal stimulation from both branches of the autonomic nervous systems can also regulate glucagon secretion. The parasympathetic innervation impacts on glucagon secretion upon fasting by stimulating the α-cells. The sympathetic system has been involved in regulation of both α- and β-cells. Noradrenaline can bind to the β2-adrenergic receptor on the α-cells and stimulate glucagon secretion while it inhibits insulin secretion by binding to the α2-adrenergic receptor on the β-cells, thus resulting in amplified glucagon secretion (Thorens, 2014)((Jiang and Zhang, 2003).
2.
Glucagon signalling
Upon its secretion in the blood stream, glucagon binds to its target cell through the Glucagon receptor (GCGR), a G-protein coupled receptor. GCGR is present on cells of most metabolic organs including liver, brain, adipose tissue and pancreatic islets.
Binding of glucagon elicits a conformational change of its receptor and subsequent activation of the G-proteins Gsα and Gq. Activation of Gsα leads to the activation of the adenyl cyclase, increase of cyclic AMP (cAMP) levels, and subsequent activation of protein kinase A (PKA).
14 On the other hand, activation of Gq leads to the activation of phospholipase C, generation of inositol 1,4,5-triphosphate, and subsequent release of intracellular calcium from the ER (Magliarelli 2014, thesis).
In hepatocytes, PKA signalling activates glycogen phosphorylase, which phosphorylates glycogen, increasing the breakdown of glycogen into G6P. Glucagon signalling also leads to the increase of G-6-Pase activity, which enhances conversion of G6P into glucose. Overall, glucagon signalling promotes glycogenolysis, the breakdown of glycogen into glucose (Jiang and Zhang, 2003). The opposite pathway of glycogenolysis, glycogenesis is inhibited by glucagon signalling through phosphorylation and inhibition of the glycogen synthase (GS) enzyme. In addition to glycogen catabolism, glucagon signalling reverses the metabolism of glucose, by inhibiting glycolysis and favouring the opposite pathway, gluconeogenesis. Activated PKA can phosphorylate the PFK2/FBPase-2 polypeptide at Serine 36 leading to inhibition of PFK2 and activation of FBPase-2. This in turn reduces intracellular levels of F(2,6)P2, thereby relieving the inhibition of FBPase-1 and promoting gluconeogenesis. By reducing the levels of F(2,6)P2, the activity of PFK1 is also reduced decreasing glycolysis. The activation of PKA also results in phosphorylation and nuclear localization of cAMP Response Element Binding protein (CREB). Once phosphorylated in the liver, CREB binds to the cAMP response elements of target genes, resulting in recruitment of coactivators, such as hepatic nuclear factor 4α (HNF-4α), peroxisome proliferator-activated receptor γ coactivator 1-α (PGC-1α) and the glucocorticoid receptor to induce transcription of gluconeogenic genes such as Phosphoenolpyruvate carboxykinase (PEPCK). In addition to this well-described pathway, glucagon has also been implicated in signalling via 5'-AMP-activated protein kinase (AMPK) and mitogen-activated protein kinase (MAPK)-dependent manner (Habegger et al., 2010). In addition to its canonical role in glucose homeostasis, Glucagon has been shown to regulate lipid homeostasis by regulating triacylglycerol (TAG) levels in the liver as well as cholesterol and lipolysis in white adipose tissue. It is also involved in thermogenesis in the brown adipose tissue. Finally the GCGR is highly expressed in the Central Nervous System, and Glucagon signalling has been reported to play an important role in food intake behaviour (Habegger et al., 2010).
The opposite hormone of glucagon is insulin, which is secreted by the neighbouring β-cells in the pancreatic islets. In comparison to α-cells, the β-cells have been a lot more studied and more information related to their function are available.
15
C.
The β-cells and insulin
Except for a small production in the neurogliaform cells in the brain (Molnár et al., 2014), the pancreatic β-cells are the major source of insulin in mammals. Because of its important hypoglycaemic effect, insulin needs to be secreted at the right moment and at the right dose, which necessitates intricate mechanisms.
1.
Canonical Insulin secretion mechanisms
Insulin is secreted outside the β-cells and into the blood stream upon a raise in the glycaemia. Upon acute post-prandial hyperglycaemia, glucose enters β-cells through the bidirectional Glucose Transporter 2 (GLUT2) and is phosphorylated by the glucokinase (GK) trapping it inside the cell. Phosphorylated glucose then enters the glycolytic pathway, which modifies it into pyruvate which is then transported to mitochondria. Pyruvate is then metabolized into acetyl-CoA that enters the TCA cycle. ATP is directly generated during glycolysis and the TCA cycle. Furthermore, NADH and NADH/FADH2 produced during glycolysis and the TCA cycle, respectively are used to produce ATP through the electron transport chain. ATP production decreases the ADP/ATP and AMP/ATP ratios. This closes the ATP-sensitive K+ channel, trapping K+ inside the β-cell resulting in depolarization and subsequent opening of the voltage-dependent Ca2+ channel VDCC. This provokes Ca2+ entry, which promotes insulin granule fusion with the plasma membrane and release of its content to the blood stream or in the extracellular space within the islet where it can fulfil paracrine or autocrine actions. However, the current view in the field is that this canonical pathway acts in concert with numerous secondary pathways which are triggered by metabolic coupling factors (MCFs). Nutrients processed in metabolic pathways produce co-products that are used as signalling cues to trigger auxiliary pathways. The MCFs can be categorised into two groups: the effectory MCFs (EMCFs) which are responsible for the initiation of insulin secretion or the regulatory MCFs (RMCFs) which only modulate insulin secretion. Those MCFs have been extensively reviewed in Prentki et al., 2013.
2.
Potentiation of insulin secretion by incretins
Insulin release is fine-tuned and potentiated by signals emerging from other nutrient sensing tissues. For example, incretins released from the gut have gained a lot of attention. The gut is the first organ to be in contact with nutrients upon food absorption and digestion. Despite this fact, it was long considered as an organ exerting digestion of food only (Badman and Flier,
16 2005). However, enteroendocrine cells residing in the gut can secrete hormones to the blood stream that are important in energy homeostasis. The L cells residing mainly in the ileum and colon secrete glucagon like peptide 1 (GLP1), one of the two members of the incretin family. This hormone, derived from the pre-pro-glucagon polypeptide through cleavage by the PC1 enzyme, is secreted in response to nutrients such as free fatty acid (FFA) or carbohydrates. Among other important functions, GLP-1 stimulates secretion of insulin from pancreatic islets while inhibiting secretion of glucagon by binding to its GPCR receptor (GLP1R). GLP1 levels are tightly controlled through its fast degradation by the dipeptyl peptidase IV (DPP4) resulting in half-life of only two minutes in the blood circulation.
Glucose-dependent insulinotropic polypeptide (GIP), the second member of the incretin family, is like GLP1 rapidly inactivated by DPP4 (half-life is 4-5min). GIP is secreted by the K cells in response to an increase in glucose and fat in the guts and strongly promotes insulin secretion from the pancreatic islets by binding to GIPR.
GLP-1 and GIP can enhance insulin secretion in a glucose stimulation-dependent manner by binding to their respective receptors present on the β-cells surface. The GLP1R and GIPR are GPCR receptors. Receptor binding of their specific agonist leads to the activation of the adenylyl cyclase protein (AC) and production of cyclic AMP (cAMP) (and pyrophosphate) which activates protein kinase A (PKA) upon low cAMP increase, or the exchange protein directly activated by cAMP (EPAC) upon high cAMP increase. Activation of PKA leads to closure of KATP and facilitation of membrane depolarization. PKA also leads to inhibition of
the delayed rectifying Kv channel, a negative regulator of insulin secretion, resulting in
prolongation of action potentials (Yabe and Seino, 2011). PKA and EPAC also promote mobilization of intracellular Ca2+ stocks from the Endoplasmic Reticulum (ER), which
increases the fusion of the insulin granule with the plasma membrane. Increased Ca2+ levels also induce transcription of the insulin gene (Seino et al., 2010)(Yabe and Seino, 2011). Finally the prototypical cholecystokinin hormone (CCK), secreted inside the gut lumen by the I cells from the duodenum and jejunum, can also promote the secretion of insulin (Badman and Flier, 2005).
3.
Other mechanisms regulating insulin secretion
Paracrine signalling also affects release of insulin from β-cells. Upon binding to its receptor SSTR2 on the β-cell membrane, somatostatin secreted by the δ-cells attenuates insulin secretion.
17 Adiponectin, an adipokine secreted by the adipose tissue, increases insulin secretion (Röder et al., 2016). Leptin, the other prominent adipokine, has been shown to regulate insulin level but rather indirectly through action in the Central Nervous System (CNS) by activating the proopiomelanocortin (POMC) and inhibiting the Agouti related protein and the Neuropeptide Y (AgR/NPY) neurons (Begg and Woods, 2013). Finally the adipokine/myokine Interleukine 6 (IL-6) was shown to enhance GLP-1 secretion, indirectly increasing insulin secretion from the β-cells (Röder et al., 2016).
4.
Neuronal control of insulin secretion
Insulin release is also amplified by neuronal signals coming from the brain. However, these signals are rather secondary and sustain insulin secretion triggered by glucose, as glucose sensing by the brain is delayed in comparison to the peripheral organs. Pancreatic islets, including both β- and α-cells, are highly innervated by both branches of the autonomic nervous system: the sympathetic and parasympathetic nervous system. The parasympathetic innervation allows for local release of acetylcholine, which binds to the muscarinic receptor m3AchR present on the surface of the β-cells and is involved in the potentiation of insulin secretion. The parasympathetic nervous system is also involved in the cephalic phase of insulin release (CIPR), which is triggered by the gustatory machinery on the tongue and prepare the body for glucose increase subsequent to food intake (Just et al., 2008). Moreover, the parasympathetic nervous system regulates pancreatic β-cell expansion during the neo-natal development. Sympathetic innervation has also been involved in the setting up of the islet architecture during development (Borden et al., 2013). It also blunts insulin secretion via the release of Neuropeptide Y (NPY) on the β-cells (Thorens, 2014)(Röder et al., 2016). Overall, insulin secretion is tightly regulated as its release into the organism has massive metabolic consequences.
5.
Insulin granule biogenesis
Compared to glucagon, insulin biogenesis has been more studied. Insulin is first synthesized as a pre-pro-insulin precursor on the ribosome of the Rough Endoplasmic Reticulum (RER), and is cleaved to proinsulin during its translocation into the lumen of the RER. Subsequently, proinsulin molecules pass through RER and Golgi to the Trans-Golgi network (TGN) to be packed inside special vesicles, the so-called insulin secretory granules. Insulin secretory granules serve as a compartment where maturation of proinsulin to insulin occurs through coordinated activity of endopeptidases (Goginashvili 2015, thesis). While the distal mechanism involving insulin granule secretion via fusion with the plasma membrane have been extensively
18 studied, the biogenesis of insulin granules at the TGN is less known. My laboratory made several important discoveries in this context which will be discussed later in the following sections.
6.
Insulin signalling pathway
Insulin is released into the blood stream reaching different target organs. Upon its binding to its receptor, InsR, insulin activates the insulin pathway. The InsR is a member of the tyrosine kinase receptor family and is widely expressed on the cell surface of almost all organs including the brain and islet cells. It can bind insulin, Insulin-like growth factor 1 (IGF1) and IGF2. Upon binding of insulin on its extracellular α subunit, the InsR dimerizes putting in close localization its intracellular β-subunits, allowing the autophosphorylation of the InsR which creates new docking sites for substrate proteins such as insulin receptor substrate 1 (IRS1), IRS2 or Src homology 2 domain containing transforming protein (SHC). The InsR can then phosphorylate bound substrates, recruiting additional substrates. The InsR activates mainly two major cellular pathways: the PI3K-Akt pathway that impacts on glucose uptake, lipid metabolism, glycogen synthesis and gluconeogenesis and the MAPK pathway which plays a role in protein synthesis, growth, survival and differentiation. The actual outcome of insulin receptor activation depends on the expression of downstream signalling modules in the stimulated cell. Therefore, the responses to insulin differ depending on which tissue is targeted (Gehart et al., 2010).
In the liver, as opposed to glucagon, insulin binding upon its receptor activates glycolysis and glycogenesis. Insulin stimulates glycolysis by increasing the expression of the hepatic glucokinase gene (GK). Insulin inactivates the glycogen phosphorylase (GP) and the glycogen synthase (GS) through the PI3K-Akt pathway, which in turn activates glycogen synthase (Röder et al., 2016) in order to favour glycogenesis. Insulin also represses the expression of the PEPCK gene by disrupting CREB association with RNA pol II. Expression of the G-6-Pase gene through forkhead transcription factor (Foxo1) is attenuated by PKB/Akt-mediated phosphorylation of Foxo1 and exclusion of the latter from the nucleus.
In muscle and adipose tissue, insulin promotes glucose uptake through GLUT4. PI3K recruitment and activation at the plasma membrane generates PI(3,4,5)P3 recruiting the phosphoinositide-dependent kinase 1 (PDK1). PDK1 phosphorylates and activates PKB/Akt and atypical Protein Kinase C (aPKC), which promotes the translocation of the GLUT4 receptor to the membrane (Sandoval et al., 2007)(Khan and Pessin, 2002).
19
Figure 2 : The interplay between pancreatic islets and other metabolic tissues. The full
green arrow represents functions of insulin or glucagon that activate indicated processes. The red line highlights functions of insulin or glucagon that inhibit indicated processes. The dashed green arrows show effects of indicated factors promoting insulin and or glucagon actions functions. The red dashed lines show effects of indicated factors inhibiting the action of insulin and/or glucagon. Details are explained in the text above.
20 Finally, insulin together with leptin are the main hormones feeding the CNS with information about the nutrient status and energy homeostasis of the organism, the so-called adiposity signals (Porte et al., 2005), (Sandoval et al., 2007). Both leptin and insulin can cross the blood-brain barrier and bind on their respective receptors. The InsR is highly expressed in the arcuate nucleus of the hypothalamus. There it activates the POMC neurons, which produce and release the α-melanocyte-stimulating hormone (α-MSH) that is involved in the energy expenditure and weight loss, overall exerting an anorectic effect (Sandoval et al., 2007). Another population of neurons is present in the arcuate nucleus, the AgRP/NPY producing neurons. They are orexigenic neurons, meaning they promote food intake and are inhibited upon insulin signalling (Röder et al., 2016).
The pancreatic islets are centrally involved in the regulation of glucose homeostasis. Their complex interplay with other central organs trough hormonal cues, neuropeptides or cytokines allows the organism to react accordingly to changes in nutrient availability and to optimally use the stored energy in times when nutrients are sparse. In the next part, I will focus on nutrient sensing mechanisms occurring at the cellular level highlighting the main molecular players in this context. The links between cellular metabolism and organismal metabolism will also be discussed.
II. Nutrient sensing and homeostasis at the cellular
level
Once nutrients are delivered to the cells via the vasculature, they can be used and processed by the cell to derive energy. The sensing of a particular nutrient may involve direct binding of the molecule to its sensor, or occur by an indirect mechanism relying on the detection of a surrogate molecule that reflects nutrient abundance (Efeyan et al., 2015). Lipids and glucose levels can be directly monitored by specific sensors, some examples will be discussed in the first part of this chapter. During energy depletion, the cell can sense a decrease in the energy stock and react accordingly by decreasing their energy consuming pathways and promoting the energy producing one through the activation of a central cellular metabolism player which will be discussed in the second part of this chapter. Conversely, during nutrient abundance, the cells adapt their metabolism to expand and proliferate through the activation of another key
21 metabolic player which will be discussed in the third part. Upon starvation, cells can trigger a self-cannibalistic process to generate de novo nutrients, which will be discussed in the fourth part of this chapter. Finally the lysosome, an organelle common to several nutrient and energy sensors will be discussed in the last part of this chapter.
A.
Lipid and glucose sensing
1.
Lipid sensing
Lipids are nutrients characterized by their hydrophobic carbon backbones and can be used for energy storage and membrane biosynthesis. The cells process lipids in several metabolic pathways to derive energy and their sensing is important for cells to monitor their resource status. However lipid sensing at the cellular level is unclear to a large extent (Efeyan et al., 2015). The most studied lipids are free fatty acids (FFA) and cholesterol.
a) Free fatty acid sensing
FFA sensing can occur at the extracellular space through their binding to G-protein coupled receptors (GPCR) anchored at the plasma membrane. The two most studied receptors are GPR40 and GPR120 (Efeyan et al., 2015). In the pancreatic β-cells, FFA binding to GPR40 was shown to increase glucose stimulated insulin secretion in the blood (Itoh et al., 2003). FFA binding to GPR120 is involved in Glucagon-like peptide 1 (GLP-1) release from the enteroendocrine cells (Hirasawa et al., 2004). Moreover, GPR120 FFA binding at the plasma membrane of adipocytes also leads to the activation of the PI3K-Akt pathways, leading to subsequent glucose uptake from the adipocytes (Young Oh et al., 2010). GPR120 total knock out mice develop severe obesity under a high fat diet, and dysregulation of the GPR120 gene is a feature in obese human patients (Ichimura et al., 2012). In addition to GPCRs, Cluster of Differentiation 36 (CD36) (also known as FAT) receptor has been implicated in direct binding and uptake of intestinal luminal fatty acids (Efeyan et al., 2015).
b) Cholesterol sensing
Cholesterol sensing is better known and strongly relies on regulation of the Sterol regulatory element binding protein 1 (SREBP1) (Brown and Goldstein, 1986). Cholesterol can be derived from the diet or can be synthetized de novo by the cells. It is necessary for membrane fluidity and generation steroid-related metabolites. Upon its presence in the lipid bilayer, it binds to the SREBP1 cleavage activity protein (SCAP), which forms a dimer with the SREBP1 protein
22 (Brown et al., 2002). Cholesterol binding promotes the complex interaction with the Insulin induced gene (INSIG) anchor protein, trapping it in the ER membrane (Yang et al., 2002). Upon cholesterol removal from SCAP due to cholesterol decrease, the SCAP/SREBP1 dissociates from INSIG and shuttles to the Golgi apparatus where the cytoplasmic N-terminal SREBP1 peptide is cleaved off. This allows for nuclear translocation of the cleaved peptide, where it can regulate genes involved in the cholesterol biosynthesis pathway. When the cholesterol levels raise up again, retention of INSIG in the SCAP/SREBP1 complex prevents cleavage of the N-terminus leading to inhibition of cholesterol biosynthesis (Radhakrishnan et al., 2008). SREBP1 can be regulated by another master regulator of nutrient sensing, mTORC1 which will be detailed in the following sections. Inhibition of mTORC1 led to a decrease in expression and processing of SREBP1, leading to a decrease of the transcription of the cholesterol regulating genes (Laplante and Sabatini, 2012).
2.
Glucose sensing
Glucose sensing is crucial for mammalian cells as its metabolism is at the centre of energy homeostasis. Because glucose sensing can differ a lot from one cell type to another, I will mainly focus in this part on the general glucose sensing mechanisms common to many cell types.
a) Glucose entry and GLUT2 sensing
The GLUT2 protein is a sensor of extracellular glucose levels and is present on the plasma membrane of enterocytes, kidney epithelial cells, pancreatic β-cells, hepatocytes and in neurons from the CNS (Thorens, 2014). In contrast to other GLUT proteins (like GLUT4 in the adipocyte and skeletal muscles), GLUT2 has a low affinity towards glucose. Its Km, an inverse
measure of affinity, is around 20mM while Kms of GLUT1 and GLUT4 are around 1mM and
5mM, respectively (Efeyan et al., 2015). GLUT2 allows for efficient transport of glucose across the plasma membrane only under hyperglycaemia while the others GLUTs are active even during low glycemic conditions. Once inside the cell, glucose encounters a second sensor: the glucokinase.
b) Glucokinase sensing
Glucokinase (GCK) catalyses the first step in the storage and consumption of glucose, glycogen synthesis and glycolysis, and its function constitutes a simple, direct intracellular nutrient-sensing mechanism that controls systemic glucose homeostasis. Like all hexokinases, GCK
23 phosphorylates glucose to make glucose-6-phosphate (G6P) trapping it inside the cytoplasm, but unlike the other isozymes, only GCK functions as a glucose sensor because of its low affinity towards glucose (Efeyan et al., 2015). As GLUT2, GCK is only active under high glucose concentrations. GCK is expressed in hepatocytes, pancreatic β-cells as well as hypothalamic neurons.
In addition to direct mechanisms, glucose and lipid sensing can occur indirectly through sensing consumption of the main energy source Adenosine triphosphate (ATP) that is predominantly derived through lipid and glucose catabolism.
B.
AMPK and energy sensing
Nutrients are taken up by cells and converted into energy by a series of metabolic pathways among which glycolysis or the Krebs cycle are the most prominent ones. The main cellular energy carrier in the cell is ATP which delivers its energy through its hydrolysis into Adenosine Diphosphate (ADP) and phosphate or into Adenosine monophosphate (AMP) and pyrophosphate. Because ATP is the source of energy for most cellular processes, cells need to keep their ATP proportion higher than ADP or AMP, in other words their AMP/ATP and ADP/ATP ratios need to be kept low. Cells can monitor their energetic status by sensing changes in AMP/ATP and ADP/ATP ratios. AMP-activated protein kinase (AMPK) is a principal player common to all eukaryotic cells, which can sense changes in those ratios.
1.
AMPK activation
AMPK is a heterotrimeric protein complex formed by a catalytic α subunit and the regulatory β and γ subunits. The AMPK complex is phosophorylated at threonine 172 by the Ca2+/calmodulin-dependent protein kinase kinase-β (CamKKβ) (Woods et al., 2005) or the Liver kinase B1 (LKB1) (Shackelford and Shaw, 2009). ATP, ADP or AMP directly bind on the AMPK γ subunit. When ATP levels are optimal, the γ subunit binds two ATPs and one AMP. Binding to additional AMP prevents dephosphorylation of AMPK and promotes allosteric activation of the phosphorylated kinase (Hardie, 2014). Binding to AMP also promotes threonine 172 phosphorylation by LKB1, via the Axin scaffold protein, which triggers interaction of AMPK with LKB1 (Zhang et al., 2013). AMPK activation thus occurs upon ATP depletion, through the binding of AMP. In vivo, the AMP/ATP and ADP/ATP ratio can raise because of decrease ATP production originating from defects in the metabolic pathways or
24 shortage in nutrient supply happening for instance during ischemia, hypoxia or hypoglycaemia (Hardie, 2014). The AMP/ATP and ADP/ATP can also raise because of higher consumption of ATP, happening for example in muscle cells during exercise. AMPK has been shown to be activated by 5-Aminoimidazole-4-carboxamide ribonucleoside (AICAR), an analog of AMP frequently used to test AMPK gain-of-function.
2.
Effects of AMPK activation
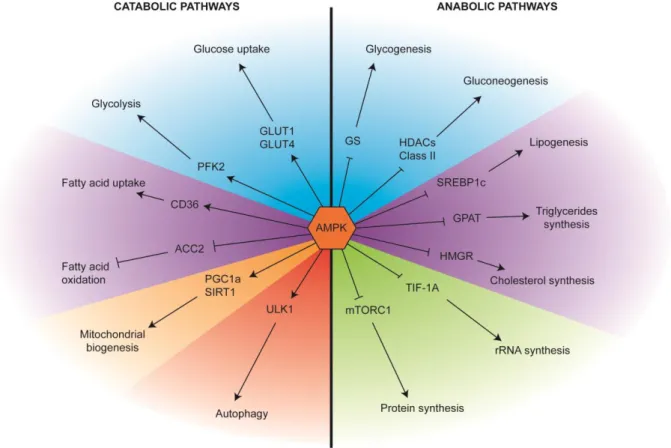
AMPK is a cellular energy regulator. Upon its activation, it enhances catabolic pathways to restore the depleted ATP levels, and inhibits anabolic pathways to prevent further ATP consumption, until the energy balance is recovered. It has been shown to regulate numerous downstream targets regulating metabolic processes involved in glucose, protein and lipid metabolism as well as mitochondrial biogenesis and autophagy.
a) AMPK and glucose metabolism
AMPK has a major role in glucose metabolism. First, AMPK can directly regulate glucose entry inside cells by regulating the glucose transporter proteins. In hepatocytes, AMPK activation increases glucose uptake by increasing GLUT1 translocation to the plasma membrane. It does so by phosphorylating the Thioredoxin-interacting protein (TXNIP) on Serine 308, accelerating TXNIP degradation. TXNIP induces clathrin-dependent internalisation of GLUT1 through direct binding with GLUT1 and also decreases GLUT1 mRNA transcription through an unknown mechanism. Phosphorylation by AMPK enhances it degradation and leads to restoration of GLUT1 translocation to the plasma membrane and GLUT1 transcription (Wu et al., 2013). In skeletal muscle cells, AMPK regulates translocation of GLUT4 in a similar way (Kurth-Kraczek et al., 1999) through phosphorylating TBC1 domain family member 1 (TBC1D1) on Serine 237 and 596. TBC1D1 is a Rab-GTPase activating protein (GAP), which prevents GLUT4 translocation to the plasma membrane. Upon its phosophorylation by AMPK, it is sequestered by binding to a 14-3-3 scaffold protein, inactivating its inhibitory function towards GLUT4 (Pehmøller et al., 2009). AMPK activity can also increase GLUT4 transcription by phosphorylating the Histone Deacetylase 5 (HDAC5) on Serine 259 and 458, which triggers HDAC5 binding to the scaffold protein 14-3-3 trapping it in the cytoplasm. This leads to the recovery of H3 acetylation and GLUT4 transcription (McGee et al., 2008).
Second, AMPK regulates the glycolytic pathway. In parallel to PKA-mediated glucagon responses in hepatocytes (see previous section), AMPK phosphorylates the PFK2/FBPase-2 polypeptide at Serine 466, activating PFK2 and leading to the production of
Fructose-2,6-25 biphosphate (F(2,6)P2). F(2,6)P2 is known to allosterically stimulate the PFK1 enzyme a key component of the glycolysis pathway which converts Fructose-6-phosphate (F-6-P) into Fructose-1,6-biphosphate (F(1,6)P2) and finally into pyruvate (Marsin et al., 2000). In monocytes, Serine 461 of PFK2 is also phosphorylated by AMPK during hypoxic stress (Marsin et al., 2002).
As mentioned above, the opposite pathway of glycolysis is gluconeogenesis. AMPK inhibits gluconeogenesis through phosphorylation of the class II HDACs (HDAC4,5 and 7), trapping them in the cytoplasm. Normally, class II HDACs translocate to the nucleus where they can recruit HDAC3, which deacetylates the FOXO1 transcription factor promoting the expression of the G6PC gene, which encodes the G-6-Pase catalytic unit. G-6-Pase is responsible for dephosphorylation of glucose-6-phosphate, the last step of gluconeogenesis. By trapping class II HDACs in the cytoplasm, AMPK prevents G-6-Pase transcription and dephosphorylation of glucose-6-phosphate (Mihaylova et al., 2011). Finally, AMPKα2 directly phosphorylates Glycogen Synthase (GS) on Serine 7 decreasing glycogen synthesis in muscle cells (Habets et al., 2008)(Jørgensen et al., 2004).
b) AMPK and lipid metabolism
AMPK promotes fatty acid uptake into cardiac myocytes via translocation of vesicles containing the fatty acid transporter CD36 to the plasma membrane. However, the precise mechanisms remains unknown (Habets et al., 2008). Activation of AMPK with AICAR, leads to enhanced fatty-acid oxidation in muscle to regenerate the ATP stocks (Merrill et al., 1998). AMPK is thought to regulate β oxidation by inhibiting acetyl-CoA carboxylase 2 (ACC2) at Serine 221. ACC2 produces malonyl-CoA on the mitochondriat surface, which is an inhibitor of carnitine palmitoyltransferase 1 (CPT1). CPT1 is responsible for the transport of long chain fatty acids into the mitochondria. Therefore its inhibition prevents β oxidation, overall AMPK thus promotes β oxidation (Muoio et al., 1999)(O’Neill et al., 2012). Conversely, AMPK shuts down the ATP consuming pathways involved in lipid storage and synthesis. In the liver and muscle AMPK inhibits the mitochondrial isoform of snglycerol-3-phosphate acyltransferase (GPAT), the enzyme which catalyses the initial and committed step in glycerolipid biosynthesis. GPAT inhibition decreases the de novo synthesis of Triacylglycerol (TAG) and phospholipids (Muoio et al., 1999). AMPK also decreases lipogenesis (fatty acid synthesis) by phosphorylating SREBP1c on Serine 372. This phosphorylation prevents SREBP1c cleavage and translocation of the cleaved peptide to the nucleus, inhibiting the transcription of the lipogenic enzymes (Li et al., 2011). Finally HMGR is the rate-limiting enzyme for isoprenoid
26 and cholesterol synthesis and a substrate for AMPK. The catalytic activity of HMGR is inhibited by phosphorylation of Serine 872 by AMPK (Clarke and Hardie, 1990).
c) AMPK and protein metabolism
Protein degradation can also be a source of energy. One process governing protein degradation is autophagy. This process, I will describe in details in the following sections. Herein, I cover AMPK-dependent autophagy regulation. Shortly, AMPK can trigger autophagy by activation of the master regulator Unc51-like kinase (ULK1) through phosphorylation of multiple serines (Egan et al., 2010) (Kim et al., 2011).
Conversely, protein biosynthesis is inhibited by AMPK. TIF-IA, the RNA Pol I-associated transcription factor that transmits external signals to the nucleolar transcription machinery, is targeted by a variety of protein kinases that phosphorylate it at multiple sites. Upon glucose depletion and AMPK activation, TIF-1A is phosphorylated on Serine 635, leading to a decrease in RNA Pol1-dependent transcription and rRNA biosynthesis (Hoppe et al., 2009). AMPK also inactivates mammalian target of Rapamycin complex 1 (mTORC1), another major master regulator of cellular metabolism, which will be discussed in the following paragraph. AMPK regulates mTOR by at least two mechanisms: first, through activation of the mTORC1 inhibitory protein complex TSC2 through phosphorylation of Threonine 1227 and 1345 (Inoki et al., 2003), and second by direct phosphorylation of the mTORC1 Raptor subunit on Serine 792 leading to its binding to 14-3-3 and the inactivation of mTORC1 (Gwinn et al., 2008). Further details will be provided in the next paragraphs.
d) AMPK and mitochondria
Finally AMPK promotes mitochondrial biogenesis by activating key transcriptional factors through phosphorylation. Increasing mitochondrial biogenesis increase ATP production in long-term. AMPK was shown to phosphorylate the transcriptional coactivator PGC-1α on Threonine 177 and Serine 538 which is thought to promote its docking on transcription factors leading to the increase in transcription of important genes involved in mitochondrial biogenesis such as NRF2, PDK4 or MCAD (Jäger et al., 2007). PGC-1α-dependent transcriptional activity is also regulated through its deacetylation by the SIRT1 protein (Lagouge et al., 2006). AMPK can regulate SIRT1 activity by modulating the NAD+ cellular levels by enhancing beta-oxidation. Moreover, Canto et al demonstrated that PGC-1α phosphorylation was necessary for SIRT1 deacetylation (Cantó et al., 2009) placing AMPK in the centre of regulation of
27 mitochondrial biogenesis. Conversely, AMPK regulates mitochondrial degradation through the control of autophagy (mitophagy) via ULK1 phosphorylation and mTORC1 inhibition.
Overall, AMPK is a master regulator of cellular metabolism upon energy depletion and is activated to restore the ATP stocks by activating catabolic pathways and inhibiting anabolic ones. On the contrary to AMPK, some pathways need to be activated when resources are abundant to switch on the anabolic pathways necessary for cell growth and proliferation. As previously mentioned, the master protein complex at the centre of this regulation is mTORC1.
C.
mTORC1 and amino acid sensing.
The mammalian Target of Rapamycin (mTOR) is the central serine/threonine kinase involved in amino acid sensing, the building blocks for proteins. It can be part of two major complexes, mTORC1 with the accessory protein Raptor and mTORC2 with the accessory protein Rictor.
Figure 3 : AMPK is pivotal in the regulation cellular metabolism. Upon activation of
AMPK, catabolic pathways are promoted, while anabolic pathways are inhibited. Different types of nutrients are depicted with different colours: blue is used to highlight glucose metabolism, purple is used to indicate lipid metabolism and green is used to show protein metabolism. Mitochondrial regulation and autophagy are shown in orange and red, respectively. The arrows indicate process stimulation, while bar-headed lines indicate process inhibition (Derived from Hardie et al 2012).
28 From the two complexes, only mTORC1 is responsive to amino acid fluctuations. mTORC1 activation by amino acids is achieved through its translocation to the lysosomal membrane where resides the small GTPase Ras homolog enriched in brain (Rheb) protein which activates mTORC1 through direct interaction.
1.
mTORC1 activation
The mTORC1 translocation occurs with the help of the Ras-related GTP binding proteins (Rag proteins). This protein family is composed of four small GTPases: RagA, B, C and D, which form the heterodimers RagA/B and RagC/D. The heterodimers stay at the lysosomal membrane through binding to a scaffold complex, the Ragulator complex, which is composed of 5 proteins: p18, p14, MP1, HBXIP and C7orf59. The localisation of RagA/B and C/D is not dependent on amino acid stimulation or GTP/GDP loading (Sancak et al., 2010). The activity of the small GTPases Rheb and Rag is regulated by GTP Exchange Factors (GEFs) (which activates the small GTPases) and GTPase Activating Proteins (GAPs) (which switch them off). The identification of the small GTPase regulators involved in mTORC1 activation or recruitment has become a subject of great interest. When RagA/B is loaded with GTP and RagC/D is loaded with GDP the interaction with the mTOR accessory protein Raptor is enhanced, leading to the recruitment of mTORC1 to the lysosomal membrane (Kim and Kim, 2016). One known regulating GEF for RagA/B is the Ragulator complex, which directly interact with Rags (Bar-Peled et al., 2012). A further level of regulation was uncovered with an inside-out mechanism at the lysosomes involving the vacuolar H+ATPase (v-ATPase). Upon amino acid accumulation in the lysosomal lumen, an activating signal is transmitted via the v-ATPase to activate the GEF activity of Ragulator on RagA. Upon RagA-GTP loading, the Rag-Ragulator interaction weakens and mTORC1 is recruited to the lysosomal membrane (Bar-Peled et al., 2012). One GAP for the RagA/B complex is the GATOR complex, which is composed of 2 subcomplexes GATOR1 and GATOR2. For the RagC/D complex one GAP identified is the folliculin (FLCN) - FLCN interacting protein (FNIP) complex.
mTORC1 activity is not only controlled by amino acids. An increase in glucose also promotes the recruitment of mTORC1 by the Rag GTPases to the lysosomal membrane, promoting its activation (Efeyan et al., 2015). Growth factors (InsR/IGF-1), stress, energy status (AMPK) and oxygen can also modify mTORC1 activity (Laplante and Sabatini, 2012). The TSC1/2 protein complex relays signals coming from most of these pathways and was described as a central hub for mTOR regulation (Huang and Manning, 2008). The TSC complex acts as a GAP
29 for Rheb, replacing the GTP by a GDP. Upon amino acids decrease, RagA loses it GTP to a GDP and RagC/D replaces its GDP to a GTP allowing the recruitment of TSC2 to the lysosome
Figure 4 : mTORC1 regulation at the lysosomal membrane. (A) The presence of amino
acids inside the lysosome is sensed by the v-ATPase, which transmits it to the Ragulator complex, activating its GEF activity on RagA. Concomitantly, the FLCN-FNIP complex binds GDP to the Rag C/D complex. This conformation of the Rags is optimal for their binding to the Raptor subunit of the mTORC1 recruiting it to the lysosomal membrane. At the lysosome, the Rheb protein activates mTOR. (B) On the contrary, upon amino acids depletion inside the lysosome, the v-ATPase is inactive and the Rag conformation is inversed by the action of other GAPs such as the GATOR1/2 complexes. This inhibits interaction of Raptor with Rags releasing mTORC1 to the cytoplasm and increasing recruitment of TSC1/2 complex which inhibits Rheb activity, fully switching off mTORC1 activation.
30 and efficiently inhibiting the mTORC1 recruitment and activation (Demetriades et al., 2014). TSC2 is removed from lysosomal membrane upon insulin stimulation and subsequent Akt phosophosrylation of TSC2 (Menon et al., 2014). Full removal of TSC2 is needed to restore full activation of mTORC1 upon amino acids stimulation. It was recently reported that mTORC1 could still be activated by Leucine and glutamine in the absence of the RagA/B and Ragulator indicating that the canonical activation mechanism was not the only one and suggesting that different amino acids could activate mTORC1 by different means (Jewell et al., 2015).
2.
Effects of mTORC1 activation
a) mTORC1 and protein metabolism
mTORC1 is crucial in protein synthesis at several levels. Translation initiation is regulated by active mTORC1 through the direct phosphorylation of eukaryotic translation initiation factor 4 (eIF4E)-binding protein 1 (4E-BP1) removing it from the eIF4E protein. This removal alleviates the inhibition of the eIF4F complex assembly leading to the start of capped mRNA translation (ma 2009). In parallel, active mTORC1 can phosphorylate S6K1 leading to a cascade of phosphorylation events on numerous transcription initiation factors, including eIF4B, leading to the increase of mRNA biogenesis (Ma and Blenis, 2009). Active mTORC1 was also shown to increase protein biogenesis not only by initiating transcription/translation but also by enhancing the activity of ribosomes. The mTORC1 dependent-phosphorylation of the transcription factor TRIM24 (TIF-1A) leads to its binding with RNA Polymerase I (PolI), resulting in increased rRNA transcription and subsequent expression (Mayer et al., 2004). Maf1, an RNA polymerase III repressor, was shown to be phosphorylated in a mTORC1-dependent manner, preventing its inhibitory effect and thus triggering the production of 5s rRNA and tRNA (Kantidakis et al., 2010).
b) mTORC1 and lipid metabolism
mTORC1 is also essential for lipid synthesis because of its capacity to regulate the SREBP-1 transcription factor and the phosphatidic acid phosphatase Lipin1. As I outlined it in the previous section, the SREBP-1 transcription factor is normally maintained at the Endoplasmic Reticulum (ER) by a short signal sequence, however upon an mTORC1-dependent mechanism it can cleave off its ER-retaining sequence and translocate to the nucleus where it initiates transcription of several genes which encode proteins involved in the de novo synthesis of fatty
31 acids and cholesterol (Laplante and Sabatini, 2009). mTORC1 can directly phosphorylate Lipin1 blocking it in the cytoplasm. When Lipin1 is dephosphorylated and in the nucleus, it prevents the expression of SREBP-1 dependent genes and decreases SREBP-1 levels (Peterson et al., 2011).
c) mTORC1 and macro-autophagy
Finally, mTORC1 inhibits a process called macro-autophagy, which will be discussed in the next section, through phosphorylation of its master regulator, the Unc51-like kinase (ULK1). mTORC1 can also regulate this process by controlling its final step, the lysosomes. Lysosome biogenesis depends on a set of genes belonging the Coordinated lysosomal expression and regulation (CLEAR) gene group. mTORC1 can inhibit the transcription of these genes through phosphorylation of Transcription factor EB (TFEB), which promotes its binding to the scaffolding protein 14-3-3 trapping it inside the cytoplasm (Settembre et al., 2011).
d) mTORC1 deregulation is linked with numerous diseases
Deregulation of mTORC1 has been reported to play a role in cancer and tumour progression through alteration of the 4E-BP1/eIF4E pathway and protein biosynthesis. Increases in lipid synthesis is a hallmark of proliferating cancer cells and has been shown to be mediated through mTORC1 and SREBP1 signalling (Laplante and Sabatini, 2012). Because mTORC1 is also controlling autophagy, it impacts on tumour growth and progression. Finally, mTORC1 has also been shown to play an important role in metabolic regulation in different organs. In the hypothalamus, mTORC1 activation reduces the expression of the orexigenic peptides NPY and AgRP through a yet unknown mechanism that involves S6K1. In adipose tissue, mTORC1 activation promotes adipogenesis by activating PPARγ. High circulating nutrients and cytokines promote mTORC1 activity in obesity, which inhibits insulin signaling and causes insulin resistance through various mechanisms. In skeletal muscle, mTORC1 plays a crucial role in regulating protein synthesis, mitochondrial biogenesis, and oxidative metabolism. Muscle contractions increase mTORC1 activity. In the liver, mTORC1 activation reduces ketone body production by inhibiting PPARα activity. mTORC1 also promotes hepatic lipogenesis by activating SREBP1. mTORC1 activity is elevated in obesity and overfeeding, which promotes hepatic insulin resistance, gluconeogenesis, and lipogenesis. Finally, in the pancreas, mTORC1 regulates β-cell mass by promoting β-cell growth and proliferation. mTORC1 is also important for insulin production and secretion. Obesity and nutrient overload
32 drives mTORC1 activity in β-cells. Sustained activation of mTORC1 ultimately cause β-cell apoptosis by inhibiting Akt signaling. The loss of β-cells favors progression towards diabetes. As previously mentioned, mTORC1 inhibits the macroautophagy upon phosphorylation of its master regulator ULK1. The next section will describe more in details the mechanisms regulating cellular processes in response to nutrient starvation.
D.
ULK1 and macroautophagy
Autophagy represents a housekeeping processes which allows the cells to get rid of their own components, such as defective organelles like mitochondria or peroxisomes, bulk cytoplasm and aggregated proteins or to get rid of infectious agents through lysosomal degradation. Importantly most of the cells also use autophagy to maintain their energy homeostasis upon starvation by generating de novo nutrients from older components (Bento et al., 2016).
Three main types of autophagy have been reported in eukaryotes, microautophagy, which degrade proteins through direct engulfment of cargo by the lysosomes, Chaperoned-mediated autophagy (CMA) which requires the Hsc70 containing complex and translocation of the cargo through a LAMP2A channel and finally macroautophagy, a complex multistep process involving numerous regulators. Most of the factors involved in macroautophagy are proteins forming complexes (Yang et al., 2013). Because macroautophagy has been shown to be involved in a panel of human diseases and is central in cellular nutrient homeostasis, I will mainly focus the following chapter on the latter.
1.
Macroautophagy molecular regulation
Macroautophagy (hereafter referred to as autophagy) is always active at a low basal level. The pathway is kept low thanks to active inhibition of ULK1 by mTORC1 through phosphorylation of the ULK1 at Serine 757. Phosphorylation prevents its interaction with AMPK (Bento et al., 2016). ULK1 normally resides in the Autophagy related complex 1 (ATG1) composed of ULK1, FAK family kinase-interacting protein of 200kDA (FIP200), ATG101 and ATG13. Upon inhibition of mTORC1, starvation or rapamycin treatment, mTORC1-dependent phosphorylation is inihibited, while AMPK phosphorylates ULK1 on Serine 317 and 777 leading to derepression of autophagy initiation (Kim et al., 2011). It is important to understand that mTORC1 inhibition upon starvation is also dependent on AMPK activation. Hence, the three kinases AMPK, mTOR and ULK1 represent major enzymes at the heart of cellular nutrient homeostasis. Active ULK1 is necessary for the recruitment of the Class III PI3K
33 complex I, composed of Beclin1 (BECN1), Vacuolar protein sorting 34 (VPS34, also known as PI3K catalytic subunit 3), VPS15 and Autophagy related 14 (ATG14), to the phagophore initiation site to induce vesicle nucleation.
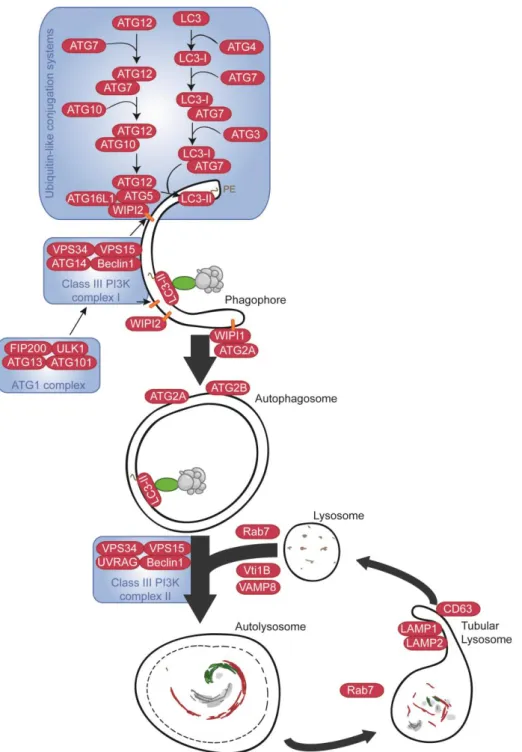
Figure 5 : Molecular mechanisms governing macroautophagy. See details in the text. PI3P
are shown as red rectangles. Adaptor proteins are shown as green ovals. Aggregates to be degraded are depicted in grey. Derived from Bento et al. 2016.
34 The phagophore is a U-shape double membrane whose edges extend, by vesicle elongation, to finally join and form the autophagosome. The class III PI3K complex 1 produce phosphatidylinositol 3-phosphate (PI(3)P) which can induce positive curvature upon their insertion into the membrane thanks to their inversed conical shape (Bento et al., 2016). Moreover the formation of enriched membrane favours the recruitment of the PI(3)P-binding protein of the WD repeat domain phosphoinositide-interacting protein (WIPI) family which are implicated in the formation of autophagosomes. WIPI2 mediates recruitment of the ATG16L1-ATG5/12 complex to the phagophore which is responsible for LC3 lipidation needed for its insertion into the phagophore membrane. Lipidated LC3, bound to phosphatidylethanolamine (PE, and commonly denominated LC3-II), is the end product of the autophagy ubiquitin-like conjugation system. One part starts with ATG12, an ubiquitin-like proteinwhich, like ubiquitin, covalently attaches to substrates via the carboxyl group of its C-terminal glycine (Bento et al., 2016). It binds to the ATG7 E1-like activating enzyme, which activates ATG12 and transfers it to ATG10, an E2-like enzyme which will perform the conjugation with ATG5 making the ATG5/12 sub-complex which associates with ATG16L1 to form the ATG16L1-ATG5/12 complex. On the other part, cytoplasmic LC3 interacts with the ATG4 protein which removes its C-term arginine residues exposing the following glycine residue, which causes the recruitment of the E1-like activating enzyme ATG7 first to form LC3-I. The E2-like enzyme ATG3 binds to LC3-I and with the help of the ATG16L1-ATG5/12 complex mediates the lipidation of LC3-I, which becomes LC3-II and inserts inside the phagophore membrane (Bento et al., 2016) (Nakatogawa, 2013). The PE conjugation of LC3 leads to a visible down shift of the LC3 band in immunoblot analysis, which is commonly used to assess autophagy. LC3-II insertion in the membrane of the phagophore is important for recruitment of targets for their degradation as it serves as an anchor for adaptor proteins such as sequestome 1 (SQSTM1 also known as p62), Neighbour of BRCA1 Gene 1 (NBR1) or the NIX protein. These adaptors bind on one side the component to be degraded and on the other side LC3-II. The recruitment of extra membrane needed for the elongation of the phagophore is accomplished by the mATG9 protein. The origin of these extra membranes is still unclear and debated between three alternative models, the assembly model which consider that the membranes are from different origins, the maturation model which considers that the membrane come from an autophagogome dedicated platform and a third model, which is a combination of the two previous models (Bento et al., 2016).