HAL Id: tel-01943768
https://tel.archives-ouvertes.fr/tel-01943768
Submitted on 4 Dec 2018HAL is a multi-disciplinary open access
archive for the deposit and dissemination of sci-entific research documents, whether they are pub-lished or not. The documents may come from teaching and research institutions in France or abroad, or from public or private research centers.
L’archive ouverte pluridisciplinaire HAL, est destinée au dépôt et à la diffusion de documents scientifiques de niveau recherche, publiés ou non, émanant des établissements d’enseignement et de recherche français ou étrangers, des laboratoires publics ou privés.
Brain network estimation from dense EEG signals :
application to neurological disorders
Aya Kabbara
To cite this version:
Aya Kabbara. Brain network estimation from dense EEG signals : application to neurological disor-ders. Neurons and Cognition [q-bio.NC]. Université Rennes 1; Université libanaise, 2018. English. �NNT : 2018REN1S028�. �tel-01943768�
ANNÉE 2018
THÈSE / UNIVERSITÉ DE RENNES 1
sous le sceau de l’Université Bretagne LoireEn cotutelle internationale avec
L’Université libanaise, Liban
pour le grade de
DOCTEUR DE L’UNIVERSITÉ DE RENNES 1
Mention : Signal, Image, Vision
Ecole doctorale MathSTIC
présentée par
Aya Kabbara
Préparée à l’unité de recherche LTSI-Inserm U1099
Laboratoire Traitement du Signal et de l’Image- Université de rennes1
ISTIC informatique-électronique
Estimation des
réseaux cérébraux à
partir de l’EEG
-hr:
application sur les
maladies
neurologiques
Thèse soutenue au Liban le 19 juin 2018
devant le jury composé de : Olaf SPORNS
Professeur, Indiana University / rapporteur Fadi KARAME
Professeur associé, American University of Beirut / rapporteur
Sophie ACHARD
Chercheur au CNRS, GIPSA-Lab / examinateur Arij DAOU
Professeur assistant, American University of Beirut / examinateur
Fabrice WENDLING
Directeur de recherche Inserm, Université de Rennes1/ directeur de thèse
Mohamad KHALIL
Professeur, Université libanaise/ directeur de thèse Mahmoud HASSAN
Post-doc, Université de Rennes1/ co-directeur de thèse
Wassim EL FALOU
Professeur, Université libanaise/ co-directeur de thèse
3
Résumé en français
Le cerveau humain est un système interconnecté très complexe. L‟identification de réseaux cérébraux fonctionnels et l‟analyse de leurs dynamiques est un enjeu important non seulement pour comprendre le fonctionnement normal du cerveau mais aussi pour développer des méthodes diagnostiques dans les désordres neurologiques. Les études récentes montrent que de tels désordres sont le plus souvent associés à à des anomalies dans la connectivité cérébrale qui entrainent des altérations dans des réseaux cérébraux «large-échelle» impliquant des régions distantes. C‟est particulièrement le cas pour l‟épilepsie et les maladies neurodégénératives (Alzheimer, Parkinson) qui constituent, selon l‟OMS, un enjeu majeur de santé publique. Dans ce contexte, la demande clinique est très forte pour de nouvelles méthodes capables d'identifier des réseaux pathologiques, simple à mettre en œuvre et surtout non invasives.
L’objectif principal de cette thèse est de développer des méthodes d’identification de réseaux pathologiques à partir de l’électroencéphalographie à haute résolution spatiale (EEG-hr, 256 électrodes) qui bénéficie, par ailleurs, et intrinsèquement, de l’excellente résolution temporelle de l’EEG (~1ms).
Durant cette thèse, deux questions principales ont été abordées :
1- Comment suivre la dynamique spatio-temporelle des réseaux cérébraux ? Tout d‟abord, des données EEG enregistrés chez des sujets sains en états de repos (resting-state) ont été analysées. Une méthode développée dans l‟équipe dite « connectivité de sources» a été utilisée pour identifier les réseaux cérébraux au niveau cortical à partir des enregistrements EEG de scalp. Nous avons eu une attention particulière pour l‟aspect dynamique de ces réseaux et leur reconfiguration en fonction du temps à une échelle temporelle très courte (centaine de millisecondes). En profitant de la résolution temporelle offerte par l‟EEG (milliseconde), nous avons pu développer des méthodes pour suivre les dynamiques spatiotemporelles des réseaux cérébraux fonctionnels. Cela a été fait en étendant la méthode « connectivité de sources» afin de générer des réseaux dynamiques en utilisant une approche basée sur des fenêtres glissantes. Ensuite, nous avons exploité la topologie de ces réseaux dynamiques en utilisant la théorie de graphe. Les résultats ont montré la capacité de l‟approche proposée pour suivre les
4 dynamiques spatiotemporelles des réseaux cérébraux impliqués à l‟état de repos. La présence des régions cérébrales considérées comme des « Hubs » a été aussi abordée. Les résultats ont également révélé que les mêmes régions cérébrales peuvent alterner dynamiquement et jouer le rôle de hubs provinciaux (locaux) ou de connecteurs (globaux).
Ensuite, une nouvelle méthode, qui vise à explorer les changements dynamiques des structures modulaires du cerveau, a été aussi proposée. La méthode proposée peut être appliquée pendant l'état de repos ou pendant une tâche cognitive. La méthode a été validée sur des données simulées, et des données d'électroencéphalographie (EEG) et magnétoencéphalographie (MEG) enregistrées pendant le repos et pendant l'exécution d‟une tâche cognitive (dénomination d‟objet et tâche motrice). Les résultats ont montré la capacité de l‟algorithme proposé à identifier les structures modulaires avec une bonne précision spatiotemporelle.
2- Comment élaborer de nouveaux neuromarqueurs? Les méthodes développées et testées sur des sujets sains en états de repos ont été évaluées dans le contexte des désordres neurologiques.
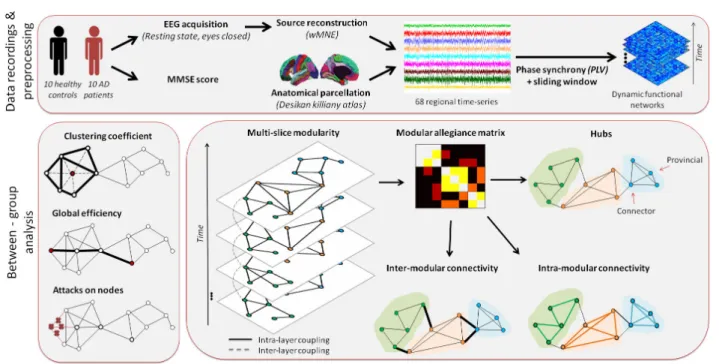
La première application clinique est la maladie d‟Alzheimer. L‟objectif ici est de proposer des nouveaux neuromarqueurs du déclin cognitif calculés sur les réseaux cérébraux identifiés à l‟état de repos. Nous avons commencé par analyser les changements topologiques qui se produisent dans les réseaux dynamiques des patients qui souffrent d‟Alzheimer. Des données EEG ont été enregistrées chez 20 participants (10 patients et 10 sujets sains) à l‟état de repos.
Les résultats ont démontré que les réseaux pathologiques, sont caractérisés par un traitement global de l'information (intégration) plus faible et un traitement de l'information locale (ségrégation) plus élevé comparés aux réseaux normaux. Les résultats ont également montré une corrélation entre les altérations des réseaux cérébraux des patients souffrants d‟Alzheimer et leurs scores cognitifs.
La 2ème application clinique est l‟épilepsie. L‟objectif ici est d‟identifier les réseaux épileptogènes à partir des signaux EEG-hr de scalp. Les réseaux identifiés à partir de l‟EEG-hr ont été comparés aux enregistrements intracérébraux (stéréo-EEG, SEEG) enregistrés chez les même patients. L‟approche appliquée ici est principalement basée sur des paramètres de graphe qui quantifient les réseaux cérébraux locaux. Inspirée de la compréhension actuelle des réseaux épileptogènes,
5 notre approche soutient l'hypothèse suivante: une région cérébrale, qui montre une fonctionnalité locale significativement élevée, joue un rôle central dans le réseau épileptogène. Les résultats ont été validés par la comparaison entre les positions des régions cérébrales détectées par l‟EEG de scalp à la position des électrodes intracérébrales.
6
Abstract
The brain is organized into large-scale functional networks that can flexibly reconfigure their connectivity patterns. Thus, the identification and the analysis of their dynamic functional connectivity can help to better understand the neurological diseases, the general functioning of the brain and to develop new diagnostic methods. It is now recognized that neurological pathologies are due to alterations in these brain networks. Today, a number of modalities and techniques are proposed to identify and analyze these networks to observe their alterations. The main objective of my thesis is to develop methods to identify these pathological networks from electroencephalography (EEG) with high spatial resolution (dense-EEG, 256 electrodes) in addition to the excellent temporal resolution (~ 1ms).
In this thesis, two main challenges were addressed:
1- Tracking dynamics of functional brain networks
First, dense-EEG data recorded in healthy subjects at rest were analyzed. A recently developed method called “EEG source connectivity” was used to identify brain networks at the cortical level from scalp EEG recordings.
I was more interested in studying the dynamic behaviors of brain networks and their reconfiguration on a very short time-scale (sub-second). This was done by extending the "source connectivity" method to generate dynamic networks using a sliding window approach. The topology of the obtained networks was then analyzed using graph theory. Results showed the ability of the method to follow the spatiotemporal dynamics of brain networks involved in the resting state. The existence of brain regions considered as "Hubs" has been investigated. Results also revealed that the same brain regions can alternate dynamically and play the role of provincial (local) hubs or (global) connectors.
In addition, a new method, which aims to explore the dynamic changes of the modular structures of the brain, was proposed. The method presents two algorithms that can be applied during a resting state paradigm, or during a task-directed paradigm (cognitive task). The method was validated on simulated data, and EEG/ MEG) data recorded at rest and during cognitive tasks. Results showed the capacity of the proposed algorithm to identify fast modular structures with good space/time accuracies.
7 2- Developing EEG network-based neuromarkers of brain disorders
The first clinical application is in the context of Alzheimer's disease (AD). The main objective of this work was to explore the topological changes that occur in the dynamic networks of AD patients. EEG data were recorded in 20 participants (10 patients and 10 healthy subjects) at rest. Results revealed that pathological networks are characterized by lower global information processing (integration) and higher local information processing (segregation) compared to healthy networks. Results also showed a significant correlation between the alterations of the brain networks of AD patients and their cognitive scores.
The second clinical application is epilepsy. The objective of this work was to identify epileptogenic networks from scalp EEG signals. The networks identified from dense-EEG were compared to intracerebral recordings (stereo-EEG, SEEG) recorded for the same patients. The approach applied here was mainly based on graph parameters that quantify the local functional networks. Inspired by the current understanding of epileptogenic networks, our approach supports the following hypothesis: a brain region, which shows significantly high local functionality, plays a central role in the epileptogenic network. Results justify the utility of our hypothesis by comparing the positions of the nodes detected using EEG to that of intracerebral recordings. We showed that the proposed approach is very promising in matching cortical brain regions located in the neighborhood of the SEEG implementation.
8 TABLE OF CONTENTS
CHAPTER 1. INTRODUCTION ... 9
1.1.CONCEPT: THE BRAIN AS A DYNAMIC NETWORK ... 9
1.2.NETWORKS AND GRAPHS: DEFINITION ... 10
1.3.NETWORK MEASURES ... 11
1.3.1.DEGREE, IN-DEGREE, OUT-DEGREE AND STRENGTH: ... 11
1.3.2.CLUSTERING COEFFICIENT: ... 12
1.3.3.PATH LENGTH, DISTANCE AND GLOBAL EFFICIENCY: ... 12
1.3.4.MODULARITY, WITHIN-DEGREE MODULE, PARTICIPATION COEFFICIENT: ... 13
1.3.5.HUBS: 13 1.4.BRAIN CONNECTIVITY ... 15
1.5.NEUROIMAGING TECHNIQUES ... 17
1.5.1.FUNCTIONAL MAGNETIC RESONANCE IMAGING (FMRI): ... 17
1.5.2.ELECTRO-ENCEPHALOGRAPHY/MAGNETO-ENCEPHALOGRAPHY (EEG/MEG): ... 17
1.6.EEG/MEG SOURCE CONNECTIVITY ... 20
1.6.1.SOLVING THE INVERSE PROBLEM: ... 22
1.6.2.FUNCTIONAL CONNECTIVITY ESTIMATION... 23
1.7.DYNAMIC FUNCTIONAL NETWORKS ... 24
1.8.THESIS OBJECTIVE... 25
CHAPTER 2. RESULTS ... 28
STUDY 1: IDENTIFICATION OF INTERICTAL EPILEPTIC NETWORKS FROM DENSE-EEG 28 STUDY 2: THE DYNAMIC FUNCTIONAL CORE NETWORK OF THE HUMAN BRAIN AT REST ... 29
STUDY 3: REDUCED INTEGRATION AND IMPROVED SEGREGATION OF FUNCTIONAL BRAIN NETWORKS IN ALZHEIMER’S DISEASE ... 30
STUDY 4: DENSE SCALP-EEG SOURCE CONNECTIVITY PREDICTS DEPTH-EEG EXPLORATION IN EPILEPSY ... 31
STUDY 5: TRACKING FAST MODULAR BRAIN STATES IN REST AND TASK ... 32
CHAPTER 3. DISCUSSION ... 33
3.1. DYNAMIC FUNCTIONAL NETWORKS AT REST AND TASK ... 34
3.2. TOWARD EEG NETWORK-BASED NEUROMARKERS OF BRAIN DISORDERS ... 36
3.3. METHODOLOGICAL CONSIDERATION ... 37
3.3.1.SOURCE LEAKAGE: ... 37
3.3.2.THE ILL-POSED INVERSE PROBLEM... 38
3.3.3.EFFECT OF THE INVERSE/CONNECTIVITY MEASURE: ... 39
3.1.4.SELECTING THE SLIDING WINDOW LENGTH: ... 40
3.1.5.THRESHOLDING THE CONNECTIVITY MATRIX: ... 41
9
Chapter 1.
INTRODUCTION
“Everything appears to be connected in ways that were absolutely unpredictable just ten years ago, or even five years ago”.
-Professor Marc Vidal
We are all part of multiple complex networks: a network of interacting particles in the universe, a network of city streets on the Earth‟s surface and a network of friends, co-workers, neighbors and family. Interestingly, one of the most important networks that we engage with, in our everyday life, is the network of the brain.
It is now well recognized that the brain is a coherent connective system composed of multiple individual units (from cells to areas) interacting with each other.
1.1. Concept: The brain as a dynamic network
Emerging evidence show that most cognitive states and behavioral functions depend on the activity of many brain regions operating as a large-scale network (1–9). To understand this network, it is insufficient to study the activity of a brain region in isolation, but to study the ways in which the brain regions interact and communicate. As many brain responses only last on the order of milliseconds to seconds (10–12), the brain dynamically reconfigures its network organization at sub-second temporal scale to guarantee an efficient cognitive function. Accordingly, several studies have been conducted to assess the spatiotemporal dynamics of functional brain networks during cognitive processes (13–18). This dynamical behavior is even present in the pattern of intrinsic or spontaneous brain activity (i.e when the person is at rest) (17,19–23). Relying on this conceptual understanding, network neuroscientists endeavor to explore the dynamics of the brain connectivity patterns and how they are linked to cognitive and resting conditions. Still, an accurate tracking of the spatiotemporal dynamics of large-scale networks remain an unsolved issue (13).
On the other hand, a large body of studies revealed that neurological disorders (including Epilepsy, Alzheimer, Parkinson…etc.) are associated with disruptions in the structural and
10 functional organization of the brain (24,25). The identification of the related brain networks alterations will help to better understand the neural mechanisms underlying brain disorders, and hence to better monitor and treat patients. From a clinical perspective, the demand is high for non-invasive and easy-to-use methods to identify the pathological networks. More precisely, novel „neuromarkers‟ able to characterize network alterations and associated cognitive deficits are needed.
In this thesis, two main challenges are addressed:
1- Tracking the dynamic changes of brain networks during rest and task at sub-second time scale.
2- Characterizing and identifying the pathological brain networks using a non-invasive technique.
To address both issues, we made use of the electro-encephalography (EEG) which is a non-invasive technique offering an excellent temporal resolution that is not reachable using other techniques such as the fMRI (26–28). The approach adapted is based on a recently developed method called “EEG source connectivity” combined with graph theory.
This chapter presents the background for the understanding of the work, and is organized as follows. First, we start by defining the networks and describing some of the most important network measures derived from graph theory. We then move on to the concept of brain connectivity, focusing on the key distinction between functional, structural and effective brain networks. Afterwards, we introduce the non-invasive neuroimaging techniques used to reconstruct the functional brain networks. Finally, the approach based on “EEG/MEG source connectivity” is described.
1.2. Networks and graphs: Definition
By rendering the brain into a network, network science offers a powerful framework to infer the quantitative organizational properties of brain networks using a branch of mathematics known as graph theory.
A graph is the mathematical representation of a network. It is basically composed of nodes interconnected with edges. Nodes constitute the elementary components of the system such as airports in the airline network. Edges represent the connections or the interactions
11 between the nodes such as flights between airports. Two connected nodes are often named as “neighbors” (29). Depending on the nature of edges, a graph can be categorized into one of four types: directed/undirected and weighted/binary graph (Figure 1.A).
A Graph can be also represented by a connectivity matrix, referred to as “adjacency matrix” where nodes are represented by rows or columns, and edges are represented by matrix elements. In weighted networks, matrix elements are continuous values and can range from strong (highest number) to weak (lowest number). In contrast, in binary matrix, elements are either 0 (connection does not exist) or 1 (connection exists). The undirected graphs are illustrated by a symmetrical matrix. Figure 1.B presents the adjacency matrices of each graph type.
Figure 1. The four types of graph and their corresponding adjacency matrix.
1.3. Network measures
In practice, graph theory offers many quantitative tools to characterize global and local network properties. In this section, we describe the most used graph or network measures in the context of brain networks analysis (Figure 2).
1.3.1.
Degree, in-degree, out-degree and strength:
The simplest measure that can be captured is the node‟s degree, which is the number of edges attached to a particular node (30). In directed graphs, the in-degree and out-degree are the number of incoming and outgoing connections, respectively (29). For weighted
12 networks, another measure can be examined which is the node‟s strength (31). It is defined as the sum of all edges weights connected to a node. These four measures indicate how influential an element is with respect to other elements. Generally, nodes with high degree or strength values are considered to have high number of interconnected nodes. High in-degree nodes are influenced by many other nodes while high out-in-degree nodes are interpreted as influencer elements in the system.
1.3.2.
Clustering coefficient:
The clustering coefficient of a node evaluates the density of connections formed by its neighbors (32). It is calculated by dividing the number of existing edges between the node‟s neighbors to the number of possible edges that can exist between them. The average of all nodes‟ clustering coefficients is the mean clustering coefficient of the whole network. The clustering coefficient is one of the measures used to quantify the local neighborhood and the specialization information in a network, often referred to “local segregation” (33).
1.3.3.
Path length, distance and global efficiency:
In a network, a node can be directly linked to another node using an edge, or indirectly linked using one or many intermediate nodes. Thus, the communication between each pair of nodes is underlined by either short or long path length. In a binary network, the path length between two nodes is the number of connecting edges. In a weighted network, the length of a path represents the sum of the edge weights. The topological distance between two nodes is the length of the shortest path length linking them. Generally, the communication along short paths is thought to be more effective since it is faster, more direct, and less corrupted by noise effects. The global efficiency is the average of the inverse of the distance matrix (34). A network with high global efficiency indicates that, on average, nodes are reached by short communications. The efficiency is then used to quantify the global communication of a network, often referred to “global integration” (33).
13
1.3.4.
Modularity, within-degree module, participation coefficient:
The modularity shows the tendency of a network to be partitioned into modules or communities of high internal connectivity and low external connectivity (35,36). Once a network is composed into modules, many graph metrics can be derived. One of the interesting measures is the within-degree module that assesses the connectivity of each node within its same community. Another measure is the participation coefficient that computes how much a node is connected to nodes of other communities. The within-degree module and the participation coefficient illuminate about the extent to which information is segregated and specialized into modules, and the extent to which information is distributed and shared between modules (37).
1.3.5.
Hubs:
Hubs are components or nodes that play a key role in establishing and maintaining an efficient communication in a network (38). The identification of hubs can infer from many graph measures including the degree, the strength, the betweenness-centrality and the vulnerability (39–42). In addition, hubs can be classified into provincial and connector hubs (37,38,43–45). The main difference is that provincial hubs are mostly connected to nodes within their own module while connector hubs attempt to connect several modules.
14 Figure 2. Some of the network measures used to quantify the characteristics of an undirected binary graph: degree, clustering coefficient, path length, modularity and hubs.
15
1.4. Brain connectivity
Brain connectivity refers to a set of connections linking neural elements. Given the broad range of neuroimaging techniques used to record the brain activity, it is expected to have different ways to analyze the brain connectivity. Mainly, the major distinction is between the structural connectivity, the functional connectivity and the effective connectivity (33,46–48).
Structural connectivity is defined as the physical or anatomical connections between units of the brain. This type of connectivity is generally inferred by the white matter tracts imaged using the diffusion tensor imaging. Structural networks are static networks at the short time scale (seconds to minutes), but can be dynamic at longer time scale (from hours to years). Numerous studies have analyzed the brain topology of structural brain networks at rest (49–53). It has been also revealed that structural connectivity analysis is sensitive to detect alterations of brain networks associated with brain disorders (54–60).
Functional connectivity refers to the statistical dependencies between neuronal populations. Functional brain networks are derived from electrophysiological time-series using electro-encephalography (EEG), magneto-encephalography (MEG) and functional magnetic resonance (fMRI). This type of network is time-dependent and modifies on short time scale. The temporal correlation can be measured using linear correlation, non-linear correlation, coherence, phase locking value and many other metrics (see Section 1.6.2). The functional connectivity was shown as a powerful tool to understand the mechanism underlying the information processing during rest (19,21,22,61–66) and task (14,16,67– 71). Many studies have also explored the functional disruption of the brain networks in brain disorders (72–84).
The way in which the functional networks are computed in our work will be fully described in section 1.6.
Effective connectivity describes the direct interactions between neural elements. Many methods are proposed to construct the effective networks based such as granger-causality (85) and Dynamic Causal Modeling (86). Like functional connectivity, effective connectivity is dynamic and is derived from time-series data.
16 Figure 3. Principal elements of the connectivity analysis. A) structural networks refer to anatomical connections between neural elements, such as synapses linking neurons, or fiber tracts connecting large brain regions. B) functi onal networks as well as effective networks are derived from electrophysiological data time series. Functional networks present statistical dependencies between brain areas while effective networks show causal interactions between brain areas.
17
1.5. Neuroimaging techniques
As we are interested in studying the dynamic changes of the brain at very short time-scale, we particularly focus in this section on the neuroimaging techniques used to construct the functional brain networks.
1.5.1.
Functional magnetic resonance imaging (fMRI):
fMRI is a neuroimaging technique used to map the brain activity by detecting changes of the blood oxygenation (87). In other words, fMRI measures the “blood oxygen level-dependent” (BOLD) signals based on the fact that increased activity in a particular part of the brain increases oxygenated blood flow. This technique is characterized by an excellent spatial resolution. However, its temporal resolution is limited since the BOLD response inferred from the hemodynamic changes takes time (in the order of seconds) (88). In addition, although this technique is based on the correlation between blood flow and the neuronal activity, it is considered as a non-direct measure of the neural activity. Figure 4.A shows example of fMRI acquisition.
1.5.2.
Electro-encephalography/ Magneto-encephalography (EEG/MEG):
EEG and MEG are non-invasive techniques used to record the brain activity using sensors placed on or near the scalp of the head (27,89), as illustrated in Figure 4.B and Figure 4.C. These techniques provide direct observation of the neuronal activity by recording signals corresponding to the electrical/magnetic activity generated by the large neuronal population.
18 Figure 4. Examples of brain activity recordings. A) fmri acqusition. B) meg acquisition. C)
traditional EEG and dense-EEG acquisitions (>128 channels)
EEG/MEG signals can be composed to different oscillations named rhythms (90). These rhythms have distinct properties in terms of spatial and spectral localization. There are six classical brain rhythms as illustrated in Figure 5:
a. Delta rhythm: It is a slow rhythm (1-4 Hz), with relatively large amplitude, and is mainly observed during deep sleep.
b. Theta rhythm: It is a slightly faster rhythm (4-7 Hz), found during drowsiness.
c. Alpha rhythm: Alpha rhythms are oscillations, located between 8-12 Hz. It appears when the subject has closed eyes or is in a relaxation state.
19 d. Beta rhythm: This is a relatively fast rhythm, belonging to the 13-30 Hz frequency band. It is observed in awaken and conscious persons. This rhythm is affected by the performance of movements.
e. Gamma rhythm: This rhythm concerns frequencies above 30 Hz. Gamma rhythm is characterized by a maximal frequency around 80 Hz or 100 Hz. It is associated to various cognitive and motor functions.
Figure 5. Characteristics of EEG/MEG rythms
The main advantages of using EEG/MEG techniques are: i) the non-invasiveness, ii) the direct recording of brain activity, iii) the excellent temporal resolution (at millisecond time scale) and iv) the ease of use. On the other hand, they are characterized by a relatively low spatial resolution compared to fMRI. Recently, a method known as “EEG/MEG source connectivity” has been proposed in order to increase the spatial resolution when applied on dense-EEG (Figure 4.C) and MEG data (91).
20
1.6. EEG/MEG source connectivity
Most MEG/EEG functional connectivity studies were performed at the sensor/electrode level. However, the interpretation of the sensor based recorded signals is not straightforward due to the volume conduction effect as well as the field spread problem (review in (91)). Interestingly, the past years have seen a noticeable increase of interest for functional connectivity at the level of cortical sources reconstructed from EEG/MEG signals. In this context, EEG/MEG source connectivity is an emerging technique that allows overcoming the problem of the volume conduction that corrupts the sensor-level recordings. It also helps to reduce the effect of the field spread (review in (92)).
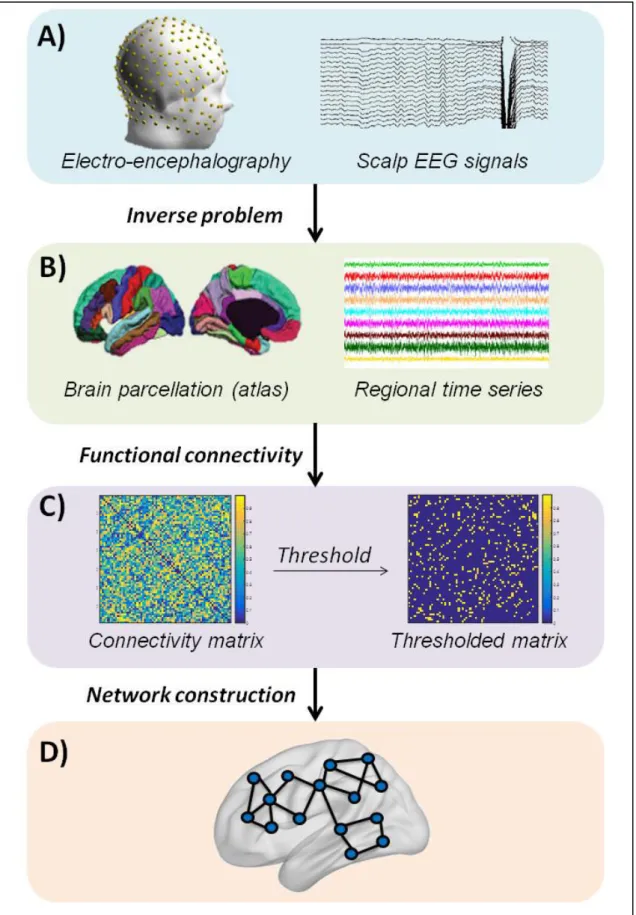
The method involves two main steps: i) solving the EEG inverse problem in order to estimate the cortical sources and reconstruct their temporal dynamics and ii) measuring the functional connectivity between the reconstructed time-series. Figure 6 illustrates the different steps that should be performed to obtain the functional cortical networks from scalp EEG.
21 Figure 6. The full pipeline that shows the different steps performed to obtain a functional network from EEG data. A) EEG time series recorded at the level of the scalp. B) solving the inverse problem to obtain the regional time series. C) computing the functional connectivity matrix. The matrix can be thresholded to remove spurious connections. D) the resulted adjacency matrix will be presented as a graph composed of nodes (where nodes represent the brain regions) and edges (where edges represent the functional connectivity values) .
22
1.6.1.
Solving the inverse problem:
According to the dipole theory, EEG/MEG signals, , measured from sensors can be expressed as linear combinations of time-varying current dipole sources :
.
̂ is the estimation of dipolar source parameters (typically, the position, orientation and magnitude), where and are respectively the matrix containing the lead fields of the dipolar sources and the additive noise. Generally, the lead field matrix can be computed using a multiple layer head model (volume conductor) and the electrodes positions. The head model explains how the electric currents or the magnetic fields flow from the electric generators in the brain (source space) through the different tissues of the head (brain, skull and skin), to finally reach the sensors. The simplest head models are the spherical head models that consider that the head is composed of concentric spheres, where each sphere represents a specific tissue type (93). To compute more accurate and realistic head models, many numerical methods have been proposed such as the Boundary Element Model (BEM) (94,95) and the Finite Element Model (FEM) (96). In brief, these methods compute the individual specific head model by taking into account detailed features of the head anatomy.
Mathematically, the inverse problem is an ill-posed problem as the solution is not unique . For this reason, solving such problems will imply the use of a priori information to limit the approximate solutions. This means that some constraints on the cortical sources properties (amplitude, position, orientation) should be added. S
ee
review in (97) for more detailed comparison between inverse solution‟s assumptions and constraints. Overall, two families of solutions were proposed in the past decade: i) the dipole fitting methods (these methods estimate the position and the amplitude of a limited number of dipoles) and ii) the distributed methods (these methods consist of defining of a priori dense grid of dipoles and then estimating their activity from the recordings).Once the sources are computed on a high resolution mesh surface (usually between 8000 and 15000 vertices), one should estimate the time courses of a set of predefined brain regions or regions of interests (ROIs). A typical way is to use one of the available
23 anatomical and/or functional brain atlases such as Desikan Killiany composed of 68 ROIs (98), the Destrieux composed of 148 ROIs (99) or the Brainnetome composed of 246 ROIs (100). Then, the regional time series can be computed by averaging the source time series across ROIs. Besides averaging, many other strategies can be applied to estimate the activity associated with a ROI. Some proposed to extract the time series from a single representative dipole within the ROI (101,102). The selection of the representative dipole is mainly based on ground truth data (103), or data driven methods (selecting the dipole with the highest power (104), or the largest singular value based on a row singular vector (102), or the highest cross-talk function (CTF) index in the regions (105), or the resolution index closest to 1 in the ROI (106). Others also proposed the use of dimensionality reduction methods such as the principal component analysis.
The connectivity analysis will be ultimately performed between the estimated regional time series.
1.6.2.
Functional connectivity estimation
Measures of functional connectivity compute statistical dependencies between signals. These measures can be linear or non-linear, phase or amplitude-based, and time or spectral measures. Table 1 shows the properties of the most used functional connectivity metrics.
Linear
Amplitude coupling
Linear correlation coefficient Partial correlation Amplitude envelope correlation
Leakage controlled amplitude envelope correlation
Phase coupling
Phase difference derivative Weighted phase lag index (WPLI)
Spectral coherence
Imaginary coherence Magnitude squared coherence
24 Non Linear
Amplitude coupling Non-linear correlation coefficient
Phase coupling Phase-lag index
Phase-locking value
Phase or amplitude coupling Mutual information
Table 1. Overview of the properties of different functional connectivity measures .
Connectivity values are estimated between all pairs of ROIs using one of the connectivity measurements.
This leads to an adjacency matrix (i.e connectivity matrix) of dimension N x N where N denotes the number of ROIs. In order to remove the spurious connections, a threshold is generally applied on the obtained matrix. Empirical, proportional or statistical threshold can be applied. This procedure will enhance the contrast between relevant and irrelevant connectivity values. However, one should be prudent in choosing the threshold approach depending on the data treated. It is recommended to choose a proportional threshold when comparing connectivity between two or more groups (107), and to choose a statistical threshold in other cases (108). Network measures are shown to be stable across statistical and proportional thresholds contrary to absolute thresholds (109).
The adjacency matrix can be considered as a weighted undirected graph composed of nodes representing the brain regions, and edges representing the functional connectivity values.
1.7. Dynamic functional networks
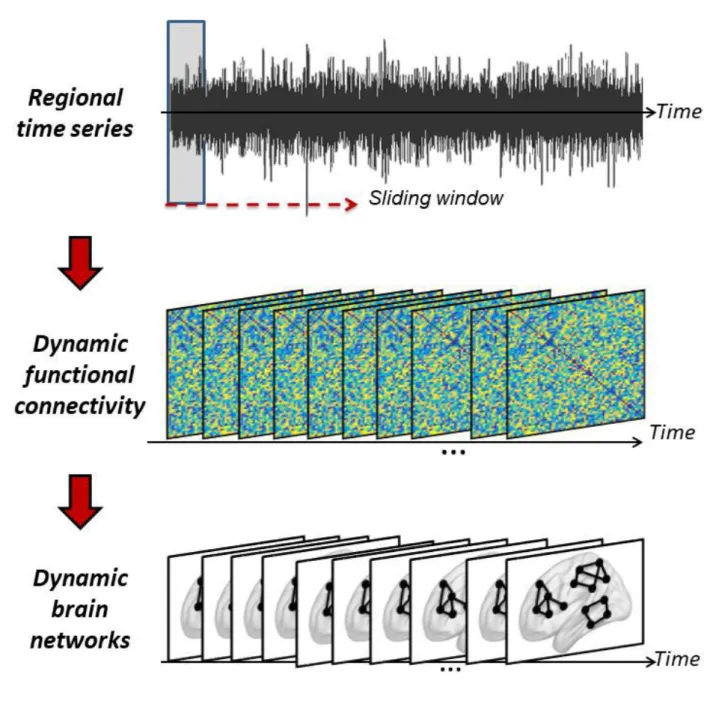
To generate dynamic functional networks, we adopted a sliding window approach. This approach was widely used by many studies (13,19–21,23,68,110–112). The connectivity dynamics are assessed as follows:
- The regional time series are segmented into overlapping or non-overlapping time windows of length L.
- At each window, a functional matrix is computed..
- The window is moved forward to compute the connectivity in the next window. Finally, the process will generate the dynamic connectivity tensor (NxNxL matrix).
25 Figure 7 illustrates the steps performed to generate the dynamic functional connectivity.
Figure 7. The steps performed to assess the dynamic functional conn ectivity of the regional time series using a sliding window approach.
1.8. Thesis objective
Many previous studies have successfully constructed valuable brain networks using EEG/MEG source connectivity method. However, most of these studies have analyzed the brain in a stationary way. Recently, many studies have been elaborated to study the brain networks in a dynamic way, benefiting from the high temporal resolution provided by EEG and MEG (Cohen, 1972; Penfield & Jasper, 1954). Some have proposed to group the
26 temporal networks into states, where each state reflect unique spatial connectivity pattern. These brain states were generated using Hidden Markov model approaches (17,21), K-means clustering (14,15,19,113), or independent component analysis (114). Other studies have tried to investigate the dynamic topological changes using graph theoretical analysis (23).
Our objective in this thesis is to more investigate to what extent the dynamic behavior of the brain can uncover insights about its characteristics during rest and task, in healthy and pathological brain networks. For this end, we extend the use of EEG source connectivity to track dynamic functional brain networks at a short temporal scale.
First, we started by assessing the performance of the EEG source connectivity in “re-estimating” reference large-scale networks modeled at neocortical level in the context of epilepsy. The different combinations of inverse solutions/connectivity measures were evaluated using a biophysical/physiological model and real epileptic data. Based on the previous work in addition to the findings obtained in (14,115), the wMNE/PLV combination was chosen to construct the cortical network in the following works. Second, we investigated the dynamic behavior of the functional brain networks during rest over a very short time scale (sub-second). This was done by combining the EEG source connectivity analysis with graph theoretical study to explore the dynamics of node‟s characteristics (centrality, vulnerability, strength and clustering), networks and modules over hundreds of milliseconds. We also showed that the same regions can play the same role (provincial or integrator) during a given time period. In a third step, the previous approach was applied to explore the disruptions in the functional networks of Alzheimer‟s disease (AD) patients. Using EEG data recorded during resting state paradigm, we studied the dynamic topological changes of AD networks in terms of integration and segregation. The correlation between the brain network disruption and the cognitive score of the AD patients was also assessed. Third, the dynamic functional connectivity was used to identify the epileptogenic networks from EEG signals recorded from spontaneous brain activity regardless of the presence/absence of epileptiform events. Intracerebral SEEG recordings were used to evaluate the accuracy of epileptogenic networks identified from scalp EEG data. Finally, we proposed an algorithm aiming to elucidate the main modular brain structures that fluctuate over time during rest and task conditions. These modular structures can be considered as modular states (MS). The method is based on categorizing the
27 modular structures that share the same topology by quantifying the similarity between the temporal modular structures. Our algorithm was tested on simulated data, and on three datasets recorded from real EEG and MEG acquisitions.
28
Chapter 2.
RESULTS
In this chapter, we present a brief resume of our studies. In the end of this manuscript, the complete version of the corresponding articles will be provided.
Study 1: Identification of interictal epileptic networks from
dense-EEG
Mahmoud Hassan, Isabelle Merlet, Ahmad Mheich, Aya Kabbara, Arnaud Biraben, Anca Nica, Fabrice Wendling
Article published in Brain Topography (2017), 30(1):60-76
Abstract:
Epilepsy is a network disease. The epileptic network usually involves spatially distributed brain regions. In this context, noninvasive M/EEG source connectivity is an emerging technique to identify functional brain networks at cortical level from noninvasive recordings. In this paper, we analyze the effect of the two key factors involved in EEG source connectivity processing: (i) the algorithm used in the solution of the EEG inverse problem and (ii) the method used in the estimation of the functional connectivity. We evaluate four inverse solutions algorithms (dSPM, wMNE, sLORETA and cMEM) and four connectivity measures (r 2, h 2, PLV, and MI) on data simulated from a combined biophysical/physiological model to generate realistic interictal epileptic spikes reflected in scalp EEG. We use a new network-based similarity index to compare between the network identified by each of the inverse/connectivity combination and the original network generated in the model. The method will be also applied on real data recorded from one epileptic patient who underwent a full presurgical evaluation for drug-resistant focal epilepsy. In simulated data, results revealed that the selection of the inverse/connectivity combination has a significant impact on the identified networks. Results suggested that nonlinear methods (nonlinear correlation coefficient, phase synchronization and mutual information) for measuring the connectivity are more efficient than the linear one (the cross correlation coefficient). The wMNE inverse solution showed higher performance than dSPM, cMEM and sLORETA. In real data, the combination (wMNE/PLV) led to a
29 very good matching between the interictal epileptic network identified from noninvasive EEG recordings and the network obtained from connectivity analysis of intracerebral EEG recordings. These results suggest that source connectivity method, when appropriately configured, is able to extract highly relevant diagnostic information about networks involved in interictal epileptic spikes from non-invasive dense-EEG data.
Study 2: The dynamic functional core network of the human
brain at rest
A. Kabbara, W. EL Falou, M. Khalil, F. Wendling & M. Hassan
Article published in Scientific reports 7 (1), 2936
Abstract:
The human brain is an inherently complex and dynamic system. Even at rest, functional brain networks dynamically reconfigure in a well-organized way to warrant an efficient communication between brain regions. However, a precise characterization of this reconfiguration at very fast time-scale (hundreds of millisecond) during rest remains elusive. In this study, we used dense electroencephalography data recorded during task-free paradigm to track the fast temporal dynamics of spontaneous brain networks. Results obtained from network-based analysis methods revealed the existence of a functional dynamic core network formed of a set of key brain regions that ensure segregation and integration functions. Brain regions within this functional core share high betweenness centrality, strength and vulnerability (high impact on the network global efficiency) and low clustering coefficient. These regions are mainly located in the cingulate and the medial frontal cortex. In particular, most of the identified hubs were found to belong to the Default Mode Network. Results also revealed that the same central regions may dynamically alternate and play the role of either provincial (local) or connector (global) hubs.
30
Study 3: Reduced integration and improved segregation of
functional brain networks in Alzheimer’s disease
A Kabbara, H Eid, W El Falou, M Khalil, F Wendling, M Hassan
Article published in Journal of neural engineering 15 (2), 026023
Abstract:
Objective: Emerging evidence shows that cognitive deficits in Alzheimer's disease (AD) are associated with disruptions in brain functional connectivity. Thus, the identification of alterations in AD functional networks has become a topic of increasing interest. However, to what extent AD induces disruption of the balance of local and global information processing in the human brain remains elusive. The main objective of this study is to explore the dynamic topological changes of AD networks in terms of brain network segregation and integration. Approach: We used electroencephalography (EEG) data recorded from 20 participants (10 AD patients and 10 healthy controls) during resting state. Functional brain networks were reconstructed using EEG source connectivity computed in different frequency bands. Graph theoretical analyses were performed assess differences between both groups. Main results: Results revealed that AD networks, compared to networks of age-matched healthy controls, are characterized by lower global information processing (integration) and higher local information processing (segregation). Results showed also significant correlation between the alterations in the AD patients' functional brain networks and their cognitive scores. Significance: These findings may contribute to the development of EEG network-based test that could strengthen results obtained from currently-used neurophysiological tests in neurodegenerative diseases.
31
Study 4: Dense scalp-EEG source connectivity predicts
depth-EEG exploration in epilepsy
Aya Kabbara, Mahmoud Hassan, Mohamad Khalil, Arnaud Biraben, Anca Nica, Isabelle Merlet and Fabrice Wendling
Submitted
Abstract:
Objective: Most brain disorders, including drug-resistant epilepsies, are network diseases. Thus, from a clinical perspective, the demand is high for non-invasive, network-based and easy-to-use methods to identify these pathological brain networks.
Methods: In this paper, we introduce a novel methodological framework to identify epileptogenic networks from scalp dense-electroencephalography (EEG). The proposed approach combines the emerging technique called „EEG source connectivity‟ with graph theory. We used depth-EEG and scalp dense-EEG data at rest (regardless of the presence/absence of epileptiform activity) from 18 patients. Depth-EEG data were used to evaluate the accuracy of epileptogenic networks identified from scalp data. The method performance was quantified by its capacity to identify pathological brain networks in the region explored by depth-EEG in epileptic patients. This quantification was done using hemispherical and lobar accuracies as well as the distance between depth-EEG electrode positions and estimated networks.
Results: Results showed that the proposed approach was able to predict the brain hemisphere (accuracy= 97±9%) and the lobe (accuracy=91±19%) where SEEG exploration was performed a posteriori (averagedistance= 13±11 mm). Results showed also the high advantage of network segregation measures (local functional connectivity) compared to global measures (p<0.01, corrected) in revealing epileptogenic networks. Interpretation: These results may promote the noninvasive dense-EEG as a complementary tool in pre-surgical evaluation in order i) to define of the best depth-electrode placement (hemisphere and lobe) and ii) to highlight cortical regions that may be overlooked during pre-surgical planning.
32
Study 5: Tracking fast modular brain states in rest and task
A. Kabbara, M. Khalil, F. Wendling & M. HassanSubmitted
Abstract:
The human brain is a dynamic networked system that permanently reconfigures its connectivity patterns during time. Thus, developing approaches able to adequately detect the fast brain dynamics is critical. Of particular interest are the methods that study the modular structure of brain networks, i.e. the presence of clusters of regions that are densely inter-connected. In this paper, we propose a novel framework to identify fast modular states that dynamically fluctuate over time during rest and task. We validate our method using MEG data recorded during a finger movement task, identifying modular states linking somatosensory and primary motor regions. The algorithm was also validated on dense-EEG data recorded during picture naming task, revealing the transition between several modular states which relate to visual processing, semantic processing and language. Next, we validate our method on a dataset of resting state dense-EEG data recorded from 124 parkinsonians patients of different cognitive phenotypes. Results disclosed the brain modular states that differentiate cognitively intact patients, patients with moderate cognitive deficits and patients with severe cognitive deficits. Our new approach tracks the brain modular states on an adequate task-specific timescale.
33
Chapter 3.
DISCUSSION
There is growing evidence suggesting that the brain is a networked system of interacting functional regions. This complex system is dynamic and flexibly changes its functional organization of resting (21,23,113,116) and task-evoked connectivity (13,14,114,117).
In addition, progress in the field of network science field has revealed that brain disorders are related to alterations in the functional brain connectivity, disrupting the large-scale network organization and function (Stam 2014, Fornito, Zalesky et al. 2015). Therefore, from a clinical perspective, the demand is high for novel „neuromarkers‟ able to characterize the pathological networks using direct, non-invasive, and easy-to-use methods. We also speculate that an accurate description of the dynamics of brain networks over time not only helps to understand the cognitive functions, but also allow to investigate subtle alterations related to brain disorders.
Among the neuroimaging techniques that allow for extracting relevant information about functional brain networks, Electro-encephalography (EEG) has significantly progressed over the past years. This promising technique offers the opportunity to non-invasively track the temporal resolution of the brain networks. To generate accurate results, EEG signals should be carefully processed.
For many years, functional connectivity analyses using EEG were performed at the sensor level. However, scalp EEG signals are severely corrupted by i) the „volume conduction‟ effect due to the conduction properties of the head and ii) the „field spread‟ problem caused by the fact that many sensors may collect the same activity of a single brain source (Nolte, Bai et al. 2004, Van Diessen, Numan et al. 2015). These two limitations make the interpretation of scalp-based networks a difficult issue.
Recently, an emerging method named “EEG source connectivity” has seen a considerable progress (91). It was shown that this method can successfully identify the brain networks at the level of cortex with a good spatial resolution and an excellent temporal resolution. It also helps to reduce the effects of the volume conduction and the field spread problems.
34 Still, several methodological issues should be considered when reconstructing the brain sources from scalp signals, and assessing their connectivity.
The main achievements of the thesis can be summarized as follows:
- The dynamic analysis of the resting state networks at sub-second time-scale revealed several new characteristics of functional brain networks in terms of centrality and hubness. We showed that the human brain holds a dynamic functional core network of a set of central brain regions that dynamically warrant both segregation and integration processes. By classifying the brain regions into local and global hubs, we showed that the same brain region can dynamically switch its function between provincial (segregation) and connector (integration) hubs.
- A novel framework to explore reconfiguration of fast modular brain structures was developed in order to extract functional modular states during both task-free and task-related paradigms. We validate the new framework using MEG data recorded during a finger movement task, identifying modular states linking somatosensory and primary motor regions. The algorithm was also validated on dense-EEG data recorded during picture naming task, revealing the sub-second transition between several modular states which relate to visual processing, semantic processing and language.
- By investigating the dynamic topological alterations in Alzheimer‟s disease networks, we showed that AD networks are characterized by lower global information processing (integration) and higher local information processing (segregation), compared to networks of age-matched healthy controls.
- In the context of epilepsy, results showed that network segregation measures (local functional connectivity) compared to global measures in matching intracerebral EEG sites. The local network measures were able to match the brain hemisphere (accuracy= 97±9%) and the lobe (accuracy=91±19%) where SEEG exploration was performed posteriori (average distance= 13±11 mm).
3.1. Dynamic functional networks at rest and task
Tracking the temporal dynamics of brain networks is an important issue that helps to improve our knowledge about the cognitive and behavioral tasks, and the
35 neuropathological diseases. Studying the dynamic brain networks reconfiguration can include longitudinal studies aiming to explore the slow changes of brain topology with the normal aging. It also includes the investigation of fast spontaneous or evoked changes in response to external stimuli. In particular, tracking the spatiotemporal dynamics of large scale networks over a very short time duration is a very challenging issue in task and rest (13,19). Thanks to the excellent temporal resolution of electrophysiological modalities (such as EEG and MEG), we have a unique opportunity to access how the functional connectivity evolves in short-time (sub-second) and how it may be perturbed by brain disease.
The use of the dynamic functional connectivity has revealed potential impact for basic neuro-scientific and clinical studies. Importantly, several resting studies showed that some crucial regions play a key role in maintaining efficient temporal communication in the whole brain (23,116). Other studies focused on assessing the temporal transitions between resting state networks (21). The importance of uncovering the dynamic behavior of the brain was also demonstrated in many cognitive tasks (14,17,18,45). While these studies differ in the way in which the functional networks were analysed, they succeeded to characterize the temporally-evolving networks that rapidly dissolve during tasks. According to clinical applications, dynamic connectivity was important to relate brain behavior to pathology in anesthesia (118), epilepsy (119), Parkinson (82), and depression (120).
To measure the dynamics of large scale functional networks using EEG and MEG, several methods have been developed and proposed during the last decade. Some of these studies proposed to group the temporal networks into states, where each state represent a distinctive connectivity pattern. These brain states were mainly generated using Hidden Markov model approaches (17,21), K-means clustering (15,19,113) or independent component analysis (114). However, a precise characterization of the dynamic reconfiguration of the brain at very fast time-scale has rarely been studied. To tackle this issue, we developed methods to track the dynamic aspects using graph theoretical analysis, in order to investigate the dynamic topological changes during rest (Study 2, Study 3, Study 4) and task (Study 5). Particularly, the sliding window approach was used. The key contribution of the developed methods is that they went beyond the state of the art techniques by looking at the temporal transition between brain regions, network hubs, and
36 modules over sub-second time scale. Results obtained from the resting state study revealed the existence of a functional dynamic core network formed of a set of key brain regions that ensure segregation and integration functions. One of the primary benefits of the method is that it was capable to show that the same central regions dynamically alternate its function between provincial (local) or connector (global) hub. In addition, the method proposed to elucidate the main modular brain structures that fluctuate over time has revealed applicability in rest and task paradigms. In particular, it was able to automatically decipher functional modular brain states i.e. subset of brain modules implicated in a given brain function at adapted time period.
A challenge that future studies may need to address is how to dynamically regulate the sliding window width instead of predefining it. Another important issue that could be tracked in the future is the development of electrophysiological models that allow researchers to compare experimental results to computational results, and to more relate the functional networks to the mechanism that drive brain connectivity.
3.2. Toward EEG network-based neuromarkers of brain
disorders
Brain disorders are often associated with alterations of large-scale functional brain networks. Methods able to identify these pathological networks from easy-to-use and non-invasive techniques are clinically needed. From theoretical point of view, network neuroscience has offered the opportunity to more understand and quantitatively assess the characteristics of brain networks. Hence, multiple studies have explored the functional connectivity in brain disorders using MEG/EEG (121). However, most of these studies were performed at the sensor-based level where signals are corrupted by the volume conduction and the field spread problems. As an emerging technique, MEG/EEG source connectivity allows reconstructing the functional brain networks at the level of cortical sources from sensor level recordings (91). The main key advantages of MEG/EEG systems is the non-invasiveness, the ease of use and the excellent temporal resolution that help to analyze fast dynamical changes that may occur in brain disorders such as epileptic seizures. In addition, MEG and EEG directly measure the neuronal activity in contrast with blood-oxygen-level-dependent (BOLD) signals.
37 Recently, MEG/EEG source connectivity has revealed valuable information about the functional networks involved in brain disorders. Promising results were obtained in characterizing the networks involved in epilepsy (77,80,122–128), Alzheimer and Parkinson diseases (82,84,129–131). Besides identifying the pathological brain networks, many studies were interested in assessing an association between the degree of cognitive deficits and the alterations of functional connectivity in the context of neurodegenerative diseases (82,129). Thus, we speculate that this potential technique will have high clinical impact not only for accurately identifying pathological networks, which is crucial in some disorders like epilepsy, but also offering the possibility to develop neuromarker for neurodegenerative diseases ( neuromarker for cognitive impairment in Parkinson‟s disease and Alzheimer‟s disease). The reported results showed that this objective can be achieved by appropriate processing techniques and sufficient database. This can offer the opportunity to develop new start-ups in order to provide easy to use tools for clinicians.
In the context of epilepsy, MEG/EEG source connectivity could be used to help in developing new therapeutic approaches based on neurostimulation by optimizing the brain stimulation protocols. Indeed, the technique could aid to know when and where the stimulations should be applied (central node or „hubs‟ may be the major target to be stimulated).
3.3. Methodological consideration
3.3.1. Source leakage:
While the functional connectivity at the source level reduces the effect of the field spread, it doesn‟t totally suppress its effects (91). The main outcome of the source leakage is that spurious connections can occur between adjacent regions. To overcome this problem, several techniques have been initially proposed to solve the problem at the sensor level, such as the imaginary coherence (132) and the phase lag index (133). Others have suggested to track the problem at the source level before performing any connectivity analysis (134,135). All the proposed approaches are based generally on ignoring zero-lag interactions among signals, by supposing that their contributions are only due to the source leakage. Other studies proposed to only keep the long-range connections (22,23,116). Although these approaches have some advantages, they may suppress important correlations that occur at zero-lag (67) or even among close regions (136).
38 Since “EEG source connectivity” is a relatively young field, such problems are still under discussion and more efforts are needed to completely address the source leakage problem.
It is also noteworthy that the number of regions of interests (ROIs) may be related to the effect of the “mixing sources”, as the reconstructed signals that belong to a single ROI will be averaged. This means that choosing a low number of large ROIs could help in removing spurious links that occur between spatially adjacent sources. However, it may cause a low spatial resolution. There is, so far, no clear consensus about how to select the appropriate number of nodes that represent the large-scale networks. Hence, one should adapt a compromise between low and high number of ROIs to attempt good spatial resolution and reduced spatial leakage between the regional time series.
In this thesis, we used 68 anatomical ROIs (Study2, Study3 and Study5) to define the nodes in the brain network. We assume that 68 regions were sufficient to investigate the global characteristics of the brain networks while minimizing the problem of spurious connections between „very close sources‟. As defining epileptogenic networks from dense-EEG requires higher “granularity”, i.e. spatial precision and accurate characterization of the network local properties, the number of anatomical ROIs was increased to 221 ROIs.
3.3.2. The ill-posed inverse problem
It is likely that the selection of a source imaging method to solve the inverse problem has a remarkable effect on the accuracy of the reconstructed source signals, and ultimately on the brain networks obtained. From a methodological point of view, as the number of source dipoles (in thousands) is much larger than the number of sensors (in hundreds), the inverse problem is ill-posed. This implies that adding physical and mathematical constraints is necessary to solve the inverse problem. These constraints can be applied on the spatial, temporal, or spatio-temporal properties of dipoles distributions (97). Thus, depending on the imposed hypothesis, each brain imaging method has its strengths and weaknesses. A detailed comparison between different brain imaging methods developed in the context of EEG/MEG source connectivity was reported by (97). The review describes the hypotheses, the advantages and drawbacks of seven algorithms (sLORETA, MCE, MNE, VB-SCCD, STWV-DA, Champagne, and 4-ExSo-MUSIC). It also provides a quantitative evaluation of the seven methods performance tested on simulated data for an example of epileptic EEG activity, by assessing the distance of Localization Error and the CPU runtime.
39 In this thesis, we used the weighted minimum norm estimate (wMNE) as an inverse solution. Based on (97), the main assumption of the weighted minimum norm estimate was to find a solution with lowest energy. This assumption can be generally explained by the economic energy cost of the brain during information processing. Compared to other inverse solutions, the wMNE implies relatively few hypotheses and presents acceptable distance of localization error and CPU runtime (97).
3.3.3. Effect of the inverse/connectivity measure:
Extracting valuable information about brain networks from noninvasive neuroimaging techniques such as MEG and EEG is challenging but reachable. Using “EEG source connectivity”, one should select one of several inverse solutions and connectivity measures to construct the functional brain networks. In this context, the obvious question that is raised is: what is the best inverse/connectivity combination that allows constructing accurate brain networks that actually correspond to those activated during considered brain processes?
For this purpose, previous studies performed in the team have been conducted to compare different combinations of inverse/connectivity methods in situations where ground truth data is available. The objective was to determine the optimal combination providing brain networks, from dense-EEG, as close as possible to reference networks. . In the first study, real data recorded during a cognitive task was used (14,115). Interestingly, a large number of combinations between the inverse solution and functional connectivity measures were tested. The objective was to estimate the networks involved during a picture naming task for which a solid background was available regarding activated brain regions and networks. In brief, a comprehensive literature review on these networks was mainly obtained from neuroimaging techniques such as fMRI, MEG, depth EEG and PET. From this review, a “reference” network was determined and used as a ground truth to define a performance criterion about the accuracy of networks obtained from “EEG source connectivity” combinations. For one combination (wMNE/PLV), the estimated network, activated during the cognitive task (500-700 ms), was found to spatially match the reference network. The above described work was then extended from static to dynamic analysis during the same cognitive task. EEG source connectivity method applied using