READ THESE TERMS AND CONDITIONS CAREFULLY BEFORE USING THIS WEBSITE. https://nrc-publications.canada.ca/eng/copyright
Vous avez des questions? Nous pouvons vous aider. Pour communiquer directement avec un auteur, consultez la première page de la revue dans laquelle son article a été publié afin de trouver ses coordonnées. Si vous n’arrivez pas à les repérer, communiquez avec nous à [email protected].
Questions? Contact the NRC Publications Archive team at
[email protected]. If you wish to email the authors directly, please see the first page of the publication for their contact information.
NRC Publications Archive
Archives des publications du CNRC
This publication could be one of several versions: author’s original, accepted manuscript or the publisher’s version. / La version de cette publication peut être l’une des suivantes : la version prépublication de l’auteur, la version acceptée du manuscrit ou la version de l’éditeur.
Access and use of this website and the material on it are subject to the Terms and Conditions set forth at
A study of the accuracy of Dunmore type humidity sensors
Handegord, G. O.; Hedlin, C. P.; Trofimenkoff, F. N.
https://publications-cnrc.canada.ca/fra/droits
L’accès à ce site Web et l’utilisation de son contenu sont assujettis aux conditions présentées dans le site LISEZ CES CONDITIONS ATTENTIVEMENT AVANT D’UTILISER CE SITE WEB.
NRC Publications Record / Notice d'Archives des publications de CNRC:
https://nrc-publications.canada.ca/eng/view/object/?id=e0831aee-d422-4af8-a1fc-405aa1e5d19c https://publications-cnrc.canada.ca/fra/voir/objet/?id=e0831aee-d422-4af8-a1fc-405aa1e5d19c
- - 3
>-, fi; G, ;- *
26.
A Study of the Accuracy of Dunmore Type
Hum
id it y
Sensors*
G .
0.
H A N D E ~ O R D
A N D C. P. HEDLINPrairie Regional Station, Division of Building Research, National Research Council, Saskatoon, Saskatchewan
AND
Department of Electrical Engineering, University of Saskatchewan, Saskatoon, Saskatchewan
ABSTRACT
T h i s paper describes a n investigation of some of the characteristics of commercially available Dunmore-type humidity sensors in the tempera- ture range from 0 to 70°F, with particular reference-to their application in research work where accuracies greater than those guaranteed by the manufacturer are required. A two- temperature recirculating-type atmosphere pro- ducer was used as a calibration standard in these studies.
Results indicate that such sensors have a potential accuracy ranging from hO.1 per cent R H for low-range elements to h 0 . 5 per cent R H for high-range elements under short-term exposure to conditions within their prescribed measuring range. When exposed to a high relative humidity for 24 hours, a decrease in
cell resistance was observed. Storage over desiccant for periods from four m o n t h to four years resulted in a shift in calibration at a rate less than one per cent per year for almost all
*
sensors. Measurements on sensors that have been stored in the laboratory and used occmion- ally for u p to jifteen years indicated substantial changes in calibration with time. Exposure of*
This paper is a contribution from the Division of Building Research, National Research Council, and is published with the approval of the Director of the Division.sensors to a limited number of atmospheric contaminants indicated that ammonia and sulfur dioxide could produce changes in calibra- tion and that vapors of mercury, isooctane, iodine and calcium bromide solution
had
little detrimental effect on low range units.It i s concluded that with careful selection and careful recalibration, commercial sensors m a y be used for relative humidity measurements to accuracies substantiallg better than & I ,5 per cent R H , provided reasonable care is taken in
their use. For precise measurements, calibration before and after use i s necessary.
INTRODUCTION
The Dunmore-type of electric hygrometer has a number of distinct advantages as a
humidity measuring device in research appli- cations. It is of small size, does not sub- stantially add to or remove moisture from the air, and is extremely sensitive to changes in relative humidity a t normal temperatures. These factors have led to its increasing use in control and measurement applications in research studies of the Division of Building Research, National Research Council.
The sensitivity of commercially available sensors is much greater than t h a t indicated by the accuracy tolerance guaranteed by the manufacturer. This suggests t h a t under cer-
266 E L E C T R I C H Y G R O M E T R Y tain circumstances, commercial sensors might
be used for more precise measurement of humidity after calibration to a closer tolerance than the &1.5 per cent normally specified. With this possibility in view, investigation of the characteristics of commercial Dunmore sensors was initiated in 1958 upon completion of a precise calibration facility a t the Prairie Regional Station of the Division of Building Research. Preliminary calibration work was carried out by the third author as part of his M.Sc. thesis program a t the University of Saskatchewan in 1959, and it formed the basis for a continuing program of investigation. This paper summarizes the results of this work up to the present time.
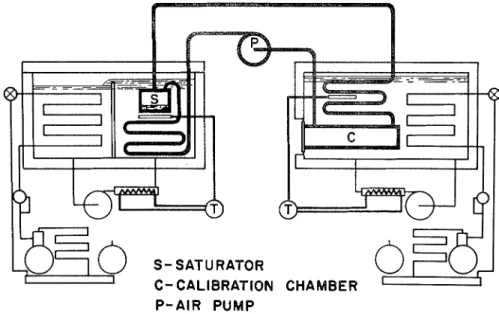
FIG. 1. Two-temperature recirculating-type atmoe- phere producer.
CALIBRATION APPARATUS
The two-temperature recirculating type atmosphere producer used as a calibration standard in this study has been described in detail in the 1iterature.l A photograph of the unit is shown in Fig. 1 and a schematic dia- gram illustrating the various components, in Fig. 2. The preser,?, form of the apparatus differs slightly from the original in that the calibration chamber and heat exchanger are both immersed in a constant temperature bath in the same way as the saturator section. This
provides for some improvement in tempera- ture control and distribution in the high temperature side over that provided by the original apparatus.
The basic principle of operation of the unit involves the recirculation of moist air in a closed system over a flat water surface in a saturator a t one temperature, and heating of the airstream to the higher temperature of a calibration chamber. By recirculation and cooling to the temperature of the water
S- SATURATOR C- CALIBRATION
P - A I R P U M P
CHAMBER
26. CHARACTERISTICS OF DUNMORE SENSORS
surface, the moist air is brought to an equili- brium condition with this surface, and its saturated condition is determined by the temperature and total pressure conditions in the saturator. Reheating of the airstream is then used t o bring its relative humidity to the desired value; measurement of the tempera- ture and total pressure in the calibration chamber enables calculation of the resultant moist air conditions.
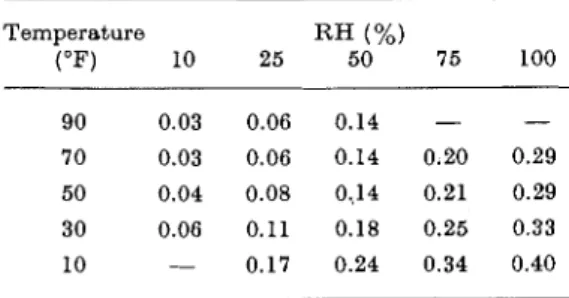
I n practice, i t is not desirable to operate the unit as a completely closed system because of pressure changes resulting from adjustments in temperature. A small connection to the ambient atmosphere is therefore incorporated a t the outlet of the diaphragm pump. The error introduced through this arrangement, combined with those resulting from errors in temperature variation and measurement, have been discussed in a previous paper.l The calculated maximum errors as presented in this paper are reproduced in Table 1.
TABLE 1. M A X I ~ . I U ~ . I UNCERTAINTY IN RELATIVE HUMIDITY EXPRESSED I N PER CENT RH
T e m p e r a t u r e RH (%)
( O F ) 10 25 50 75 100
The sensors t o be calibrated are placed in the calibration chamber on a mounting strip cantilevered from the chamber cover. The mounting strip extends down the length of the chamber and can accommodate as many as twenty sensors. The standard procedure for calibrating the sensors is t o record their resistance with a recording microammeter as the saturator temperature is increased and then decreased in small steps. The use of a recording instrument enables the observer t o determine more easily when sensor equilibrium is established. I n most calibrations, the sensors are preconditioned in the calibration chamber for up to 24 hours, with the actual calibration period involving an additional 8 t o 16 hours.
PRELIMINARY INVESTIGATION
A number of commercial Dunmore sensors had been i n use for control and measurement applications a t the laboratory for many years before the atmosphere producer became available. These sensors had been stored in unsealed containers in a laboratory environ- ment with air conditions ranging from 70°F and 5 per cent R H t o 80°F and 50 per cent R H , with no particular precautions taken t o avoid exposure to contaminants. It was conceivable t h a t some of them had been exposed to high humidity or condensation in use.
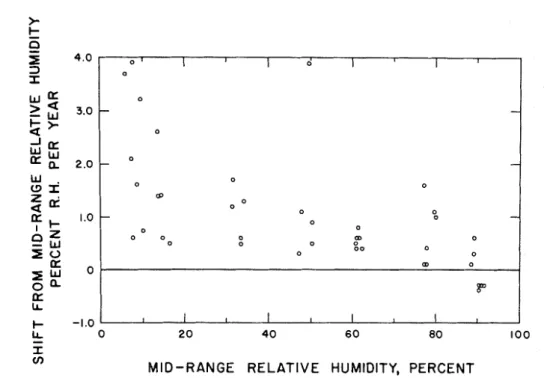
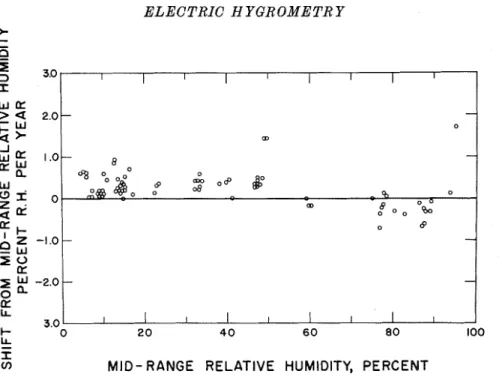
Calibration of a total of forty-one sensors, four to eleven years in age and having initial humidity ranges from 7 to 90 per cent R H , indicated t h a t substantial shifts from the manufacturer's calibration had occurred for some of the sensors. The midrange relative humidity (that corresponding t o a sensor resistance of 1.0 MQ) was determined for each sensor. The difference between this value and the initial value provided by the manufacturer was used t o determine the yearly shift in mid- range relative humidity. The relationship be- tween these values and the original midrange relative humidity of the sensors is shown in Fig. 3.
It may be noted t h a t the largest shift in calibration generally was experienced by sensors having a low initial humidity range. It is also significant t h a t only nine of the forty- one sensors exhibited a shift of over 1.5
&
cent per year, and that almost all of these were the oldest and most likely t o have experienced contamination or damage.SHORT-TERM ACCURACY
Most of the sensors involved in this initial work, including some t h a t had undergone a large shift in range, exhibited a reproducibility of better than f 0.5 per cent R H during cali- bration. Thirty-four of these sensors, together with seventy-seven new ones, were calibrated in the atmosphere producer in 1960. The operating range of each sensor was traversed by increasing the humidity in steps and observing the equilibrium sensor resistance after each change until the top of the range was reached. A similar procedure was then followed for conditions of decreasing humidity,
ELECTRIC H Y G R O M E T R Y
FIG. 3. Shift in midrange relative humidity of sensors stored under general laboratory conditions. W a
i
a9c
I- '.Oz
o w
I 0a
05
k
a
LL -1.0each calibration loop consisting of about ten which sensors of all ranges were recalibrated observations. From one to four sets of observa- after exposure in their operating range for tions were obtained for each group of sensors. periods up to two weeks, confirmed t h a t a These calibration runs involved test periods of reproducibility of &0.5 per cent could be a minimum of three and a maximum of seven expected under such conditions.
days, during which the sensors remained in a
clean environment a t a humidity within their TABLE 2. DEVIATION IN MIDRANGE RELATIVE
0 0 0 8 o O 0
-
-
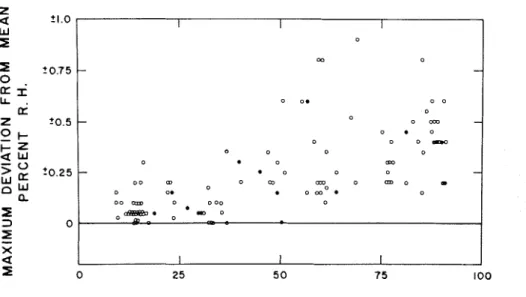
0 0 0 0 0 0 0 OD 0 0 0 0 0 0 0 0 0 m 0 b I I I I I I Ioperating range. On the basis of these data, the mean midrange relative humidity was determined for each sensor and the maximum deviation from this value for any individual calibration was determined. These maximum deviations are plotted for all one hundred and eleven sensors against average midrange relative humidity in Fig. 4. Sensors t h a t had previously shifted to higher ranges are in- dicated by the solid circles.
The average maximum deviations for each of four humidity ranges are shown in Table 2, together with the total number of sensors and the number showing deviations greater than the average. It would appear t h a t with careful selection, most commercial sensors could be used for measurements to accuracies better than *0.5 per cent, perhaps to 10.1 per cent in the case of low-humidity sensors.
A study of saturated salt s o l ~ t i o n s , ~ in
5
0 20 40 60 80 100I
m
MID -RANGE RELATIVE HUMIDITY, PERCENT
HUMIDITY O F SENSORS U N D E R SHORT-TERX E X - P O S U R E T O NORMAL OPERATING CONDITIONS Humidity range, % 0-25 25-50 50-78 75-100 Mean maximum 2 ~ 0 . 1 1 0 . 2 1 0 . 4 1 0.4 deviation, % Total number of 38 22 21 3 0 sensom Sensors showing 8 5 7 4 deviation greater t h a n mean
STORAGE OF SENSORS OVER DESICCANT
It is reasonable to assume t h a t the most ideal storage conditions would be those in which the sensor is held in an atmosphere having a relative humidity consistent with its measuring range. This presents many diffi- culties in practice, however, and one of the
26. CHARACTERISTICS OF DUNMORE SENSORS 269 simplest methods of assuring constancy of
conditions is by storage over mineral desic- cants such as silica gel. This practice is followed by a t least one manufacturer and was adopted a t the Prairie Regional Station, National Research Council, for the storage of Dunmore sensors in 1959.
An indication of the drift in the calibration of sensors stored over silica gel was obtained from tests on a group of sensors obtained in 1959. These sensors were calibrated in the atmosphere producer when received and re- calibrated after two years of storage and occasional use. The results indicated a shift that exceeded 1 per cent RH for approxi- mately one-half of the sensors. Subsequent recalibration of these and other sensors in- volving storage over silica gel for periods ranging from four months t o four years have provided the results shown in Fig. 5. I n this Figure the relationship between the shift in midrange value per year and the final mid- range relative humidity for a total of seventy- nine sensors is shown. Although some matter of points is apparent, only three of the sensors exhibited a shift in midrange humidity of
more than 1 per cent per year. The pattern of experimental points further suggests t h a t shifts tend t o be positive for low-range elements and negative for those of high humidity range, the crossover occurring a t approximately 60 per cent R H .
EXPOSURE TO HIGH HUMIDITY AND CONDENSATION
T h e application of Dunmore sensors t o the measurement of humidity may involve the risk of short-term exposure t o high humidity or condensation under certain circumstances. I n order to evaluate the possible effects of high humidity exposure, three calibrated sensors in each of six humidity ranges from 9 t o 60 per cent R H were exposed in the calibration chamber of the atmosphere producer t o a relative humidity of 98.5 per cent a t 70°F for 24 hours. The sensors were then removed, stored in containers over_ silica gel for approxi- mately two weeks, and recalibrated. The initial and final midrange relative humidity for each of the sensors is listed in Table 3, with the shift in midrange humidity tabulated in
M I D - R A N G E RELATIVE HUMIDITY, PERCENT
FIG. 4. Maximum deviation cf midrange relative humidity from mean value for short- term exposure in normal humidity range.
ELECTRIC HYGROMETRY
MID- RANGE RELATIVE HUMIDITY, PERCENT
FIG. 5. Shift in midrange relative humidity of sensors stored over desiccant.
Midrange Relative Humidity Shift
Sensor Before After ( % R H ) Exposure Exposure
65 t o 80 per cent range was obtained in- advertently during their recalibration. A malfunction of the calibration chamber tem- perature control system resulted in a drop in temperature to a level below the dew point for a short period of time. When control was re- established the sensors were calibrated once more and the shift in midrange relative humidity was determined. The results are presented in Table 4 in a similar way t o Table
3. All the sensors except sensor No. 24 showed a shift in midrange relative humidity similar
TABLE 4. EFFECT OF CONDENSATION O N DUNMORE SENSORS
Midrange Relative Humidity
- Shift
Sensor Before After (% RH) Exposure Exposure
23
the last column. I n all cases but one a negative
24
65.7 61.8
-
3.9 69.2 69.7 $- 0.5shift representing a reduction in sensor resist- 25 74.7 69.8 - 4.9
ance was observed, the largest change occurr- 26 77.5 73.5 - 4.0
ing in sensors of the 30 per cent RH range. 27 78.8 73.8 - 5.0
Some information as t o the effect of con- 28 77.5 72.0 - 5.5
29 77.5 73.5 - 4.0
26. CHARACTERISTICS OF DUNMORE SENSORS
in magnitude and sign t o that of comparable sensors exposed to high humidity. Sensor No. 24 may not have experienced as severe con- densation as the others, and its change in midrange humidity may have resulted from other causes.
EXPOSURE TO CONTAMINANTS
A number of air contaminants are listed by sensor manufacturers as affecting their cali- bration. No exhaustive tests were undertaken to evaluate the effect of contaminants, but some information was obtained for a few
substances to which sensors might be exposed when used a t Saskatoon. The sensors used were those having a nominal midrange relative humidity of 15,25 and 60 per cent. They were calibrated, placed for a period of time in a sealed vessel containing the contaminant, and subsequently recalibrated. I n all cases except those involving a salt solution as a contamin- ant, moist silica gel or a saturated solution of calcium bromide was used in the sealed vessel to maintain the relative humidity within the 15 to 25 per cent range. A number of sensors were also stored in sealed containers over silica gel and calcium bromide solution without
Nominal Expoaurg Shift in Contaminant Concentration Temperature Cell Midrange Time
(OF) No. Midrange
( % by vol) R H (%) (daya) R H at 70°F (%) Sulfur dioxide 2 70-76 38 16 20 4.1 2 70-75 39 15 10 2.5 2 70-75 40 15 5 1.6 0.1 70-76 32
t
15 30 1.7 0.1* 70-76 35t
15 8 1 4.7 0.1 70-76 41 60 30-
1.4 0.1* 70-76 42 60 8 1-
1.1 Ammonia 4.5 70-75 43 15 14 5.6 4.6 70-76 44 15 9 3.8 4.5 70-76 45 15 5 2.1 0.5 70-76 37t 16 30 6.1 0.6 70-76 34t
15 81 3.0 0.5 70-75 46 60 8 1 2.3 0.6 70-75 47 60 30 1.9 Mercury Equilibrium 70-75 30 16 96 0.3 70-75 3 1 16 61 0.1 70-75 32 16 30 - 0.2Isooctane Equilibrium 7&75 33 15 96 0.1
70-75 34 16 61 - 0.2
70-75 35 16 30 -0.1
Iodine Equilibrium 70-75 36 15 96 -0.1
70-75 37 15 30 +0.1
Calcium bromide Saturated 70-75 48 16 67 0.0
solution of 70-75 49 15 96 0.0 the salt 70-75 4 15 34 0.0 Silica gel 17% R H 70-76 60 16 67 0.0 70-75 51 15 96 0.3 70-75 62 15 34 0.2 Dry 70-75 53 15 200 -0.1 Antimony Saturated 85 64 25 0.7 2.5 trichloride solution 85 55 25 0.7 6.5 85 56 25 0.7 6
Calcium chloride Saturated 85 57 15 5 0.8
solution 85 58 25 0.7 0.3
*
SO, leaked out of the container and none remained at the end of the 81-day period.272 ELECTRIC HYGROMETRY
any contaminants in order t o provide a con- trol. The results of those tests and those with contaminants are presented in Table 5, listing the concentration of contaminants, tempera- ture, humidity, duration of test, and resultant shift in midrange relative humidity.
Exposure t o sulfur dioxide resulted in an upward shift in calibration for sensors of the 15 per cent R H range and a downward shift for those of the 60 per cent range. Significant up- ward shifts were measured for sensors of both ranges exposed t o ammonia, and for sensors of the 25 per cent R H range exposed t o a saturated solution of antimony trichloride. Observation of the resistance of sensors over antimony trichloride and calcium chloride during exposure indicated a decreasing sensor resistance with time (negative shift in mid- range value), but on subsequent recalibration the opposite shift in midrange relative humidity was observed (Table 5). For those sensors exposed t o antimony trichloride, the response time had increased t o the extent that several hours' exposure t o constant humidity a t room temperature was not sufficient for them t o reach equilibrium.
Relatively small shifts in midrange relative humidity were observed for those cells exposed to iodine and isooctane. No independent measurement of contaminant concentration was made, the concentrations listed were those corresponding to the vapor pressure a t the temperature used. Calcium bromide solution was used, however, t o maintain the relative humidity in the vessel, and it may have lowered the concentration of the contami- nante.
CONCLUSIONS
The results presented in this paper indicate that commercial sensors of the Dunmore type have a potential accuracy substantially better
than the normally specified tolerance of f 1.5 per cent RH. The accuracy to which they may be used is dependent on the precision of the calibration facilities available to the user and on the nature and duration of the conditions to which the sensors are exposed.
It is demonstrated that accuracies in relative humidity from f 0.1 to f0.4 per cent may be realized during short-term exposure of sensors to atmospheres within their operating range. Under longer periods of similar ex- posure, accuracies of f 0.5 per cent are possible.
Storage of sensors in a dry atmosphere appears to result in a shift in calibration of less than 1 per cent per year, the change being toward a higher humidity range for low-range sensors and to a lower range for high-range sensors. The simplicity of this method of storage and the slow rate of shift that occurs suggest a means for maintaining a n inventory of individually calibrated sensors for precise measurement. With calibration facilities of suitable accuracy available and a program of periodic recalibration, it is practical for sensors t o be made available for laboratory measure- ment with a n accuracy of 1 0 . 5 per cent. Attainment of this precision in measurement would require assurances that the sensor would be handled carefully and not exposed t o contaminants, high humidity, or condensa- tion. I n special cases, accuracies in measure- ment t o 1 0 . 1 per cent R H might be realized through calibration before and after use.
References
1. Till, C. E., and Handegord, G. O., "Proposed Humidity Standard," Trana. ASHRAE, 66, 288-308 (1960).
2. Hedlin, C. P., and Trofimenkoff, F. N., "Relative Humidities over Saturated Solutions of Nine Salts in the Temperature Range from.0 to 9O0F," Humidity and Moisture, Vol 3, New York, Reinhold Publishing Corp., 1964.