China Energy Issues:
Energy Intensity, Coal Liquefaction, and Carbon
ByNing Wu
Bachelor of Economics 2002 Peking University, Beijing, China
Bachelor of Geography 2002 Peking University, Beijing, China
Master of Geographic Information Engineerng 2005 Peking University, Beijing, China
MASSACHUSET S NSTITUTE OF TECH NLOG Y
SEP 27 2011
LiBRA RIES
ARCHIVES
Master of Geography 2006 University of Cincinnati, Cincinnati, OHSubmitted to the Department of Urban Studies and Planning in partial fulfillment of the requirements for the degree of
Doctor of Philosophy in Urban and Regional Studies at the
MASSACHUSETTS INSTITUTE OF TECHNOLOGY September 2011
@ 2011 Ning Wu. All Rights Reserved
The author hereby grants to MIT the permission to reproduce and to distribute publicly paper and electronic copies of the hesis document in whole or in part.
/
/ Q~-'
Certified by
/
Department of Urban Studies and Planning (August 10, 2011)
Professor Karen R. Polenske epartment of Urban Studies and Planning
Dissertation Supervisor
Professor JoAnn Carmin Chair, PhD Committee Department of Urban Studies and Planning
Pricing
Author
(2
Accepted byChina Energy Issues:
Energy Intensity, Coal Liquefaction, and Carbon Pricing
by
Ning Wu
Submitted to the Department of Urban Studies and Planning on August 10, 2011 in partial fulfillment of
the requirements for the degree of
Doctor of Philosophy in Urban and Regional Studies
ABSTRACT
In my dissertation I explore three independent, but related, topics on China's energy issues. First, I examine the drivers for provincial energy-intensity trends in China, and finds that technology innovation is the key driver. Then, to understand how technology innovation takes place, I examine coal-to-liquids technology and argue that companies' business diversification strategies are the key driver for the coal-to-liquids development in China. Third, I study the carbon pricing carbon capture and storage, which supplements the other two from the perspective of finance: the impact of carbon price on investments on carbon capture and storage for power plants.
(1) Provincial energy-intensity (EI) change in China: a case study of three provinces El trends of individual provinces vary, although the whole country shows declining energy
intensity. The energy-intensity trends in the following three provinces seem especially interesting: Inner Mongolia, Liaoning, and Ningxia, because they represent three typical
El trends in China, increasing, nearly constant, and decreasing. Then why and what is
the driver for this difference in energy-intensity trends? I argue that technology innovation plays a key role. I also explore the economic structures and development of renewable energy in three provinces to shed light on how these might affect energy-intensity change in these regions.
(2) Coal to liquids: why and how it makes the case in China
Different from Europe and the United States, China is actively developing coal-to-liquids technologies and projects. In contrast to the conventional wisdom that in China the central govemment mandates and guides coal liquefaction to ensure energy security, I argue that the diversification strategy of state-owned coal companies is another key driver for coal-liquefaction development in China, in addition to the state interest and policy that initiated this move. Given current extensive conversation and debate on Chinese technology innovation capability, my research sheds light on the innovation system in China and provides implications for technology policy and investments.
(3) The impact of future carbon prices on CCS investment for power plants in China I answer two related questions about the development of carbon capture and storage (CCS) and power generation technologies in China: (1) what is the breakeven
carbon-dioxide price to justify CCS installation investment for Integrated Gasification Combined Cycle (IGCC) and pulverized coal (PC) power plants, and (2) what are the risks associated with investment for CCS. In this analysis, I also advise investors on the impact of capital and fuel costs on the carbon price and suggest optimal timing for CCS investment.
ACKNOWLEDGEMENTS
First, I thank my academic advisor and dissertation committee chair, Professor Karen R. Polenske, for her support and encouragement throughout the course of my PhD program.
I started working with Karen on my first-year paper in the summer of 2007, and later on
worked as her research assistant for a few projects related to China energy, and then for my dissertation. Through working with Karen on China projects, I discussed with her the idea of doing a three-essay dissertation on China's energy issues, and Karen expressed great encouragement and offered advice and resources, which later proved to be key for the completion of my dissertation. Her insights, advice, and support made every step of
progress of my dissertation possible. Upon the completion of my dissertation, I also received invaluable guidance and help from Karen for my career development. Her advice, trust, and introductions to leaders in the industry, means a lot to me, now and in the future. My appreciation is beyond words, and my most sincere appreciation goes to Karen.
I also extend my most sincere gratitude to Professor Edward S. Steinfeld and John. E.
Parsons. Ed and John are two other members in my dissertation committee, and without their support, completing my dissertation would be impossible. John's interest and support when I proposed the carbon pricing topic to him was the first and key step to start this analysis. Discussion with John, and his insights in energy and finance, and significant experience in consulting, all kept me going further for the analysis, and benefited me in the long run. Ed always offered insightful and feasible guidance for my research.
Importantly, he provided critical resources to help my field trips in China to interview coal companies and collect first-hand data. I had also the fortune to take his class,
Comparative Politics and China. I benefit from working with John and Ed not only in academics, but from the way they view, analyze, and solve problems and their insights into the industry: these will carry me a long way.
I also thank many other professors and professionals. Professor Joseph Ferreira Jr. was
another big help for my PhD study. He supported my application to DUSP in 2006, and I had the fortune of working with him for my first year at DUSP, which laid down the solid foundation for later years' study and research. Besides, I also thank Professor Frank Levy, JoAnn Carmin, Michael Flaxman, and several others. I thank in particular Dr. LI Wenhua at GE (China), Dr. REN Xiangkun at Shenhua Group, Dr. LI Yongwang at Synfuel China, and Dr. SUN Qiwen at Yankuang Group. They provided information and data that are critical for my research.
During the past five years, I also enjoyed the company of colleagues and friends here. They are from DUSP, other departments at MIT, Harvard, and the Boston area. I also wanted to thank the members of the MIT Sports Taekwondo Club, with whom I spent most of my spare time. They are all remembered in my heart.
Most importantly, I take this opportunity to thank my parents and my sister. It is they who made who I am and where I stand today. Without their care, sacrifice, support and encouragement, I cannot imagine how I could make my way.
TABLE OF CONTENTS
ABSTRACT...-- - - - - -- - - - -. ----... 2
ACKNOW LEDG EM ENTS --- ---...---... --... --... ... 3
FIG URES ...---...---... 5
TABLES ...---... ---... 6
Provincial Energy-intensity Change in China: A Case Study of Three Provinces...7
1. Introduction ...---.. . ----... -... ... 8
2. Three Provinces...- . ---... ...12
3. M ethodology... 14
4. Energy-intensity Changes... 17
5. Energy investment, efficiency and renewable energy... 22
6. Industrial Structure... 26
7. Conclusion and Discussion... 27
A ppendix ... ... --... 28
References...---... ... 31
Coal to Liquids: Why and How It Makes the Case in China ... 33
1. Introduction ... 34
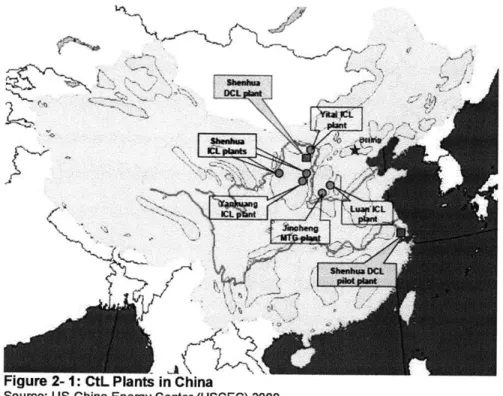
2. CtL in China ... 36
3. Why and How CtL Develops: A Technological-systems View...39
3.1 Energy Resources... 41
3.2 Institutions... 42
3.3 Innovation Features ... 43
3.4 Actors...----... ...45
4. Actors: W hy and How SOEs Develop CtL ... 47
4.1 Coal Producers in China: Decline During the 1990s ... 47
4.2 Diversification Strategies in the Late 1990s ... 51
4.3 Case Studies: CtL as A Diversification Strategy ... 52
4.4. Sum m ary: CtL for Business Diversification ... 63
5. Conclusion ...- --.. --... 66
References...68
The Impact of Future Carbon Prices on CCS Investment for PC and IGCC Power Plants in China...70
1. Introduction ... 71
2. CCS and Electricity Generation Technologies in China... 74
2. 1. IGCC and PC Developm ent in China ... 74
2. 2. Econom ics of PC and IGCC... 76
2. 3. Carbon prices and CCS ... 83
3. M ethodology and Data ... 85
4. Results and Discussion... 88
4.1 Capital Costs... 89
4.2 Fuel Cost... 90
4.3 Investm ent Retum ... 92
5. W hen to Invest in CCS? ... 94
6. Conclusion ...---... ... 96
Appendix: the NPV M odel ... 98
References...--.. . ---... ... 100
FIGURES
Figure 1- 1: China Energy Intensity from 1995 to 2004, National and Provincial...10
Figure 1- 2: Location of Three Provinces in China ... 14
Figure 1- 3: Inner Mongolian Industrial Mix and Efficiency Shift ... 19
Figure 1- 4: Liaoning's Industrial Mix and Efficiency Shift...20
Figure 1- 5: Ningxia's Industrial Mix and Efficiency Shift ... 21
Figure 1- 6: Investment in Technical Updates & Transformation in the Energy Industry 24 Figure 2- 1: CtL Plants in China... 39
Figure 2- 2: Technological-systems Approach for China's CtL Development...40
Figure 2- 3: China Oil Production and Consumption, 1965-2009 ... 41
Figure 2- 4: Coal Production and Consumption in China, 1981-2001...48
Figure 2- 5: Coal Production-consumption Gap in China, 1981-2009 ... 48
Figure 2- 6: China GDP Growth, 1994-2010... 50
Figure 2- 7: China Inflation Rates, 1995-2010 ... 50
Figure 2- 8: Coal Price in China, 1998-2010... 50
Figure 3- 1: Market Exchange Rate Based Costs Comparison: China vs. USA...82
Figure 3- 2: PPP Exchange Rate Based Costs Comparison: China vs. USA...83
Figure 3- 3: Capital Costs andC 2Price... 90
Figure 3- 4: Coal and C 2 Prices...91
Figure 3- 5: BSPI Weekly Average Price...92
Figure 3- 6: CO2 Price and CCS Investment Retum... 93
TABLES
Table 1- 1: Energy Intensity, 1995-2004...9
Table 1- 2: Three Provinces, 2004...13
Table 1- 3: Shift-share Analysis of Energy Intensity in China's Material Production Sector ... ... 18
Table 1- 4: Shift-share Analysis of Energy Intensity in Inner Mongolia's Material P roduction Sector... 19
Table 1- 5: Shift-share Analysis of Energy Intensity in Liaoning's Material Production S ector... . 20
Table 1- 6: Shift-share Analysis of Energy Intensity in Ningxia's Material Production S ecto r... . 2 1 Table 1- 7: Investment in Technical Updates and Transformation in the Energy Industry ...-... 23
Table 1- 8: Shenhua and Ningxia Coal...26
Table 2- 1: Major CtL Projects under Construction in China, December 2009...39
Table 2- 2: Yankuang ICL Costs Estimates ... 44
Table 2- 3: Comparison of Profits: Coal vs. Electricity ... 51
Table 2- 4: Performance of Some Coal Companies, 1999 ... 52
Table 2- 5: New Assets Invested during 1998-1999 ... 52
Table 2- 6: Shenhua Group Operational Performance ... 54
Table 2- 7: Shenhua Leaderships ... 55
Table 3- 1: Active IGCC Projects in China ... 75
Table 3- 2: Performance of SC, USC, Oxy-fuel, and IGCC Plants ... 77
Table 3- 3: Updated Capital Costs, 2010...77
Table 3- 4: Performance of PC and IGCC Plants in China ... 79
Table 3- 5: PC Power Plants Economics, China Huaneng Group ... 80
Table 3- 6: Some IGCC Plant Designs in China ... 80
Table 3- 7: Power Plants Capital Costs Comparison ... 81
Table 3- 8: CCS Incremental Capital Costs Index ... 85
Table 3- 9: Energy Penalty... 86
Table 3- 10: C hina C PI ... 87
Table 3- 11: Power Plants Assumptions... 87
Table 3- 12: Capital Costs andC 2Prices... 90
Table 3- 13: Fuel Costs and CO2 Prices ... 91
Table 3- 14: CO2 Price and CCS Investment Return ... ...93
Provincial Energy-intensity Change in China: A Case
Study of Three Provinces
Abstract
China has incurred a steady decrease of energy intensity (El, energy consumption per unit of gross domestic product (GDP)) since the 1980s, for example, a decrease of 29.3% from 1995 to 2004. El trends of individual provinces vary, although the whole country shows declining energy intensity. The energy-intensity trends in the following three provinces seem especially interesting: Inner Mongolia, Liaoning, and Ningxia, because they represent three typical El trends in China, increasing, nearly constant, and
decreasing. It brings forth a puzzle that Ningxia and Inner Mongolia, with developed renewable energy industry and clean energy technology, have increasing or almost constant El, while Liaoning, which has a heavy industry base and does not have much renewable energy capacity, experienced an El decrease. Whether or to what an extent does the renewable energy development impact energy intensity? What are other
reasons driving the El trends in these regions? How is economic development interacting with energy-intensity issues? In this paper, I examine underlying reasons for differences
in energy-intensity trends. Furthermore I tackle that puzzle by analyzing determinants of the El trends and examining economic structures of these regions.
1. Introduction
China has embraced a steady decrease of energy intensity (El, energy consumption per unit of GDP) since the 1980s. This trend continued in the past decade. From 1995 to 2004, the El of China decreased from 163.25 to 115.42 kilograms standard coal equivalent (kgce) per thousand Yuan (1995 deflated value), a decrease of 29.3%
(Tablel-1 and Figure 1-1).
Scholars have studied China's El at the national level from the perspectives of structural change and real energy intensity (Smil 1990, Polenske & Lin 1993, Sinton & Levine 1994, Lin & Polenske 1995, Garbaccio 1999, Zhang 2003, Polenske 2007). There are mixed opinions. Some argue that structural change was a main factor responsible for the El decrease in the early 1980s when China started the "Open-door" policy, while some find that technology innovation was the main driver for the intensity change (For instance, Polenske & Lin (1993) finds that technology innovation accounted for 80% of the reduction in this period). This structural change factor still worked in decreasing China's
El in the late 1980s and 1990s, but its effect was less significant than the factor of real
energy intensity, which is caused by technology innovation. Based on firm-level data, Zhang (2003) further argues that 88% of the cumulative energy savings in the industrial sector were attributed to real energy intensity change, with approximately 80% of such savings from the four chief energy-using sub-sectors (i.e., ferrous metals, chemicals,
nonmetal mineral products, and machinery). Polenske & McMichael (2002) also find that technology innovation is the primary factor for the El decrease in those firms in the coal industry.
Few analysts have conducted studies concerning El trends of individual provinces in China. In fact the El trends of individual provinces vary, while the whole country shows declining energy intensity. Among all the 30 provinces or municipalities (not including
Taiwan and Hong Kong Special Administration Region and Macau), the following three provinces are especially interesting: Inner Mongolia, Liaoning, and Ningxia (Table 1-1 and Figure 1-1). They represent three typical El trends in China, increase, no significant change, and decrease, respectively. As shown in Table1-1, Ningxia, a less developed province in the northwest but with a well-developed solar power industry, has
experienced an El increase over the past decades, from 308.24 in 1995 to 427.60 kgce per thousand Yuan in 2004 (1995 deflated value), an increase of 38.7% over ten years. Inner Mongolia, famous for wind and solar power and coal gasification industries, exhibits a roughly constant El over this period, from 258.26 kgce per thousand Yuan in 1995 to
220.53 in 2004 (1995 deflated value), but basically fluctuating around 200. Liaoning, a
province with considerable heavy industry, like most provinces, has a steadily decreasing
El trend. Its El decreased from 276.4 kgce per thousand Yuan in 1995 to 122.9 in 2004 (1995 deflated value), a decrease of 55.6%.
Table 1- 1: Energy Intensity, 1995-2004 (Kgce per 1,000 Yuan GDP)
1995 1996 1997 1998 1999 2000 2001 2002 2003 2004 National 163.25 160.74 138.44 123.21 115.31 108.54 98.30 98.38 104.35 115.42
Inner Mongolia 258.26 204.39 248.58 198.75 197.29 191.16 186.73 181.53 175.84 220.53 Liaoning 276.39 218.62 208.69 167.77 148.65 150.86 140.38 132.56 128.40 122.86
Ningxia 308.24 227.73 240.68 233.61 241.20 * * * * 427.60 Note: *: data of energy consumption by sector unavailable from the sources below. Therefore the energy intensity cannot be calculated here. However, Polenske (2007) shows the energy intensity data of Ningxia for this period and indicates that Ningxia has a climbing curve of energy intensity over these 10 years.
Source: SSB&NDRC 1996-2005, SSB 1996-2005; edited by the author
The past decades have also witnessed China's development of renewable energy, which can be dated back to 1982 when the central government issued "Suggestions to reinforce the development of rural energy." (NREL, 2006) More efforts occurred since 1995 when the State Planning Commission, together with other commissions, issued the Outline on New and Renewable Energy Development in China (NREL, 2006). In 2001, the State
Economic and Trade Commission (SETC) proposed its Tenth Five-Year Plan for Sustainable Development, including the Tenth Five-Year Plan for New and Renewable Energy Commercialization Development. Five years later, in 2006, China passed its Renewable Energy Law with a firm objective of boosting the use of renewable energy capacity up to 10 percent of the country's total energy consumption by the year 2020 (compared to 3% in 2003). Totally, since the 1980s, China has issued more than 20 national policies or laws to promote renewable energy development and has achieved considerable progress (NREL 2004a&b, 2006). China's renewable energy development has also received attention from multiple aspects. National Renewable Energy
Laboratory (NREL) under the U.S. Department of Energy keeps track of China's
renewable energy policy. Some scholars, such as Wang (2005), conclude that renewable energy in China is still underutilized that it is even disregarded in official figures. Some reports also state that some provinces still rely on coal industries for economic growth (21 Century Economics 2005).
kqge per 1,000 Yuan
450. 400. 350. 300. 250. 200. 150. 100. 50. 0. 1995 1996 1997 1998 1999 2000 2001 2002 2003 2004
-+- National -w- Inner Mongolia Liaoning Ningxia
Figure 1- 1: China Energy Intensity from 1995 to 2004, National and Provincial
Renewable energy development, on the one hand, has a positive effect on the El decrease. Martinot (2001 a, 2001b) reviews the World Bank's renewable energy projects in China and finds that these projects contribute to energy efficiency or decreasing El in China by promoting the awareness of energy conservation. On the other hand,
renewable energy development is supposed to help decrease El as it brings forth technology innovation of energy use (NREL 1999, Martinot 2001a&b, Gao et al. 2005). For example, coal gasification, an innovation introduced in this period in Inner Mongolia, not only decreases energy intensity but reduces carbon-dioxide emissions (Moniz & Deutch 2007, SEPA 2004).
Within this background, Inner Mongolia has achieved significant growth in its renewable energy, especially wind power and solar power. Inner Mongolia has the highest wind power potential in the country and the total wind power capacity by the end of 2005 was
166,000 kw, ranking 1st in China, with a projected capacity of 4,000,000kw by 2010
(North News 2006). Ningxia's solar industry dates back to the 1970s, and the government plans to build up its annual solar power capacity, which can substitute for 432,000 tons of coal equivalent, about 5% of its annual coal consumption in 2004 (San 2004). Liaoning, which has a heavy industry base, does not have much renewable energy capacity so far. It becomes a puzzle that Ningxia and Inner Mongolia, with developed renewable energy industry arid clean energy technology, have increasing or almost constant El, while Liaoning, which has a heavy industry base and does not have much renewable energy capacity, experienced an El decrease. In this analysis, I tackle this puzzle by exploring what drives the changes of energy intensity in Liaoning, Inner Mongolia, and Ningxia. I also probe what factors prevent renewable energy from playing a role in decreasing energy intensity. In this paper, I shed light on what factors account for El changes in those regions and what factors hinder or reduce the effect of renewable energy.
2. Three Provinces
Inner Mongolia, Liaoning, and Ningxia are located in the north of China (Figure 1-2). Inner Mongolia has an area of 1.18 million kilometers (km) occupying about 12% of China's land area. In 2004, it had a population of about 24 million and its GDP was 271 billion Chinese Yuan (Yuan), which makes its GDP per capita rank 12th among all the provinces and municipalities in China. Its energy consumption occupied 3.9% of the national total, lower than Liaoning's but two times more than Ningxia's 2004 GDP. Liaoning has a larger population but smaller area than Inner Mongolia. Liaoning as of 2004 achieved a per capita GDP of 16,300 Yuan, almost double the national average of 9,649 Yuan. Accordingly, its energy consumption is higher, claiming 5.7% of the national total. Ningxia, the smallest province amongst the three, consumed about 1.3% of the national total energy in 2004 for its GDP of 46 billion Yuan. Ningxia's per capita 2004 GDP is about 81% of China's average, placing it as the 30th region (the second smallest in China, only higher than Tibet).
Inner Mongolia is famous for its abundance of coal and is an important coal base in north China (it also has other resources, such as cashmere, natural gas, and rare earth
elements, and more deposits of naturally occurring niobium, zirconium and others). It planned to double its annual coal production, from 260 million tonnes in 2005 to 500 million tonnes per year by 2010 (PDO, 2005). Shenhua Group is the largest coal
company in China (see the coming section), comparable to Peabody of the United States. Inner Mongolia develops its industry around coal, power generation, and so on. Six industries, energy, chemicals, metallurgy, equipment manufacturing, processing of farm produce, and hi-tech products, are stressed by the provincial government as competitive industries.
Liaoning is one of China's most important industrial bases, covering a wide range of industries, such as machinery, electronics, metal refining, petroleum, chemical industries, coal, and so on. It has the most iron, magnetite, diamond, and boron deposits among all province-level subdivisions of China. The history of being a base for heavy industry in China since the birth of the People's Republic of China and its abundance of iron and other resources make Liaoning a key producer of steel in China. It has several large steel corporations, such as Anshan Iron and Steel Group Corporation, and Benxi Steel Group Corporation. In 2006, Liaoning accounted for 1/6 of the total steel production in China.' Ningxia is a relatively undeveloped region, by its GDP. Coal is its key resource and the coal industry has become a base industry in Ningxia. East Ningxia Coal Basin is one of the 13 main huge coal production areas in China, with a proven reserve of 27.34 billion tonnes and a potential reserve of 139.43 billion tonnes (SSB 2005). Developed by NingXia Coal Industry Corporation (merged with Shenhua Group from Inner Mongolia), this coal base will become an industrial park with mainly energy-intensive industries
including coal mining, coke making, coal tar, and petroleum products. Ma Qizhi (2006), then the governor of Ningxia, stated that "The project of East Ningxia Coal Base is the
key for ensuring our GDP growth of more than 10% per year until 2020." Table 1- 2: Three Provinces, 2004
Area Population GDP GDP per Energy consumption
ca pita(Yuan) (10,000 tonnes
(kin2
) (Persons) (Billion of standa rd co al
Yuan) equivalent) Inner Mongolia 1,183,000 23,840,000 271 11,400 5,642 (3rd) (23rd) (23rd) (12th) (3.9%) Liaoning 145,900 42,170,000 687 16,300 8,180 (21st) (14th) (8th) (9th) (5.7%) Ningxia 66,000 5,880,000 46 7,830 1,844 (27th) (29th) (3 0th) (23rd) (1.3%) National 9,600,000 1,295,330,000 12,496 9,649 144,227
Source: SSB 2005, edited by the author.
Anan
Figure 1- 2: Location of Three Provinces in China
Source: http-/chinamash.conwp-content/uploads/2006/08/china-map.jpg
3. Methodology
In this analysis, energy intensity is the amount of energy consumption per unit of gross domestic product (GDP) or gross regional product (GRP). Energy consumed is measured
by 10,000 tonnes of standard coal equivalent (based on calorific value calculation). GDP
is deflated into real GDP, based on 1995 value, and GRP is also converted into 1995 values via the current price index, which is calculated by the MIT research group led by Professor Polenske. Energy consumption and GDP/GRP data (1995 through 2004) come from the China Energy Statistical Yearbook and China Statistical Yearbook.
Shift-share analysis is a framework to explore energy intensity. Analysts use several different methods, but the Laspeyres method is used extensively (Zhang 2003). Park
(1992) proposes this method, calculating changes in energy consumption with respect to
is interpreted by three components: AEt, = AE., + AE,,, + AEt + R. AE.t is a
change in aggregate production (output effect, the energy consumption of the second year based on the same energy intensity and industrial structure of the base year minus the energy consumption of the base year). AE, represents a change of consumption due to changes in composition of aggregate production (structural effect), and AEi, is the intensity effect, which shows the changes result from the adoption of more efficient technologies and techniques (for detailed formulas about calculating these effects, see Zhang 2003, or Park 1992). R is the residual, which is not equal to zero, and it will grow generally if t increases, which leaves part of the observed change in energy consumption unexplained. This constitutes a shortcoming of the Laspeyres methods and some
scholars, such as Zhang (2003), derive their own equations to eliminate this residual. Therefore, I adopt the method developed by Polenske and Lin (1993). Their method clearly decomposes the energy consumption into three parts, each of which can be calculated and explained easily.
E= eo -O, + [(e, - eo)- O,,] + [(e,, - e,1 )-
O,,]
(1)(constant share) (industrial mix) (efficiency change) where E, is the total energy consumption in year t, O, is the GRP (or GDP for the whole nation) in year t. O, is the GRP for each sector i in year t. eo is the energy intensity for the whole region in the base year, and accordingly, e,, and e,1 are the energy intensity for industry i in the base year and year t.
The constant share indicates the energy consumption under the condition that the energy intensity in year t remains at the same level as that of the base year. The effect of
industrial structure on energy use is illustrated by the industry-mix component. A negative industry mix means that the industrial structure has become less energy intensive compare with that in the base year, and vice versa. Efficiency change is similar to the intensity effect shown by the Laspeyres method, measuring the change of energy efficiency.
If we extend the items on the right-hand side of Equation (1) and add them, the sum is
exactly equal to the item on the left-hand side, which makes no residual to appear in the equation. In other words, the energy intensity can be fully explained by the three effects defined on the right-hand side of the equation. Furthermore, by dividing both sides of Equation (1) byO,, an equation describing the impacts on energy intensity can be obtained.
et eo +X [(e, ,- e,.-0j,] 0, + [(e,, ei,>.0j,]/0, (2)
(constant share) (industrial mix) (efficiency change)
where e, = E,
lot
is the energy intensity for the whole region in year t. e, can besmaller or greater than e. depending on the simultaneous effects from the industry mix and efficiency change. Obviously the combined effect of industry mix and efficiency change determines the level of energy intensity in a given year.
Energy efficiency can be broadly defined as the introduction of new equipment, a new process, and/or new techniques, which can influence the amount of energy consumed per unit of output. A structural change reflects the shift in the industrial composition. Ideally, using a finer industrial classification can tell more about the shift and yield a more reasonable explanation, but data availability remains a challenge. Similar to Polenske and Lin (1993), I use China's classification of six material-production sectors: the Primary
Industry (Farming, Forestry, Animal Husbandry, Fishery & Water Conservancy); Industry; Construction, Transportation, Storage, Postal & Telecommunications Services;
Wholesale, Retail Trade & Catering Service; and The Others. Using this classification is also determined by the data. The energy consumption data for different sectors is provided in the China Energy Statistical Yearbook which designates 7 sectors (the first five are the same as the above. The 6th and 7th sectors are Residential Consumption and
Others, respectively). The GRP data are from the China Statistical Yearbook, which has data about more sectors but only the first five are same as those in the China Energy
Statistical Yearbook. In this context, I adopt the first five sectors plus a sixth "the others"
which includes all the other sectors.
4. Energy-intensity Changes
In this section, I present the results of shift-share analysis both for China and for the three provinces. As explained in Table 1-1, Ningxia Province energy consumption data by sector for 2000, 2001, and 2002 are not available, which leaves the 2000-2003
shift-share analysis blank. For the convenience of reading, I show only the results of the shift-share analysis. Readers can find tables about energy consumption by sector, and GDP/GRP by sector in the Appendix.
Table 1-3 shows the shift-share analysis for China's energy intensity in the past ten years (1995-2004). This country's energy intensity continues to decrease from 1995 to
2001/2002, from 163.25 to 98.3 kg of standard coal equivalent per 100 Yuan. I note that its El shows an increasing trend in 2003 and 2004. In 2003 China's El increases by 6 El units, while in 2004 this increase is accelerated to be 11 El units. Also note that the industrial-mix signs are all positive (except the value for 1998) in these ten years. This indicates that China's industrial structure in these ten years actually increases its energy
intensity. This further might suggest that it is hard for China to reduce its energy intensity through changing its industrial structure. Note that the 1998 industrial-mix value is negative, -0.64. In 1998 China started its "laid off" employment reform by laying off many employees of state-owned companies and closing some old, inefficient, or unprofitable state-owned companies, which had great impacts on China's industrial structure.
Efficiency shift played a role in decreasing energy intensity in most of those years except
2003 and 2004. During this period, changes in the efficiency shift account for the
decrease of energy intensity, while changes in the industrial mix mostly increase the energy intensity of China.
Table 1- 3: Shift-share Analysis of Energy Intensity in China's Material Production Sector
1995 1996 1997 1998 1999 2000 2001 2002 2003 2004 Constant 163.25 160.74 138.44 123.21 115.31 108.54 98.30 98.38 104.35 share Industrial 0.92 2.71 -0.64 0.95 2.39 0.34 0.34 1.10 0.29 mix Efficiency -3.42 -25.02 -14.59 -8.85 -9.16 -10.58 -0.26 4.88 10.77 shift Total El 163.25 160.74 138.44 123.21 115.31 108.54 98.30 98.38 104.35 115.42 Unit: Kilograms of standard coal equivalent per 1,000 Yuan of output
Source: calculated from the related tables in Appendix
In the case of Inner Mongolia, the effect of the efficiency shift is still significantly larger than that of industrial mix. Table 1-4 and Figure 1-2 show these two effects. In the past decade, the El of Inner Mongolia has decreased and then increased, fluctuating about roughly 200 El units. Industrial mix in general does not contribute to energy efficiency except in 1998 and 2000. In contrast, for most years, the efficiency shift is negative, decreasing energy intensity. This effect is noticeable especially in 1996 and 1998. In the early 2000s, the effect of the efficiency shift is relatively minute, and in 2004, this effect actually is positive on energy intensity. Figure 1-2 offers an explicit comparison between these two effects. Regardless of being negative or positive, the efficiency shift always has
a larger influence on the total El than the industrial mix does, which matches the trend at the national level discussed above.
Table 1- 4: Shift-share Analysis of Energy intensity in Inner Mongolia's Material Production Sector 1995 1996 1997 1998 1999 2000 2001 2002 2003 2004 Constant 258.26 204.39 248.58 198.75 197.29 191.16 186.73 181.53 175.84 share Industrial 10.06 6.77 -0.51 3 -2.36 2.06 1.13 1.62 12.50 mix Efficiency -63.93 37.42 -49.32 -4.45 -3.78 -6.50 -6.33 -7.31 32.19 shift Total El 258.26 204.39 248.58 198.75 197.29 191.16 186.73 181.53 175.84 220.53
Unit: Kilograms of standard coal equivalent per 1,000 Yuan of output Source: calculated from the related tables in Appendix
kgce per 1,000 Yuan
60. 40. 20. -20. -40. -60. -80.
n Industrial mix o Efficiency shift Figure 1- 3: Inner Mongolian Industrial Mix and Efficiency Shift Source: Table 1-4
Liaoning shows a constant decrease of energy intensity except in the year 2000, which is slightly higher than the previous year and then returns to a lower level. This indicates that this province has made progress in improving its energy efficiency. Examining the effects of industrial mix and efficiency shift, we can easily find that its efficiency shift has been continuously negative, while the industry mix varies above and below zero. The efficiency-shift trend clearly shows that, Liaoning, in the past ten years, has introduced
new energy technology or other techniques that improve energy efficiency and has made steady energy reductions. Different from Inner Mongolia, Liaoning also makes more
progress in optimizing its industrial structure: in 5 out of the total 9 years the industrial mix is negative. Still, efficiency shift remains a main force in changing energy intensity. From both the table and the figure, we see that generally speaking the efficiency shift has higher values than the industrial mix.
Table 1- 5: Shift-share Analysis of Energy Intensity in Liaoning's Material Production Sector
1995 1996 1997 1998 1999 2000 2001 2002 2003 2004 Constant 276.39 218.62 208.69 167.77 148.65 150.86 140.38 132.56 128.40 share Industrial -6.76 3.72 -5.47 1.32 5.16 -3.09 -1.35 0.50 -2.53 mix Efficiency -51.01 -13.65 -35.44 -20.44 -2.96 -7.39 -6.48 -4.66 -3.01 shift Total El 276.39 218.62 208.69 167.77 148.65 150.86 140.38 132.56 128.40 122.86
Unit: Kilograms of standard coal equivalent per 1,000 Yuan of output Source: calculated from the related tables in Appendix
kgce per 1,000 Yuan 10.-^ 0. -10. -20. -30. -40. -50. -60.
0 Industrial mix 0 Efficiency shift Figure 1- 4: Liaoning's Industrial Mix and Efficiency Shift
Source: Table 1-5
Due to data unavailability, we have only five years' data about shift and mix effects.
Based on these results, we can see first that, as a whole Ningxia Province has increasing
227.7 from 308.2 in 1995, the coming three years actually have increasing energy
intensity. The 1997, 1998, and 1999 El stays basically at the same level (around 240 El units), and then in 2004, it soars to 427.6, almost doubling that of 1996. In addition, the efficiency shift does not stay constant, changing between positive and negative. The years of 1996 and 2004 witness a significant negative efficiency shift compared to other years but meanwhile the industrial mix also presents larger trade-offs, positive effect on energy intensity. To some degree, we can infer that, on the one hand, Ningxia, a relatively undeveloped region in China, has not improved its technology of utilizing energy significantly in the past ten years. On the other hand, its industrial structure still remains energy-intensive. We will explain this in detail in the coming section.
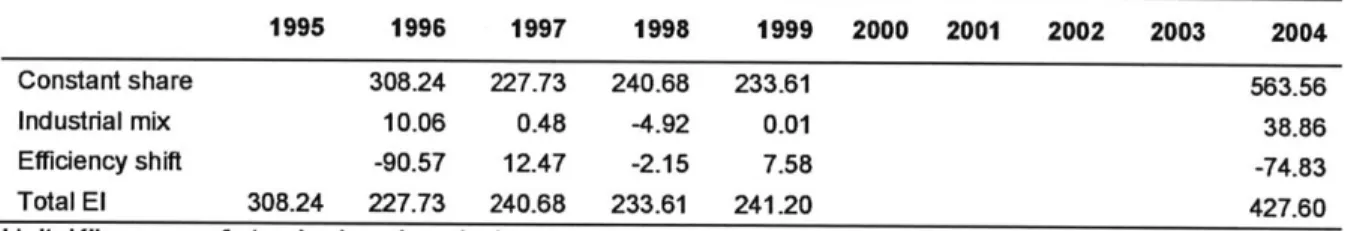
Table 1- 6: Shift-share Analysis of Energy Intensity in Ningxia's Material Production Sector
1995 1996 1997 1998 1999 2000 2001 2002 2003 2004 Constant share 308.24 227.73 240.68 233.61 563.56
Industrial mix 10.06 0.48 -4.92 0.01 38.86
Efficiency shift -90.57 12.47 -2.15 7.58 -74.83 Total El 308.24 227.73 240.68 233.61 241.20 427.60 Unit: Kilograms of standard coal equivalent per 1,000 Yuan of output
Source: calculated from the related tables in Appendix
kgce per 1,000 Yuan
0.
-50.
-100.
-150.
-200.
* Industrial mix 0 Efficiency shift
Figure 1- 5: Ningxia's Industrial Mix and Efficiency Shift
5. Energy investment, efficiency and renewable energy
In the previous section, we find that the energy-efficiency shift is the main factor explaining the change of energy intensity either in China as a whole or in each of the three provinces. As defined, we assume this efficiency effect is triggered by technologyinnovation. In this context, we explore the investment in energy technology in China and
by examining the data from these provinces to understand the situation.
Table 1-7 describes the investment in technology improvements and transformation in the energy industry by region in China. On average, China's investment in technology
has increased steadily in those years, from 0.441 Billion Yuan in 1991 to 3.549 Billion Yuan in 2002, an increase of 700% in 11 years. Compared to this national average, Both
Inner Mongolia and Ningxia have underinvested. Ningxia's input remains roughly at the level of 400 Million Yuan during this period. Its investment in 2002 is only 367 Million Yuan, considering the factor of deflation, lower than that of 1995 which is 353 Million Yuan. Ningxia has experienced a long-term underinvestment in technology updates and transformation in energy industry. This underinvestment naturally cannot contribute to increasing energy efficiency and can cause the efficiency shift to be insignificant in decreasing energy intensity, which might well explain why this province, unlike many peers in China, has an increasing energy-intensity curve in the past ten years. Inner Mongolia, as shown in Figure 1-5, also experiences an underinvestment in this period. Since 1996, its investment has always been less than half of that of the average national level, and we can also find that from 1996 through 2000, Inner Mongolia invests about the same amount for technologies in the energy industry, around 700 Million Yuan (roughly
90 Million US Dollars). We have illustrated that Inner Mongolia's energy intensity
basically has remained constant or only slightly decreased during 1996 through 2003, which can be matched by its investment profile.
Note that Liaoning, in contrast with the other two provinces, in general, has increased the technology investment annually. In 1991, Liaoning invested only 1,160 Million Yuan for the technology innovation in energy industry, but this number tripled to 3.75 Billion Yuan after four years. Then, from 1995, this investment continues to climb and reaches 9.2 Billion Yuan in 2002. The inputs of years around 1998 stay almost the same or only slightly decreased, which might be connected to the 1998 "laid-off" reform when many heavy industries or some other state-owned companies were shut down, which could lead to the non-increase in energy technology investment. Figure 1-5 well illustrates this trend. For each year, Liaoning's investment is more than double that of the provincial average. These large investments benefit Liaoning in decreasing its energy intensity remarkably. As discussed earlier, in 1995 Liaoning's energy intensity was 276.4 units almost double that of the national value (163.4 units), but in 2004, Liaoning had decreased this number to 122.86, very close to the national 115.42 El units. This achievement, although we cannot show it strictly at this stage, can be reasonably attributed to the continuously increasing inputs in energy technology investment by Liaoning.
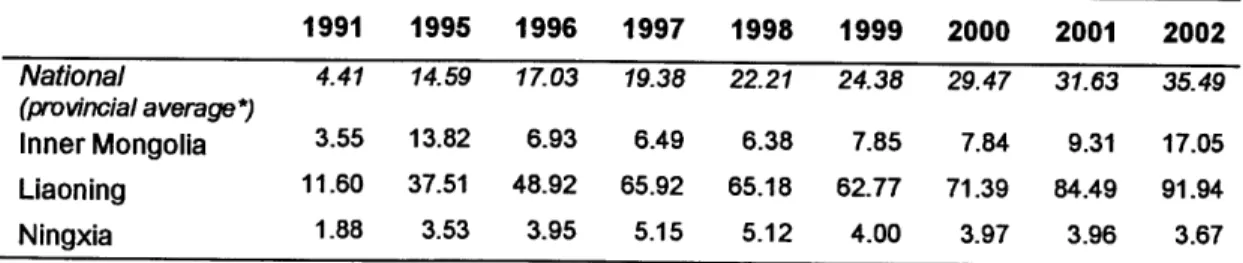
Table 1- 7: Investment in Technical Updates and Transformation in the Energy Industry 1991 1995 1996 1997 1998 1999 2000 2001 2002 National 4.41 14.59 17.03 19.38 22.21 24.38 29.47 31.63 35.49 (provincial average*) Inner Mongolia 3.55 13.82 6.93 6.49 6.38 7.85 7.84 9.31 17.05 Liaoning 11.60 37.51 48.92 65.92 65.18 62.77 71.39 84.49 91.94 Ningxia 1.88 3.53 3.95 5.15 5.12 4.00 3.97 3.96 3.67
Unit: 1 00M Yuan, current price
*: the average of 31 China's provinces and municipalities (not including Hong Kong, Macau and
Taiwan), calculated from the national total divided by 31. Note: 1992/1993/1994, and 2003/2004 data unavailable. Source: China Energy Statistics Yearbook (1992-2005)
100 Million Yuan 100 90 80 70 60 50 40 30 20 10 0 1991 1995 1996 1997 1998 1999 2000 2001 2002
--- National average(proincial level) Inner Mongolia Liao Ning -- Ning Xia Figure 1- 6: Investment in Technical Updates & Transformation in the Energy Industry Source: Table 1-7
However, these investments in the energy industry are not necessarily directed to renewable energy development. Due to China's long push and policy motivation for developing renewable energy, we believe that these provinces, more or less, have some renewable energy industries that might absorb some investment for energy technology innovation and then contribute some to energy efficiency. In the following, I discuss the development of renewable energy in these regions.
Unfortunately, due to the limitation of our data, we cannot analyze in detail the renewable energy development in those three provinces. But we can still give brief description about their status to yield some knowledge.
Ningxia province, given its geographic location, has a good potential for developing the solar industry. Its solar industry development can be dated back to the 1970s with technologies including solar stoves, solar water heaters, solar-powered houses, and household solar PV systems. Yinchuan, the capital of Ningxia, ranks the 3rd, after Lasha and Huhehaote, among all the 31 capital cities in China in terms of solar power potential
capacity. San (2004) shows that the 2003-2010 planning of Ningxia solar power
utilization will bring forth an annual reduction of energy consumption by 432,000 Tonnes of Coal Equivalent (TCE), about 5% of its 2004 coal consumption. However, the
investment in the solar industry is still minimal: up to 2003, government investment for rural energy has accumulatively amounted only to 28 million RMB (about 3.7 Million US Dollars). Although having a relatively long history, the solar industry, the main renewable industry in Ningxia, remains still at an infant stage and its minimal scale prevents it from playing some noticeable role in bringing energy technology innovation or in reducing energy intensity.
Inner Mongolia has the largest wind power potential in China. Up to 2005, the total capacity of wind power was 166,000 kilowatt hours (kwh), the highest in China. However, only 1% of this potential has been developed so far. Up to 2004, there were 158,000 mini wind turbines, which supply 150,000 households with electricity. In 2010, this wind capacity will reach 4,000,000kwh, about 25 times that of 2005. However, even this planned amount, only accounts for 0.0075% of the electricity consumption by Inner Mongolia in 2004, which is 53.6 billion kwh. Similar to Ningxia, Inner Mongolia has a well-developed wind power industry, but it is still too little to decrease energy efficiency. Due to data unavailability in Liaoning province, I cannot discuss more about its renewable energy industry. Renewable energy is less developed compared to the other two
provinces. On the one hand, while the provincial govemment issues some policies or laws, these regulations mainly direct renewable energy development to the rural areas, which indicates that the scale is minimal. On the other hand, things are changing. In Liaoning, energy conservation and developing renewable energy have been on the provincial 11th 5-year planning agenda (Liaoning, 2006).
6. Industrial Structure
To play a role in decreasing energy efficiency, provincial authorities should promote the renewable energy industry much more than they do at present. The minimal scales of renewable energy in the three provinces explain why this industry cannot show the expected effect of improving energy efficiency. In contrast, investments in energy
technology updates and transformation explain to a certain extent why there is difference of energy shift effect among the provinces. We also see that the industry mix usually has a minimal effect in changing energy intensity.
As mentioned before, the coal industries, energy-intensive sectors, are the main force driving the economy of Inner Mongolia and Ningxia, and in Liaoning, the steel industry plays a similar role, which is also an energy-intensive industry. Table 1-8 shows two supporting companies in Inner Mongolia and Ningxia: Shenhua and Ningxia Coal. Each of them is regarded as the main power fueling the GDP growth of its host province. As the economy relies on these energy-intensive industries for growth, it may face intemal challenges of adjusting the industrial structure to a better level for decreasing energy intensity. Such a 'better level is a structure at which companies can produce same outputs with less energy inputs. To understand the scale of such companies, for example, Shenhua Corporation, we can compare it with Peabody, the largest U.S. coal company, which made total revenue of 3.6 billion USD in 2004. Shenhua's 2004 revenue was 56.5 billion Yuan, about 7 billion USD, almost double that of Peabody.
Table 1- 8: Shenhua and Ningxia Coal
Assets Proved Annual coal
Rank Corporation (Billion Yuan) Reserve production Province
(Billion tonnes) (Million tonnes)
1 Shenhua Corporation 188.8 > 223.6 121 Inner Mongolia
8 Ningxia Coal 25.1 24.1 33 Ningxia Corporation
Note: Ningxia Coal Corporation was merged by Shenhua in 2006. Source: Companies' websites
7. Conclusion and Discussion
Through the shift-share analysis, I show that between 1995 and 2004, the energy
efficiency shift plays a main role in changing the energy intensity of China, and three of its provinces, Inner Mongolia, Liaoning and Ningxia. Liaoning province, as a base of heavy industry, still decreases its energy intensity through those years. Inner Mongolia and Ningxia, although having a better developed renewable industry than Liaoning, have experienced flat or climbing curves of energy intensity. Renewable energy development, which is supposed to bring in new energy technology that can decrease energy intensity, has not shown this effect in Inner Mongolia and Ningxia. This can be explained by the minimal scale of this industry in both regions. The investment in the technology updates and transformations in energy industry can in some way explain the effect of efficiency shift in our three study provinces.
However, due to data limitations, I cannot further analyze the status of renewable energy development in China and in particular in these three provinces. This prevents me from examining what exactly renewable energy industry has brought to technology innovation. This remains a problem for future research.
Another puzzle occurs. The fact that the energy-intensive coal industry remains a base industry for both Inner Mongolia and Ningxia seems to explain why they cannot realize an energy-intensity decrease. But Shanxi, the largest coal production province in China, has successfully decreased its energy intensity in the past decades (Polenske 2007). Then why can Shanxi do this decrease while Inner Mongolia and Ningxia cannot? This can also be a question for future research. Both questions call for field trips in China to collect data, interview companies, and government, to find appropriate answers.
Appendix
Note 1.All data come from China Energy Statistics Yearbook 1996-2005, and China
Statistics Yearbook 1996-2005.
Note 2.
Energy consumption data are edited by the author from China Energy Statistics
Yearbook 1996-2005. The total consumption is composed of the following ten
sub-categories and is the sum of these ten after converting into standard coal equivalent via calorific value calculation: coal total, coke, coke oven gas, other gas, other coking products, petroleum products total, natural gas, heat, electricity, and other energy.
These data tables with sub-categories are not attached here but are available upon request from the author.
Note 3. Sectors:
1. Farming,Forestry,Animal Husbandry,Fishery&Water Conservancy
2. Industry
3. Construction
4. Transportation, Storage, Postal, &Telecommunications Services 5. Wholesale, Retail Trade, & Catering Service
6. Residential consumption
7. Others
67. Sum of 6 and 7 to match the classification of GDP/GRP sectors
Table 1. Energy consumption in China's Material Production
equivalent based on calorific value calculation) Sector (10,000 tonnes standard coal
1995 1996 1997 1998 1999 2000 2001 2002 2003 2004 1 3,914.02 4, 124. 2) 4, 080. 69 4,076.28 4,239.55 4,286.98 4331.86 4,593.60 4,75412 5,818.18 2 69,930.63 74, 726 76 E, 823. 12 66,687.8 64,390.11 64,735.67 62,488.43 68,161.68 80, 39& 58 98, 381.39 3 897.41 97& 75 842. 26 1,091.69 1,599.52 1,736.29 1,090.17 1,203.09 1, 316 25 , 741.89 4 5,159.18 5,245.47 6, 550. 96 7249.47 8,325.87 8,977.14 9,128.13 9,909.21 11, 476 24 13,732.18 5 1,472.05 1,690.08 1,630.31 1738.9 1,975.12 1,993.65 2,048.23 2,219.21 2, 612.87 3,08.56 67 16,765.29 19, 160. 07 16,296. 37 14,385.74 14,935.93 15,378.63 15,379.76 16,379. M2 18, 216. 19 20, 452.03 Total 8,138.58 105,925.33 99,223.70 95,230. 06 95,46.10 97,108.36 94,468.58 1C2, 45. 71 118,77425 144, 227.23
Source: SSB&NDRC, multiple years
Table 2. China's Real GDP/GRP (100M RMB, All the figures are in constant 1995 prices)
1995 1996 1997 1998 1999 2000 2001 2002 2003 2004 1 12,328.80 13,438.94 13,678.95 14,356.88 14,599.82 14,628.20 15,219.34 15,962.03 16,591.76 18,960.57 2 25,410.41 28,231.27 31,198.16 32,939.31 35,397.10 39,047.30 41,845.43 45,532.28 51,538.72 57,348.07 3 3,926.55 4,397.88 4,630.43 5,161.11 5,518.92 5,888.00 6,295.78 6,937.51 7,941.81 8,739.00 4 3,140.23 3,391.72 3,654.98 4,065.93 4,499.69 5,408.60 5,893.77 6,358.45 6,519.01 7,024.54 5 5,070.40 5,397.53 5,928.90 6,490.71 6,971.33 7,316.00 7,819.91 8,395.04 8,967.67 9,219.59 67 10,239.09 11,040.08 12,582.32 14,278.64 15,805.47 17,180.00 19,025.31 20,973.77 22,260.62 23,671.30 Total 60,115.49 65,897.42 71,673.74 77,292.58 82,792.34 89,468.10 96,099.53 104,159.08 113,819.60 124,963.08
Table 3. Energy consumption in Inner Mongolia's Material Production Sector (10,000 tonnes standard coal equivalent based on calorific value calculation)
1995 1996 1997 1998 1999 2000 2001 2002 2003 2004 1 87.46 117.64 136.73 120.71 118.13 126.59 154.56 159.42 184.66 216.67 2 1,381.03 1,363.18 1,780.24 1,529.41 1,798.66 1,969.51 2,116.30 2,326.02 2,766.82 3,605.16 3 35.85 46.05 63.97 62.28 53.09 54.82 50.85 57.52 68.69 88.11 4 150.86 154.17 184.36 187.11 137.29 144.16 149.75 164.12 174.14 329.35 5 62.81 89.23 122.86 105.83 100.68 89.29 89.12 93.26 106.39 252.77 67 269.93 341.28 443.20 390.28 326.78 293.79 308.60 322.95 369.79 1,150.06 Total 1,987.95 2,111.54 2,731.36 2,395.63 2,534.62 2,678.16 2,869.18 3,123.29 3,670.48 5,642. 12
Source: SSB&NDRC, multiple years
Table 4. Inner Mongolia's Real GDP/GRP (100M RMB, All data are in constant 1995 prices)
1995 1996 1997 1998 1999 2000 2001 2002 2003 2004 1 235.39 328.17 323.78 345.37 347.37 350.80 356.75 371.71 407.79 477.40 2 232.51 338.36 375.80 403.80 433.90 455.21 503.67 568.74 700.44 958.11 3 63.00 67.94 71.44 80.99 88.26 101.07 119.07 153.81 244.96 298.86 4 60.46 87.52 98.43 107.21 118.16 142.59 161.82 186.59 210.41 229.19 5 54.35 74.62 80.59 96.54 104.33 133.45 147.30 162.82 175.49 191.84 67 124.04 136.49 148.75 171.46 192.67 217.89 247.97 276.86 348.31 403.01 Total 769.75 1,033.11 1,098.79 1,205.37 1,284.69 1,401.01 1,536.57 1,720.53 2,087.40 2,558.41
Source: SSB&NDRC, multiple years
Table 5. Energy consumption in Liaoning's Material Production Sector (10,000 tonnes standard coal equivalent based on calorific value calculation)
1995 1996 1997 1998 1999 2000 2001 2002 2003 2004 1 128.50 147.32 145.53 144.88 148.41 143.18 148.09 145.83 144.75 151.08 2 5,938.14 5,454.32 5,540.41 5,011.22 4,759.76 5,483.66 5,251.18 5,411.11 5,837.28 6,005.13 3 45.86 40.98 68.96 64.79 64.19 65.67 68.13 68.75 73.53 77.91 4 245.12 195.10 304.37 290.10 289.98 442.32 653.91 637.74 594.25 635.94 5 61.41 67.15 49.53 51.00 54.92 58.61 62.95 66.77 69.47 99.96 67 984.55 1,056.68 1,015.11 852.90 877.94 850.21 881.23 985.58 943.30 1,140.78 Total 7,403.59 6,961.56 7,123.91 6,414.89 6,195.21 7,043.64 7,065.49 7,315.78 7,662.58 8,110.80 Source: SSB&NDRC, multiple years
Table 6. Liaoning's Real GDP/GRP (1OOM RMB, All data are in 1995 constant prices)
1995 1996 1997 1998 1999 2000 2001 2002 2003 2004 1 347.05 478.09 474.76 523.50 520.28 503.44 544.44 596.76 612.24 739.57 2 1,207.67 1,390.71 1,533.26 1,639.11 1,793.91 2,114.89 2,190.12 2,357.89 2,542.04 2,721.37 3 162.31 159.95 172.45 188.31 205.56 229.51 250.43 280.99 340.09 428.33 4 174.31 196.20 219.13 267.88 314.17 350.46 394.50 430.14 492.81 588.88 5 312.95 394.55 428.72 525.16 575.20 631.64 696.51 768.72 798.57 860.70 67 474.38 564.84 585.37 679.60 758.39 839.12 957.08 1,084.43 1,182.10 1,263.03 Total 2,678.68 3,184.34 3,413.69 3,823.56 4,167.52 4,669.06 5,033.08 5,518.93 5,967.85 6,601.86 Source: SSB&NDRC, multiple years
Table 7. Energy consumption in Ningxia's Material Production Sector (10,000 tonnes standard coal equivalent based on calorific value calculation)
1995 1996 1997 1998 1999 2000 2001 2002 2003 2004 1 23.64 19.55 21.19 20.06 21.15 * * * 9.83 9.73 2 307.17 321.19 359.34 380.11 428.40 * * * 1,851.69 1,365.95 3 2.65 1.41 3.14 2.83 3.04 * * * 2.68 7.33 4 39.41 31.92 35.72 34.52 27.86 * * * 113.82 37.33 5 0.75 0.68 0.36 5.79 12.46 * * * 15.86 18.58 67 76.40 75.18 79.29 79.06 87.24 * * * 120.51 409.26 Total 450.02 449.93 499.04 522.37 580.15 * * * 2,114.40 1,848.19 *: data unavailable
Source: SSB&NDRC, multiple years
Table 8. Ningxia's Real GDP/GRP (100M RMB, All data are in constant 1995 prices)
1995 1996 1997 1998 1999 2000 2001 2002 2003 2004 1 32.62 44.12 44.06 47.86 47.82 45.95 48.79 52.32 54.04 61.15 2 50.01 69.02 71.94 74.78 80.38 93.00 100.62 113.67 139.53 174.92 3 10.78 12.35 14.22 17.64 21.89 27.04 31.63 36.00 47.41 49.87 4 6.69 11.93 14.09 15.84 17.96 19.31 22.59 25.33 27.11 28.07 5 12.77 17.38 18.17 18.71 20.44 21.60 23.08 25.04 27.22 29.81 67 33.13 42.78 44.87 48.78 52.04 58.67 66.97 73.68 79.88 88.40 Total 146.00 197.57 207.35 223.61 240.52 265.57 293.68 326.05 375.18 432.22 Source: SSB&NDRC, multiple years
References
Bendavid-Val, Avrom. 1991. The 4t' Edition. Regional and Local Economic Analysis for
Practitioners. New York, NY: Praeger Publishers. 67-85.
SSB & NDRC (State Statistical Bureau and National Development and Reform Commission of
P.R. China). China Energy Statistical Yearbook (CESY) 1996-2005 (multiple years). China Statistics Press. Including:
CESY. 1995/1996. CESY. 1997-1999. CESY. 2000-2002. CESY. 2003. CESY. 2004. CESY. 2005.
Fisher-Vanden, Karen, Jefferson Gray H., Liu Hongmei, and Tao Quan. 2004. What is driving China's decline in energy intensity? Resource and Energy Economics 26: 77-97.
Gao, Hu, Zhongying Wang and Yongqiang Zhao. 2005. Renewable Energy Options in improving the life of westem rural poor population in China. Energy Research Institute of National Development and Reform Commission of China.
Garbaccio, R.F., Ho, M.S., Jorgenson, D.W., 1999. Why has the energy-output ratio fallen in China? Energy Journal. 20: 63-91.
Liaoning (Governmental Official Website). 2006. URL: http://www.1n.stats.gov.cn/jrn/gy.htm. Lin, Xinnuan, and Karen R. Polenske. 1995. Input-output anatomy of China's energy use changes
in the 1980s. Economics System Research. 7:67-84.
Ma, Qizhi. 2006. URL: http://www.cctd.com.cn/detaiVO6/01/02/00055780/content.html. Martinot, Eric. 2001 a. Renewable energy investment by the World Bank. Energy Policy. 29:
689-699.
Martinot, Eric. 2001b. World Bank energy projects in China: influences on environmental protection. Energy Policy. 29: 581-594.
Moniz, Emest J., and John Deutch. 2007. The Future of Coal. MIT Laboratory for Energy and the Environment. URL: http://web.mit.edu/coal
North News. 2006. Inner Mongolia ranks NO. 1 in the wind power in China. March 21st 2006. URL: http://www.newenergy.com.cn
NREL (National Renewable Energy Laboratory). 1999. Rneweable energy markets in China: an analysis of renewable energy markets in Guangdong, Jiangxi, Jilin, and Yunnan provinces with updated information from Beijing. URL: http://www.doe.gov/bridge
NREL. 2004a. Renewable Energy Policy in China: Review. URL: http://www.nrel.gov/China NREL. 2004b. China's plan for renewable energy. URL: http/www.nrel.gov/China
NREL. 2006. Developing renewable energy in China. URL: http-//www.nrel.gov/China
PDO (People's Daily Online). 2005. Inner Mongolia to double annual coal output by 2010. URL: http://english.people.com.cn/200512/27/eng2005l227_231175.html.
Polenske, Karen R., and Xinnuan Lin. 1993. Conserving energy to reduce carbon-dioxide emissions in China. Structural Change and Economic Dynamic. 4(2): 249-265.
Polenske, Karen R., and Francis C. McMichael. 2002. A Chinese coke-making processing-flow model for energy and environmental analysis. Energy policy 30: 865-883.
Polenske, Karen R. 2007. Comparative and competitive energy strategies: Brazil and China. MIT SPURS/Humphrey Program Presentation, March 19 2007.
San, Jianren. 2004. The countermeasure analysis and exploration and utilization of solar energy in Ningxia. URL: http://www.newenergy.com.cn/html/2007-1/2007126_13040_1.html