HAL Id: hal-03006796
https://hal.archives-ouvertes.fr/hal-03006796
Submitted on 16 Nov 2020
HAL is a multi-disciplinary open access
archive for the deposit and dissemination of
sci-entific research documents, whether they are
pub-lished or not. The documents may come from
teaching and research institutions in France or
abroad, or from public or private research centers.
L’archive ouverte pluridisciplinaire HAL, est
destinée au dépôt et à la diffusion de documents
scientifiques de niveau recherche, publiés ou non,
émanant des établissements d’enseignement et de
recherche français ou étrangers, des laboratoires
publics ou privés.
to drought
Lauren Gillespie, Nathalie Fromin, Alexandru Milcu, Bruno Buatois, Clovis
Pontoizeau, Stephan Hättenschwiler
To cite this version:
Lauren Gillespie, Nathalie Fromin, Alexandru Milcu, Bruno Buatois, Clovis Pontoizeau, et al.. Higher
tree diversity increases soil microbial resistance to drought. Communications Biology, Nature
Pub-lishing Group, 2020, 3, �10.1038/s42003-020-1112-0�. �hal-03006796�
Higher tree diversity increases soil microbial
resistance to drought
Lauren M. Gillespie
1
✉
, Nathalie Fromin
1
, Alexandru Milcu
1,2
, Bruno Buatois
1
, Clovis Pontoizeau
1
&
Stephan Hättenschwiler
1
Predicted increases in drought frequency and severity may change soil microbial functioning.
Microbial resistance and recovery to drought depend on plant community characteristics,
among other factors, yet how changes in plant diversity modify microbial drought responses
is uncertain. Here, we assessed how repeated drying-rewetting cycles affect soil microbial
functioning and whether tree species diversity modi
fies these effects with a microcosm
experiment using soils from different European forests. Our results show that microbial
aerobic respiration and denitri
fication decline under drought but are similar in single and
mixed tree species forests. However, microbial communities from mixed forests resist
drought better than those from mono-speci
fic forests. This positive tree species mixture
effect is robust across forests differing in environmental conditions and species composition.
Our data show that mixed forests mitigate drought effects on soil microbial processes,
suggesting greater stability of biogeochemical cycling in mixed forests should drought
fre-quency increase in the future.
https://doi.org/10.1038/s42003-020-1112-0
OPEN
1Centre d’Ecologie Fonctionnelle et Evolutive (CEFE), CNRS, UMR 5175, Université de Montpellier, Université Paul Valéry, EPHE, IRD, Montpellier, France. 2Ecotron Européen de Montpellier, CNRS, UPS, 32980 Montferrier-sur-Lez, France. ✉email:lgillespie155@gmail.com
123456789
C
limate change models predict increased drought frequency
and severity in the Americas, southern Europe, southern
and central Africa, Australia, and southeast Asia in the
twenty-first century
1,2, which may have far reaching
con-sequences for ecosystem stability and functioning
3,4. Tree
mor-tality and forest dieback are also projected to increase in
association with climate change induced drought, potentially
leading to decreased forest carbon storage
1. In order to
under-stand how increasing drought affects ecosystems, it is imperative
to understand how soil microbial communities respond to climate
change-induced shifts in soil moisture dynamics, due to their
critical role in ecosystem functioning
5,6. Although soil microbial
communities are regularly exposed to drying-rewetting (DRW)
cycles in most ecosystem types
7, increasing drought duration and
DRW cycle frequency may induce shifts in microbial community
composition, biomass, and activity
8–10, ultimately affecting
bio-geochemical cycling rates
7,11. Changes in biogeochemical cycling
have major impacts on soil carbon dynamics
12, nutrient
avail-ability
5, greenhouse gas
fluxes between soils and the
atmo-sphere
13, and water soluble compounds leaching from the
system
14,15.
Soil microbial resistance (defined as the degree to which
microbial activity changes during a disturbance
16) and recovery
(defined as the degree that the activity recovers after the
dis-turbance
16) are key properties of microbial communities and how
they respond to increasing DRW severity and frequency. These
properties appear tied to soil parameters and resource
availability
17,18. Soil resource availability, particularly carbon (C)
and nitrogen (N) concentrations, determines microbial
commu-nity composition and structure
19and also regulates microbial
ability to produce molecules, such as osmolytes, for protection
against rapid osmotic changes or to recover post-drought
7.
Dis-tinct microbial communities are likely to differ in their responses
to drought and changing DRW cycles. For example,
fungi-dominant communities may better tolerate drought events than
bacteria-dominated microbial communities
20,21. Gaseous C and
N
fluxes (e.g., CO2
and N2O) or dissolved compounds susceptible
to being lost by leaching (e.g., dissolved organic carbon and
dissolved nitrogen) can thus be useful proxies for microbial
activity and potential resource loss changes due to DRW. Soil
properties are heavily influenced by plant community
composi-tion and diversity through root exudacomposi-tion, litter decomposicomposi-tion,
and mycorrhizal associations
5,17,19,22,23. Plant effects on soil
properties can be seen in the soil legacy long after the plant
community had changed or dissapeared
24,25. Root traits of
dif-ferent plant species associated with difdif-ferent resource use
strate-gies (e.g., acquisitive or conservative) can directly influence the
plant–soil microbial interactions through variance in exudate
quality and/or quantity
26due to either dominance effects (mass
ratio theory
27) or varying functional diversity (higher diversity
leading to improved resource partitioning
28). Resource-based
effects on microbial resistance and/or recovery could then act
through increased physiological performance of specific taxa or
through increased microbial diversity, with a higher chance of
more resistant or faster recovering taxa being present in more
diverse communities
29. However, the existing data on plant
diversity effects on the response of soil microbial community to
stresses are nonconclusive
17,19,22,30, particularly regarding effects
of more frequent and/or intense DRW events. Limited evidence
indicates that the higher plant diversity may promote microbial
resistance and resilience to drought
17,31. However, the generality
of these responses beyond site-specific conditions, and the relative
importance of plant functional diversity and of plant trait
dom-inance within a stand compared to the commonly predominant
soil effects, which vary widely among ecosystems, remains
unknown.
In a microcosm experiment with soil from four mature, natural
forests in various soil and climatic conditions (including a total of
13 tree species and 34 different species combinations) along a
latitudinal gradient stretching across Europe (Supplementary
Table 1, Supplementary Fig. 1), we assessed how tree species
mixing (monospecific vs. 3-species mixed stands) affects
micro-bial responses to repeated DRW cycles. Specifically, we asked how
DRW cycles influence soil microbial driven carbon and nitrogen
cycling by measuring aerobic respiration (CO2
fluxes) and
deni-trification (N2O
fluxes when N2
transformation is impeded) and
potential soluble carbon and nitrogen leaching from soils
origi-nating from boreal, temperate, and Mediterranean forests across
Europe, and whether these effects are modified by tree species
mixing. Soil parameters and absorptive root traits, either
calcu-lated as functional diversity or community weighted means (tied
to trait dominance), were also included in analyses as potential
significant factors in microbial responses. We hypothesize that
although DRW cycles have generally negative effects on microbial
functioning, mixed tree species forests mitigate these negative
effects by increasing microbial resistance and/or recovery. Results
showed that CO2
and N2O
fluxes decline under drought but were
similar in soils from single and mixed tree species forests.
However, soil microbial communities from mixed forests resisted
drought better than those from monospecific forests. This positive
tree species mixture effect was robust across forests differing in
environmental conditions and species composition and suggests
potentially more stable biogeochemical cycling in mixed forests
with future climate change induced drought.
Results
CO
2and N
2O
fluxes. CO2
and N2O
fluxes, reflecting microbial
aerobic respiration and denitrification activity respectively, did
not differ between control and DRW treatments at the beginning
of the experiment (Figs.
1
a and
2
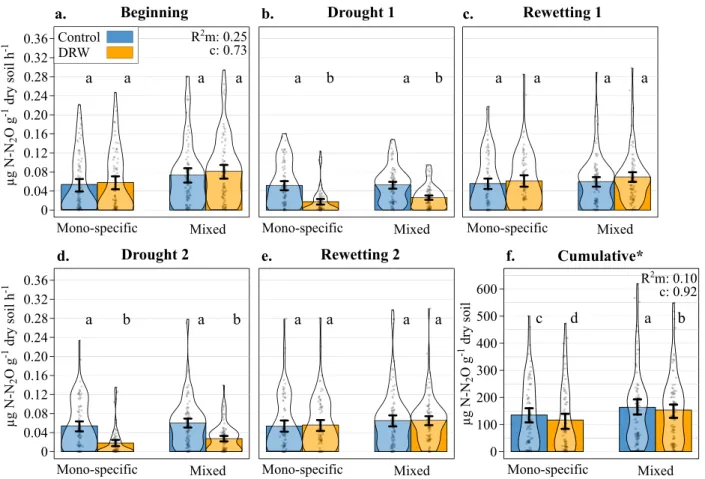
a). Compared to control
con-ditions, the CO2
fluxes were lower following drought (−48% and
−61% on average after the first and second drought, respectively,
Fig.
1
b, d) and higher 7 days after rewetting (+24% and +26%
after the
first and the second rewetting, respectively Fig.
1
c, e) for
both DRW cycles (significant DRW treatment × experimental
period interaction; Table
1
, Fig.
1
). Overall, CO2
fluxes were lower
after the second DRW cycle compared to the
first for both
drought (control:
−15%, DRW: −39%) and rewetting periods
(control:
−37%, DRW: −36%). Tree species number did not
explain CO2
flux variability (Table
1
). In addition to tree species
mixing, trees can leave important footprints in the soil via their
root characteristics (e.g., root chemistry, morphology, and
mycorrhiza), potentially altering exudate quantity and quality.
We considered such root trait effects on gas
fluxes by evaluating
how trait dominance (community weighed mean, CWM) and
functional diversity (functional dispersion, FDis) of a number of
key absorptive root traits (Supplementary Table 2, Supplementary
Fig. 2) influence microbial activity. Indeed, there was a significant
CWM root trait legacy effect on CO2
fluxes, with higher fluxes
associated with more conservative root traits (larger diameter and
higher tissue and length density; Table
1
). When CO2
fluxes were
cumulated over the entire experiment, they were 16% lower in the
DRW treatment compared to the control (Fig.
1
f). The cumulated
CO2
respired from mono-specific stand soils did not differ from
mixed stands irrespective of DRW treatment (Table
1
). There was
the same CWM root trait effect on cumulative CO2
fluxes with
higher cumulative
fluxes with the conservative root traits
men-tioned above (Table
1
, Supplementary Fig. 2).
N2O
fluxes changed similarly in response to drought as CO2
fluxes (Fig.
2
b, d). Compared to control conditions, the N2O
fluxes decreased during drought in both DRW cycles, i.e.,
significant treatment × experimental period interaction (Table
1
).
However, in contrast to CO2
fluxes, the negative drought effect
was equally strong on N2O
fluxes in both cycles (−58% and
−60% on average in the first and second cycle, respectively). In
the
first DRW cycle, soil rewetting also resulted in marginally
significant higher N2O
fluxes compared to the control (+12%),
but this increase was much lower than for CO2
and not present in
the second cycle (Table
1
, Fig.
2
c, e). Whether the soils were from
mixed tree species or monospecific stands did not affect the N2O
fluxes nor their responses to repeated DRW (Table
1
, Fig.
2
).
There were no apparent root trait legacy effects on N2O
fluxes,
but soil parameters had an influence, with higher pH, C, and clay
contents, and lower bulk density associated to higher N2O
fluxes
(Table
1
, Supplementary Fig. 2). The N2O
flux cumulated over
the entire experiment was lower with repeated DRW compared to
control conditions (−10%; Fig.
2
f). Tree species number
significantly changed the cumulative N2O
fluxes depending on
the DRW treatment (significant species number × treatment
interaction; Table
1
, Fig.
2
f), with lower cumulative N2O
fluxes
from mono-specific stand soils (−21%) than from mixed stand
soils after repeated DRW. The same soil parameters identified for
N2O
flux dynamics also positively influenced the cumulative N2O
flux (Table
1
).
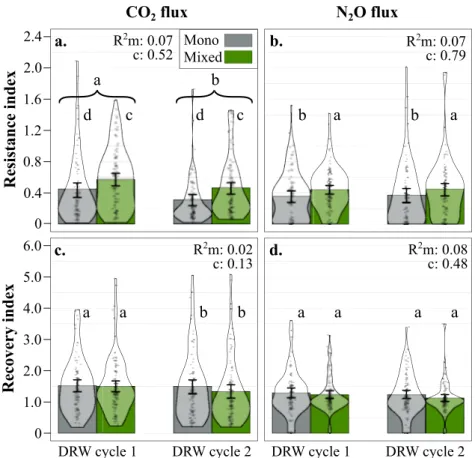
Microbial resistance and recovery. CO2
and N2O
flux resistance
index values ranged from 0.01 to 2.1 unitless (average 0.46) and
from 0.0004 to 2.0 (average 0.41), respectively; zero indicates no
resistance and gas
flux cessation in the drought treatment, 1
indicates identical
fluxes in control and drought treatment, and
>1 indicates higher gas
flux than the control average. Microbial
CO2
flux resistance to drought decreased between DRW cycles
(−21% on average; Table
1
, Fig.
3
a). CO2
flux in soil from mixed
stands showed higher resistance compared to monospecific
stands during both DRW cycles (+28% on average). In addition,
we also observed a negative legacy effect of root trait functional
dispersion (FDis), indicating that CO2
flux resistance was higher
when root functional traits were more similar. N2O
flux resistance
to drought remained constant between the two cycles and was
positively related to tree species number as observed for CO2
fluxes (Table
1
, Fig.
3
b). CO2
and N2O
flux recovery index values
ranged from 0.19 to 5.1 unitless (average 1.47) and from 0.001 to
3.6 (average 1.23), respectively; 0 indicates no gas
flux recovery, 1
indicates 100% recovery in relation to average control values, and
>1 indicates higher gas
flux than the control average. The CO2
flux recovery decreased between DRW cycles (−6%), a decrease
that appears to be primarily in soils from mixed species forests,
but model results did not show neither a significant tree species
number effect nor a tree species number × DRW interaction
(Table
1
, Fig.
3
c). Finally, N2O
flux recovery marginally decreased
between DRW cycles (−1%) and was partly explained by root
trait legacy through root CWM, indicating a positive correlation
with conservative root traits (larger diameter and higher tissue
Beginning
a.
Rewetting 1
Drought 2
Rewetting 2
Cumulative*
0
1
2
3
4
5
6
Control
DRW
µg C-CO
2g
-1dry soil h
-1µg C-CO
2g
-1dry soil h
-1Drought 1
b.
c.
d.
e.
f.
0
1
2
3
4
5
6
a
a
a
a
a
b
a
b
b
a
b
a
a
b
a
b
b
a
b
a
Mono-specific
Mixed
Mono-specific
Mixed
Mono-specific
Mixed
Mono-specific
Mixed
Mono-specific
Mixed
Mono-specific
Mixed
R
2m: 0.33
c: 0.47
µg C-CO
2g
-1dry soil
10,000
2,000
4,000
6,000
8,000
0
a
b
a
b
R
2m: 0.30
c: 0.76
Fig. 1 CO2flux and cumulative fluxes (µg C–CO2g−1dry soil h−1) over thefive key DRW experimental periods (microcosms: n = 90 monospecific ×
DRW,n = 90 mono-specific × control, n = 102 mixed × DRW, n = 102 mixed × control). a Beginning, b drought 1, c rewetting 1, d drought 2, e rewetting 2, andf the cumulative CO2fluxes, for the control (blue) and DRW (yellow) treatments on soil from either mono-specific or 3-species mixed stands. The
most parsimonious modelR2(marginal and conditional), standard error bars, and the significant differences between the control treatment, DRW
treatment, mono-specific stands, and mixed stands at each experimental period, indicated by lower-case letters, are from two GLMMs run on individual CO2flux measurements and on cumulative CO2fluxes. The asterisk indicates a scale and unit change; calculated cumulative values are only rough
and length density), while tree species number had no effect on
N2O
flux recovery (Table
1
, Fig.
3
d).
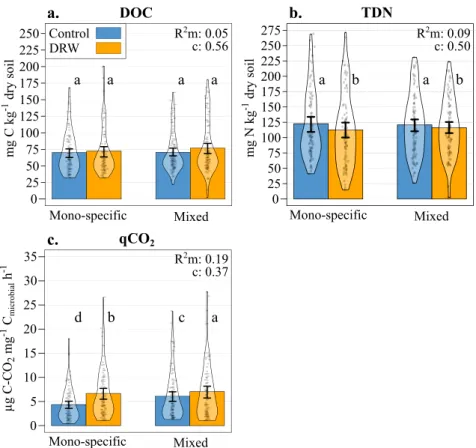
Dissolved organic carbon and total nitrogen. The amount of
DOC extracted from soils at the end of the experiment was not
affected by any of the treatment factors (Table
1
, Fig.
4
a). There
was only a marginally significant soil parameter effect with lower
DOC associated with higher soil pH, C and clay contents, and
lower bulk density. Conversely, somewhat less TDN was
mea-sured in soils subjected to repeated DRW compared to the control
(−6%), but there was neither a tree species number effect nor
a tree species number × DRW interaction (Table
1
, Fig.
4
b). The
same soil parameters that were associated with lower DOC were
also associated to higher TDN values (Supplementary Fig. 2).
Finally, we observed a root CWM effect on TDN, with higher
amounts of TDN associated with more acquisitive root traits
(Table
1
, Supplementary Fig. 2).
Metabolic quotient. The metabolic quotient (qCO2), measured as
the ratio between the basal respiration rate and microbial
bio-mass, is an estimation of microbial stress
32. After two DRW
cycles, basal respiration was higher in DRW treatment soils
compared to control soils but was not affected by tree species
mixing (Supplementary Table 4, Supplementary Fig. 4a).
Micro-bial biomass was not affected by the DRW treatment but was
overall marginally lower in mixed stands compared to
monospecific stands (Supplementary Table 4, Supplementary
Fig. 4b). In turn, qCO2
increased significantly compared to
controls (+24% on average; Table
1
, Fig.
4
c). Although qCO2
was
higher in the DRW treatment for both monospecific and mixed
stands (+34.7% and +13.6% respectively), the DRW effect was
stronger (i.e., qCO2
was higher) in monospecific stands
(sig-nificant tree species number × DRW treatment interaction). Soil
parameters and root CWM had an effect on qCO2, indicating
higher qCO2
values with high bulk density and low pH, C, and
clay contents as well as with acquisitive root traits (higher specific
root length, N content, and ectomycorrhizal colonization
inten-sity; Table
1
, Supplementary Fig. 2).
Discussion
This study examined how drying-rewetting (DRW) cycles
influ-ence soil microbial activity related to C and N cycling in soils
from different mature, natural European forests composed of one
or three tree species. Despite a wide range of soil and forest types,
including 13 tree species and 34 species combinations across four
countries, our results showed a robust association between mixed
tree species forests and higher resistance of soil microbial
respiration (CO2
fluxes) and denitrification (N2O
fluxes) as well
as with lower soil microbial stress levels (qCO2) in response to
repeated DRW cycles, a scenario expected to become more
common with ongoing climate change. However, this effect of
mixed tree species forests did not extent to cumulative gas
fluxes,
µg N-N
2O g
-1dry soil h
-1µg N-N
2O g
-1dry soil h
-1Beginning
a.
Rewetting 1
Drought 2
Rewetting 2
Cumulative*
Drought 1
b.
c.
d.
e.
f.
Mono-specific
Mixed
Mono-specific
Mixed
Mono-specific
Mixed
Mono-specific
Mixed
Mono-specific
Mixed
Mono-specific
Mixed
µg N-N
2O g
-1dry soil
100
200
300
400
500
0
600
Control
DRW
0
0.04
0.08
0.16
0.20
0.24
0.28
0.32
0.12
0.36
0
0.04
0.08
0.16
0.20
0.24
0.28
0.32
0.12
0.36
R
2m: 0.10
c: 0.92
c
d
a
b
a
a
a
a
a
b
a
b
a
a
a
a
R
2m: 0.25
c: 0.73
a
b
a
b
a
a
a
a
Fig. 2 N2Ofluxes (µg N–N2O × g−1dry soil × h−1) over thefive DRW experimental periods (microcosms: n = 90 monospecific × DRW, n = 90
monospecific × control, n = 102 mixed × DRW, n = 102 mixed × control). a Beginning, b drought 1, c rewetting 1, d drought 2, e rewetting 2, and f the cumulative N2Ofluxes, for the control (blue) and DRW (yellow) treatments on soil from either monospecific or 3-species mixed stands. The most
parsimonious modelR2(marginal and conditional), standard error bars, and the significant differences between the control treatment, DRW treatment,
monospecific stands, and mixed stands at each experimental period, indicated by lowercase letters, are from two GLMMs run on individual N2Oflux
measurements and cumulative N2Ofluxes. The asterisk indicates a scale and unit change; calculated cumulative values are only rough estimates because
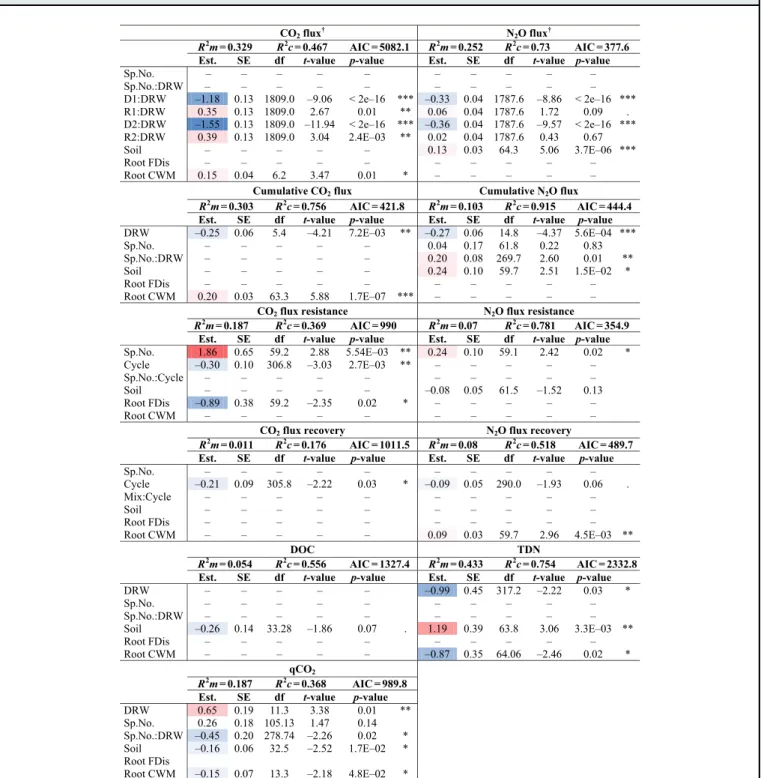
Table 1 The most parsimonious model results:
R
2marginal (
R
2m), and
R
2conditional (
R
2c), estimated slope (Est.), standard error
(SE), degree of freedom (df),
t-value, and p-values for the response variables CO
2and N
2O
fluxes, cumulative CO
2and N
2O
fluxes,
CO
2and N
2O resistance and recovery indices, metabolic quotient (qCO
2), dissolved organic carbon (DOC), and total dissolved
nitrogen (TDN). Red and blue estimate values indicate positive and negative relationships, respectively, and based on estimate
values not signi
ficance. Explanatory variables are abbreviated as: DRW treatment (DRW), tree species number (Sp.No.), tree
species number and DRW treatment interaction (Sp.No.:DRW), at the four DRW stages (drought 1, D1; rewetting 1, R1; drought 2,
D2; rewetting 2, R2), the topsoil properties (Soil), absorptive root functional dispersion (Root FDis), absorptive root community
weighted mean traits (Root CWM), the change between the
first and second DRW cycle (Cycle), and tree species number and cycle
interaction (Sp.No.:Cycle). Dashes indicate explanatory variables not retained in the most parsimonious model,
p-values are coded
as such: 0.1> and <0.05
“.”; 0.05> and <0.01 “*”; 0.01> and <0.001 “**”, 0.001>“***”, variables were sometimes retained but not
signi
ficant. The principle explanatory variables (DRW, D1, R1, D2, and R2) are not shown for the response variables accompanied by
the dagger symbol
“†”, because the main effect outputs of the variables retained in interactions are not interpretable when higher
level interactions are signi
ficant.
CO2 flux † N2O flux † R2 R2 AIC = 5082.1 R2 R2 AIC = 377.6
Est. SE df t-value p-value Est. SE df t-value p-value
Sp.No. – – – – – – – – – – Sp.No.:DRW – – – – – – – – – – D1:DRW –1.18 0.13 1809.0 –9.06 < 2e–16 *** –0.33 0.04 1787.6 –8.86 < 2e–16 *** R1:DRW 0.35 0.13 1809.0 2.67 0.01 ** 0.06 0.04 1787.6 1.72 0.09 . D2:DRW –1.55 0.13 1809.0 –11.94 < 2e–16 *** –0.36 0.04 1787.6 –9.57 < 2e–16 *** R2:DRW 0.39 0.13 1809.0 3.04 2.4E–03 ** 0.02 0.04 1787.6 0.43 0.67 Soil – – – – – 0.13 0.03 64.3 5.06 3.7E–06 *** Root FDis – – – – – – – – – – Root CWM 0.15 0.04 6.2 3.47 0.01 * – – – – –
Cumulative CO2 flux Cumulative N2O flux
R2
R2
AIC = 421.8 R2 R2 AIC = 444.4
Est. SE df t-value p-value Est. SE df t-value p-value
DRW –0.25 0.06 5.4 –4.21 7.2E–03 ** –0.27 0.06 14.8 –4.37 5.6E–04 *** Sp.No. – – – – – 0.04 0.17 61.8 0.22 0.83 Sp.No.:DRW – – – – – 0.20 0.08 269.7 2.60 0.01 ** Soil – – – – – 0.24 0.10 59.7 2.51 1.5E–02 * Root FDis – – – – – – – – – – Root CWM 0.20 0.03 63.3 5.88 1.7E–07 *** – – – – –
CO2 flux resistance N2O flux resistance
R2 R2
AIC = 990 R2 R2
AIC = 354.9
Est. SE df t-value p-value Est. SE df t-value p-value
Sp.No. 1.86 0.65 59.2 2.88 5.54E–03 ** 0.24 0.10 59.1 2.42 0.02 * Cycle –0.30 0.10 306.8 –3.03 2.7E–03 ** – – – – – Sp.No.:Cycle – – – – – – – – – – Soil – – – – – –0.08 0.05 61.5 –1.52 0.13 Root FDis –0.89 0.38 59.2 –2.35 0.02 * – – – – – Root CWM – – – – – – – – – –
CO2 flux recovery N2O flux recovery
R2 R2
AIC = 1011.5 R2 R2
AIC = 489.7
Est. SE df t-value p-value Est. SE df t-value p-value
Sp.No. – – – – – – – – – – Cycle –0.21 0.09 305.8 –2.22 0.03 * –0.09 0.05 290.0 –1.93 0.06 . Mix:Cycle – – – – – – – – – – Soil – – – – – – – – – – Root FDis – – – – – – – – – – Root CWM – – – – – 0.09 0.03 59.7 2.96 4.5E–03 ** DOC TDN R2 R2 AIC = 1327.4 R2 R2 AIC = 2332.8
Est. SE df t-value p-value Est. SE df t-value p-value
DRW – – – – – –0.99 0.45 317.2 –2.22 0.03 * Sp.No. – – – – – – – – – – Sp.No.:DRW – – – – – – – – – – Soil –0.26 0.14 33.28 –1.86 0.07 . 1.19 0.39 63.8 3.06 3.3E–03 ** Root FDis – – – – – – – – – – Root CWM – – – – – –0.87 0.35 64.06 –2.46 0.02 * qCO2 R2 R2 AIC = 989.8
Est. SE df t-value p-value
DRW 0.65 0.19 11.3 3.38 0.01 ** Sp.No. 0.26 0.18 105.13 1.47 0.14 Sp.No.:DRW –0.45 0.20 278.74 –2.26 0.02 * Soil –0.16 0.06 32.5 –2.52 1.7E–02 * Root FDis Root CWM –0.15 0.07 13.3 –2.18 4.8E–02 * m = 0.329 c = 0.467 m = 0.252 c = 0.73 m = 0.303 c = 0.756 m = 0.103 c = 0.915 m = 0.187 c = 0.369 m = 0.07 c = 0.781 m = 0.011 c = 0.176 m = 0.08 c = 0.518 m = 0.054 c = 0.556 m = 0.433 c = 0.754 m = 0.187 c = 0.368
microbial recovery, or potential dissolved carbon or nitrogen
leaching (DOC and TDN).
Consistent with previous
findings
7,33and our hypothesis,
DRW events had a strong effect on microbial activities with a
sharp decline following drought periods for both aerobic
respiration and denitrification that decreased more during the
second cycle for aerobic respiration. This decline is likely due to a
direct drought effect on microbial physiology (reduction of
cel-lular water potential) and on organic substrate diffusion, and
oxygen diffusion in the case of aerobic respiration, that causes a
decline in enzymatic activity
7. Aerobic respiration seven days
following rewetting was much higher than control values, but this
was less pronounced in the second cycle. This, along with the
stronger aerobic respiration decline following the second drought,
could indicate the microbial mortality and/or a shift in the
microbial community composition or physiological strategies
8to
stress-avoidance through declined activity during stress
9. Since
denitrification rates returned to pre-stress levels after rewetting,
there was no indication of a loss in the denitrification taxa group
during drought, instead the microorganisms appear tolerant to
very low soil water potential through decreased activity or
accu-mulation of protective molecules
7.
Lower cumulative aerobic respiration and denitrification for
the DRW compared to the control treatment may suggest that the
decrease in microbial activity during drought periods was not
compensated by the increase in
fluxes following the rewetting
periods, which supports previous
findings
34,35. The lower
cumulative aerobic respiration and denitrification were
poten-tially due to drought length, which impacts how much microbial
processes are reduced
36, and potentially exacerbated by the
rewetting period length
37, which was relatively short in our study
(Supplementary Fig. 3). Moreover, we did not measure the pulse
of aerobic respiration (Birch effect) and denitrification activity
immediately after rewetting
38,39, which could account for a
sub-stantial portion of net gas
fluxes during DRW cycles. Indeed, the
complexity of our experiment and the large number of soil
microcosms included made it impossible to track
flux changes
during drying and rewetting with more frequent or continuous
measurements, thus requiring cautious interpretation of the
cumulative
flux data. Furthermore, shifts in soil microbial gas
fluxes depend on numerous variables (e.g., drought severity,
rewetted soil water content, soil texture and compaction,
sub-strate accumulation, as well as local temperatures)
40, and
microbial responses could shift with successive DRW cycles
7.
Although cumulative CO2
fluxes were not affected by tree species
number, they were affected by root functional traits, specifically
the community weighted mean (CWM) traits of the absorptive
roots (i.e., the lowest three orders of roots) with higher
cumula-tive CO2
fluxes associated with conservative root traits (i.e., roots
with larger diameter and higher tissue and length density). Our
results showed that cumulative denitrification was positively
influenced by mixed stands during DRW; the denitrification rate
was closer, though still lower, to the control rate in the soil from
the mixed stands. Yet, we are unable to extrapolate greenhouse
gas N2O
fluxes from this cumulated value since N2
production
was not measured, the denitrification N2O:N2
ratio is dependent
on soil water content
41, and the caveats associated with the
cumulative values mentioned above.
1.0
2.0
3.0
4.0
0
5.0
CO
2flux
N
2O flux
Resistance index
Recovery index
DRW cycle 1
DRW cycle 2
DRW cycle 1
DRW cycle 2
a.
b.
c.
d.
a
a
a
a
a
a
b
b
R
2m: 0.02
c: 0.13
R
2m: 0.08
c: 0.48
0.8
2.0
0
1.6
1.2
0.4
Mono
Mixed
R
2m: 0.07
c: 0.52
R
2m: 0.07
c: 0.79
b
a
b
a
d
c
d
c
a
b
6.0
2.4
Fig. 3 Aerobic respiration and denitrification resistance and recovery indices. a CO2flux resistance, b N2Oflux resistance, c CO2flux recovery, and d
N2Oflux recovery indices for soils from mono-specific stands (Mono, gray; n = 90 index values for each gas) or 3-species mixed stands (Mixed, green; n =
102 index values for each gas) for each DRW cycle (DRW cycle 1 and DRW cycle 2). The GLMM most parsimonious model results:R2marginal (m) and
The absence of a tree mixture effect on microbial respiration is
in contrast to a recent meta-analysis reporting an overall positive
relationship between plant diversity and microbial respiration
30.
However, we only compared three species mixtures to single
species forests, while the meta-analysis included a larger gradient
in species numbers in multiple ecosystem types and reported
stronger effects with increasing species numbers. On the other
hand, to our knowledge, our study is among the
first to address
this question for well-established (>30 years old) natural forest
communities. A study on a 7-year old planted experimental forest
in Belgium with a one to four tree species richness gradient also
did not
find a significant tree mixing effect on microbial
respiration in response to DRW
42, while another study in the
same forest found that species mixing could influence microbial
community composition through changes in fungal-to-bacterial
growth
43.
Metabolic quotient (qCO2) is an indicator reflecting the energy
requirement for cell maintenance and microbial carbon use, i.e.,
cell activity and resources dedicated to cell maintenance instead
of cell synthesis
32. Higher qCO2
in the DRW treatment suggests
higher microbial stress compared to control treatments, meaning
more energy is spent on microbial maintenance (respiration) than
growth (biomass), and thus potentially indicating the poor
energy-use efficiency
7. Higher stress with DRW could lead to
higher microbial mortality and microbial necromass resulting in
higher C and nutrient loss through leaching over the long term.
After two DRW cycles, microbial biomass was not negatively
affected by DRW (Supplementary Fig. 4), and there was only a
nonsignificant trend for higher potential DOC leaching in the
DRW treatment, while potential TDN leaching was lower
com-pared to the control treatment (Fig.
4
). The smaller difference in
qCO2
between DRW and control conditions observed in mixed
stands compared to monospecific stands indicates that the
microbial community was less affected or stressed by DRW and
more energy efficient in mixed species stands. This is potentially
due to higher nutrient diversity or availability associated with
higher tree diversity
19. A meta-analysis found qCO2
to be
cor-related with soil organic C content
44. Although differences in soil
C concentrations between monospecific and mixed plots in our
study were minimal (Supplementary Table 2), the quality of
organic C could have played a role.
Dissolved organic carbon (DOC) and total dissolved nitrogen
(TDN) are important in C and N sources for soil
microorgan-isms
45, but could be leached from the system leading to reduced
C and N availability for soil microorganisms. Less TDN in soils
subjected to DRW cycles may indicate higher microbial
assim-ilation into biomass or denitrification
39, but overall suggests a
faster exhaustion of soil mineral nitrogen with DRW. If this
pattern remains constant with increased drought frequency and
severity, future soils subjected to DRW cycles may become more
N-limited. This also may be one cause of the increased microbial
stress (qCO2) seen with DRW. In the literature, the effects of
DRW on DOC and TDN soil concentrations and their potential
leaching from the ecosystem are not clear. Previous studies have
found an increase in DOC and TDN with DRW cycles
15,46, no
effect
8,46, or a short-term change but no net effect
47,48. This
discrepancy appears linked to soil type, habitat, and/or drought
frequency
15,46and intensity
44.
25
35
0
5
15
20
µg C-CO
2mg
-1C
microbialh
-1qCO
2Mixed
Mono-specific
R
2m: 0.19
c: 0.37
75
100
50
25
125
150
175
200
225
0
DOC
75
100
50
25
125
150
175
200
225
0
250
275
TDN
mg C kg
-1dry soil
mg N kg
-1dry soil
Mixed
Mono-specific
Mono-specific
Mixed
R
2m: 0.09
c: 0.50
R
2m: 0.05
c: 0.56
a
a
a
a
a
b
a
b
d
b
c
a
c.
a.
b.
Control
DRW
250
30
10
Fig. 4 Microbial stress and dissolved carbon and nitrogen following two DRW cycles. a total dissolved organic carbon (DOC; mg C kg−1dry soil),b total dissolved nitrogen (TDN; mg N kg−1dry soil), andc metabolic quotient (µg C–CO2mg−1microbial C h−1) results for control (blue) and DRW (yellow)
treatments on soil from monospecific or 3-species mixed stands (microcosms: n = 90 monospecific × DRW, n = 90 monospecific × control, n = 102 mixed × DRW,n = 102 mixed × control). The GLMM most parsimonious model results: R2marginal (m) and conditional (c) and significant differences, indicated
As hypothesized, mixed tree species mitigated negative DRW
effects, i.e., both microbial respiration and denitrification
decreased less in soils from mixed compared to monospecific
stands in response to drought. Higher substrate quantity, quality,
or diversity provided by higher tree species number
19,22,23,26could lead to higher microbial diversity and more
drought-resistant taxa
29. In addition, more diverse substrates could
facil-itate the production of protective molecules
9or augment
microbial efficiency
49, thus allowing the microbial community to
maintain higher activity during drought. The lack of tree species
number × cycle interaction for aerobic respiration resistance and
the decrease in resistance after the second cycle indicate that,
while higher tree species number increases drought resistance, it
does not avoid the decrease in resistance in response to repeated
stress. The observed tree mixture effects may also be associated to
a difference in microbial community composition, for example a
higher fungi:bacteria ratio—fungi typically being more drought
resistant
14,50—but this may rather be linked to forest composition
and not species richness per se
51. Regardless of the specific
microbial group, the selection of soil microorganisms more
resistant to repeated drought was likely a reason for lower stress
levels, indicated by qCO2
values, in soils from mixed stands.
Although aerobic respiration resistance was higher in mixed
stands, it also decreased with increasing root trait functional
dispersion (Table
1
). This not only underlines a disconnect
between tree taxonomic diversity and functional diversity but also
could suggest that the importance of tree species number may
outweigh tree functional diversity when considering multiple
forest types, which is contrary to
findings on single forest
types
30,31. We considered the functional dispersion of
morpho-logical and chemical tree absorptive root traits, which do not
necessarily represent all aspects of tree functional diversity. More
functionally diverse root traits should lead to increased
below-ground niche partitioning and better exploitation of soil
resour-ces
28,
which
may
reduce
resource
availability
for
soil
microorganisms. Higher root functional diversity may also dilute
optimum soil resource concentrations (resource concentration
hypothesis) leading to decreased microbial efficiency
52. Both
mechanisms could explain why higher functional root diversity
may diminish microbial resistance to recurrent drought.
Microbial recovery was not affected by tree species number for
neither aerobic respiration nor denitrification, and we did not
observe any correlation between aerobic respiration resistance
and recovery indices, suggesting no trade-off between growth and
stress survival (Supplementary Table 3)
31,53. Denitrification
resistance and recovery indices, on the other hand, were
sig-nificantly correlated but positively, which does not demonstrate a
trade-off either (Supplementary Table 3). These results suggest
that ecosystem functioning may be less affected by drought in
more tree species diverse forests due to microbial communities
that are able to sustain more stable biogeochemical cycling rates
during the drought, but not necessarily after rewetting. However,
it is not known how results may have varied if the experiment had
been conducted in situ, i.e., with the vegetation present, even
though it would be difficult to separate microbial heterotrophic
respiration from autotrophic respiration.
In conclusion, our results show that forest soil microbial driven
C and N processes will likely be influenced by the predicted
increase in drought events, but tree species diversity could help
microbial communities resist better by mitigating negative
drought effects. Microbial communities in more diverse forests
will be better able to remain active and continue C and N cycling
thus potentially better sustaining ecosystem functioning and
stability compared to monospecific forests. Remarkably, these
positive tree mixture effects on microbial resistance under
drought were robust across very different forest types and distinct
soil types over a large geographical distribution. These results
may help to predict the resistance of forest soil microbial
com-munities to DRW as well as how these ecosystems will be
influ-enced by future climatic changes.
Methods
Forest sites and soil sampling. The sites used in this study are part of a per-manent network of existing mature forest plots across Europe established in 2011–2012 (see Baeten et al.54for detailed descriptions). We included four sites
ranging over a large climatic gradient: North Karelia (Finland), Białowieża (Poland), Râşca (Romania), and Colline Metallifere (Italy), which correspond to typical boreal forests, hemiboreal mixed broadleaved-coniferous, montane mixed beech, and Mediterranean thermophilous, respectively (Supplementary Table 1, Supplementary Fig. 1). At each site, we selected 30 m × 30 m forest plots dominated by either one tree species (monospecific stands) or by three co-dominating tree species, hereafter referred to as mixed stands, resulting in a total of 34 species combinations (species were considered co-dominant if they composed >15% of the stand; see Supplementary Datafile 1 for plot and tree species information). Each site differed in total species numbers, species identity, and species combinations (Supplementary Table 1). There were two replicates per tree species for the monospecific plots of each site, except for Picea abies and Quercus robur, which were only replicated once and Betula pendula which had no mono-specific plot in Białowieża. There was a minimum of three mixed species plot replicates per site that were composed of any of the target species present at the site (Supplementary Table 1), i.e., the replicate mixed plots at each site did not necessarily have the same tree species combinations. There were 64 plots in total. The sampling design with the total plot number, their distribution over four forest ecosystems, and including a wide range of tree species is well suited to address the generality of our hypothesis that microbial responses to DRW cycles are modified by tree species mixing but poorly suited to identify site-specific patterns with plot numbers too limiting within specific sites for robust testing.
Within each plot, we selectedfive tree triplets, a triplet being a triangle of three tree individuals within a maximum distance of 8 m from each other and no obstructing tree individuals within the triangle. Each triplet was composed of either the same species in the monospecific stands (monospecific triplet) or the three tree species present in the mixed stands (mixed triplet). At the estimated tree individual size weighted (based on individual diameter at breast height) center within the triangle, we collectedfive soil cores from the topsoil (10 cm deep, 5.3 cm diameter) after the litter layer had been removed. Thefive soil cores were spaced at roughly 35 cm from each other circling the center point (approximate sampled area 50 cm × 50 cm). A depth of 10 cm was selected because it is the standard topsoil sampling depth in soil ecology, has the highest soil microbial activity, and is under the most influence from the plant community19. All soil cores from each sampling
location (i.e., tree triplet) within a plot were then sieved together through a 2 mm sieve and air-dried immediately after sampling for transportation and experiment preparation.
Experimental design. The soils collected from the 64 forest plots at the four sites were split into six replicate microcosms, yielding a total of 384 microcosms that were housed at the Montpellier European Ecotron CNRS in Montpellier, France. Each microcosm contained 95 g dry weight of soil in a glass vial (soil volume 51–72 ml; air volume 259–279 ml), initially incubated at 80% of water holding capacity (WHC) using deionized water, 25 °C, no light, and 40% relative air humidity (the vials were covered with Parafilm®to allow gas exchange but to
prevent soil desiccation) for 3 weeks to reactivate the microbial community (Supplementary Fig. 3). After this acclimation period, half of the microcosms (192, i.e., n= 3 per plot) was assigned to a drying-rewetting (DRW) treatment and the other half (192, i.e., n= 3 per plot) to a control treatment. Maximum microbial mineralization activity appears to be reached between 60% and 80% WHC55. We
chose 80% to ensure soils were entirely and homogeneously humid; very sandy soils with a low WHC, such as those from the Polish site, were not completely wetted at the typically chosen 60% WHC. Each treatment replicate was housed in a 2 m3individual growth chamber (n= 6). Within each chamber, the microcosms
were randomly distributed on a single shelf and re-randomized weekly. The DRW treatment was defined as two DRW cycles while the soils in the control treatment were maintained at 80% WHC throughout the experiment (Supplementary Fig. 3). Water content was adjusted gravimetrically 2–3 times a week.
Due to the large latitudinal distribution and varying soil and climate conditions of the sites (Supplementary Table 1), the soil microbial communities do not necessarily have the same degree of drought history and adaptation56. We therefore applied a
site-specific drought treatment representative of each of the four study sites, i.e., site-specific drought intensity and duration. We used the permanent wilting point as a water stress threshold indicator since there is not a known microbial equivalent. The permanent wilting point was measured using a pressure plate extractor (1500F2, Soilmoisture Equipment Corp., Santa Barbara, USA) at pF 4.2 (15.5 bar) for the plots with the fastest and slowest drying soils of each site. The soil drying speed, i.e., the number of days it took for the soil to dry from 80% WHC down to constant weight, was measured gravimetrically for each plot using a subsample of soil that was subsequently excluded from the experiment. We then averaged the permanent wilting
point values per site and designated this average as the drought intensity: Colline Metallifere 11% H2O g−1dry soil, Râşca 30%, Białowieża 12%, and North Karelia
12%. The beginning of the drought was considered the moment the soil water content arrived at this threshold. The drought duration was calculated using the forest drought history data from Grossiord et al.56as the average annual number of days the
relative extractable water (REW) dropped below 0.2 (unitless) over the 1997–2010 period. REW is the ratio of available soil water to maximum extractable water (i.e., WHC), ranging between thefield capacity (REW 1.0) and the permanent wilting point (REW 0.0)56. Plants are in non-water limited conditions when REW is >0.4 and
water limited when REW is <0.4; we therefore chose a REW threshold of 0.2 to ensure both plant and soil microorganisms were in water-stressed conditions. Drought duration was therefore 38 days for Colline Metallifere, 12 days for Râşca, 8 days for Białowieża, and 0 days for North Karelia per DRW cycle; total experimental drought duration over the two cycles was thus twice that occurring under naturalfield conditions. Although North Karelia soils were never subjected to drought (as defined above) over the 14 years of reference (drought duration: 0 days), we considered the drying period from 80% WHC to the drought intensity threshold (lasting from 7 to 12 days; Supplementary Fig. 3) as an already considerable stress for the microbial community, and the soils were also kept at the drought intensity threshold during the gasflux measurement period (2 days). The microcosms from the remaining three sites were kept at the drought intensity threshold for the site-specific drought duration plus the two days of gasflux measurements. All other environmental conditions simulated in the growth chambers (temperature, humidity, and darkness) remained unchanged for all microcosms during the duration of the experiment.
As a consequence of the site-specific drought duration, as well as different soil drying speeds, the DRW treatments differed in length. In order to ensure the microbial communities were active for the same duration, which better allows analysis of microbial activity from different sites, we staggered the beginning of the first drying-rewetting cycle so that all microcosms finished the two DRW cycle treatment at approximately the same time. We refer to the period between thefirst gas measurement and the beginning of thefirst drying period as the buffer period (Supplementary Fig. 3). Although the buffer period could have led to an exhaustion of some of the readily available resources for microorganisms, comparing the activity of the DRW treatment microcosms to parallel control microcosms following exactly the same dynamics of potential resource exhaustion should have avoided confounding of drought responses with different levels of resource exhaustion. Since it was unfeasible to stagger each microcosm individually, we regrouped the microcosms by site and by soil drying speed (i.e., drying period duration) into eight groups (two groups of plots with more slowly and rapidly drying soils, respectively for each site, Supplementary Fig. 3).
CO2and N2Oflux measurements. Soil microbial respiration and denitrification
activities were estimated by measuring CO2and N2Ofluxes in the microcosms. We
measured the CO2and N2Ofluxes at the end of the 3-week acclimation period
(Supplementary Fig. 3, m0), at the end of thefirst and second drought periods (Supplementary Fig. 3, m1 and m3), and 7 days following the rewetting of the drought exposed microcosms to 80% WHC (Supplementary Fig. 3, m2 and m4). We used this seven day delay to avoid the Birch effect9,38. The second DRW cycle
started immediately after the post-rewettingflux measurement. Flux measurements were done concurrently in both the DRW and control microcosms of the same group.
For the CO2measurements, we sealed the microcosms for 23 h to allow CO2
accumulation, which we then measured using a MicroGC (S-Series, SRA Intruments, Marcy l’Etoile, France). We subsequently replaced the air in the microcosms with 90% helium and 10% acetylene to prevent N2O reduction to N2
(allowing the measurement of denitrified N as N2O), then incubated the
microcosms for another 23-h period to again allow gas accumulation under anaerobic condition. The N2O concentration was then measured using a GC
CP-3800 equipped with an electron capture detector (Varian, Palo Alto, USA). Flux rates were calculated as the amount in µg of CO2or N2O produced per gram of soil
per hour (µg C–CO2or N–N2O h−1g−1dry soil).
Cumulative CO2and N2Oflux and resistance and recovery index calculations.
The cumulative CO2and N2Ofluxes were estimated over the entire experimental
period: we multiplied the CO2and N2Oflux rates, estimates of gas flux at a single
point in time, by the duration of the experimental period preceding that mea-surement (Supplementary Fig. 3; the post-drought meamea-surement by the drought period duration, and the post-rewetting measurement by the rewetting duration). The beginningflux measurement was multiplied by the buffer period (Supple-mentary Fig. 3, m0). Since we did not measure gasfluxes directly after the drying periods (when the soils dried from 80% WHC down to the drought intensity threshold before the start of the drought period), we averaged the gasflux mea-surement before the drying period and the meamea-surement at the end of the drought period and then multiplied it by the drying period duration. We then summed these period cumulativeflux estimates yielding an estimate of the total CO2and
N2Ofluxes during the entire experiment. It is important to note that these are only
rough estimates based on relatively few measurements and ignoring potentially importantfluxes during the Birch effect period. These data should be interpreted cautiously.
We followed Nimmo et al.53for the calculations of indices of resistance and
recovery of microbial activity. Specifically, resistance was calculated by dividing the values of CO2and N2Oflux rates measured in the DRW treatment by those
measured in the control treatment at the end of each drought period
(Supplementary Fig. 3, m1 and m3). Recovery was calculated by dividing the values of CO2and N2Oflux rates measured in the DRW treatment by those measured in
the control treatment at the end of each rewetting period (Supplementary Fig. 3, m2 and m4). Since there were no defined control and DRW treatment microcosm replicate pairs, we divided the results of each individual DRW microcosm replicate by the average of the three control treatment results.
Post-experiment soil analyses. After the end of experiment, the soil microbial biomass was estimated using the substrate-induced-respiration (SIR) method57,58,
which was then used to calculate the metabolic quotient (qCO2) defined as the
C–CO2respired per unit of microbial biomass (ng C–CO2µg−1Cmich−1)32. The
microbial biomass was estimated following Anderson and Domsch58: SIR rate (µl
C–CO2g−1dry soil h−1) × 40.04+ 0.37. The final CO2measurement of the
experiment (Supplementary Fig. 3, m4) was considered a measure of the basal respiration rate. We then divided the basal respiration rate by the estimated microbial biomass to obtain qCO232and converted it to be expressed in ng C–CO2
µg−1Cmich−1.
The potentially leachable C and N were estimated by quantifying soluble organic C (DOC) and total soluble N (TDN) in the soils at the end of the experiment. DOC and TDN were measured using a method adapted from Jones and Willett59with a TOC analyzer equipped with a supplementary module for N
(CSH E200V, Shimadzu, Kyoto, Japan). For the extraction, 30 ml of a 0.025 M K2SO4solution were added to the soil at 70% WHC (wet soil weight equivalent to
10 g dry soil) withfive glass balls and agitated for 30 min at 250 rpm at room temperature. The mixture was then centrifuged for 5 min at 2500 rpm at 4 °C, and the supernatant was passed through a 0.45 µmfilter, which was then analyzed for DOC and TDN (mg C or N kg−1dry soil).
See Supplementary Datafile 1 for mean and standard deviation values for all response variables (i.e., CO2and N2Ofluxes, cumulative fluxes, DOC, TDN, qCO2,
microbial biomass, and resistance and recovery indices) at site, tree species number, and treatment levels.
Statistics and reproducibility. The R software (version 3.5.360) was used for all
statistical analyses andfigures; figures were made using the “pirateplot” function from the YaRrr! Package (version 0.1.561), and the function“fviz_pca_biplot” from
the factoextra package (version 1.0.662), and the ggplot2 package (version 3.2.063).
The map of sampling locations (Supplementary Fig. 1) was created using the QGIS software (version 3.12.3).
Since tree functional characteristics can play a large role in microbial community composition and functioning17,19,23,31, we also calculated the
functional dispersion (FDis64) and the community weighted mean (CWM65) of
absorptive root traits (absorptive roots defined as the first three most distal root orders66) measured from tree roots harvested from one of the soil cores we took for
soil sampling for each individual plot. Soil core samples were kept frozen before roots were separated from mineral particles and other organic matter over a sieve cascade with tap water. Roots were separated by diameter into coarse (>2 mm diameter) andfine roots (≤2 mm in diameter). Fine roots were further separated into tree and understory roots. Treefine roots were further divided into dead (which are hollow, brittle, and dark-colored) and livefine roots, which were then sorted by species (based on distinct color, architecture, morphology, and mycorrhizal types) and subsequently further divided based on their functions into absorptive and transport roots66. Ectomycorrhizal root tips were counted on
absorptive tree roots using a binocular. All absorptive treefine-root samples were scanned with aflat-bed scanner (resolution of 800 dpi) and scans were then analyzed using WinRhizo (Regent Instruments, Quebec, Canada, 2009) to quantify root length, surface area, volume, and diameter. Coarse root samples were also scanned to obtain coarse root volume, which was used together with the stone mass to calculatefine-earth volume (cm−3) of each soil sample. Root samples were dried
(minimum 72 h, 40 °C) and weighed. Carbon and nitrogen concentrations of milled absorptivefine-root samples were measured for samples pooled at the plot level using dry combustion (Elementar Vario El Cube). Absorptive root analysis results are provided in Supplementary Table 2. We chose absorptive root traits rather than the commonly used leaf traits to characterize functional trait characteristics of tree communities, because the majority of soil microorganisms are intimately associated to the rhizosphere and thus root traits67. CWM is a
measure of the relative species abundance weighted trait values. FDis is a measure of the abundance weighted mean distance between the“trait space’ of individual species. Both indices were calculated with the same standard root chemical and morphological traits (Supplementary Table 2) using the R function‘dbFD’ in the FD package (version 1.0-1268). Due to difficulties in differentiating between
Quercus species in root samples from some of the Italian plots, we were unable to determine mean absorptive root trait values at the plot level. We therefore used mean root trait values at the site level calculated from the mono-specific stands. Although the root trait values were not at the plot level, we were still able to determine the CWM and FDis indices at plot level since the root traits values were reported to tree species relative abundance in each plot. The relative abundance of