Characterizing and Improving the Service Level Agreement at Amazon by
Alberto Luna
B.S. Mechanical Engineering, University of Puerto Rico, Mayagiez Campus, 2001 M.S. Mechanical Engineering, The Ohio State University, 2009
Submitted to the MIT Sloan School of Management and the Engineering Systems Division in Partial Fulfillment of the Requirements for the Degrees
of
Master of Business Administration and Master of Science- in Engineering Systems
in conjunction with the Leaders for Global Operations Program at the
Massachusetts Institute of Technology June 2015
C 2015 Alberto Luna. All rights reserved.
ARCHIVES
MASSACHUSETTS INSTITUTEOF TECHNOLOLGY
JUN 2
4
2015
LIBRARIES
The author hereby grants to MIT permission to reproduce and to distribute publiclypaper and electronic copies of this thesis document in whole or in part in any medium now known or hereaftgr created.
Signature of Author
Signature redacted
MIT Engineering Systems Divisioi, MIT Sloan School of Management, May &2015
Signature redacted
Certified by
Certified by
luan Pabl ielma, Thesis Supervisor Richard S. Leghorn (1939) Career D velopment Assistant Professor 4T)Sloan School of Management
Signature redacted
'truce Cameron, Thesis Supervisor Director, System Architecture Lab, and Lecturer, MIT Engineering Systems Division
Accepted by
Signature redacted
Munther A. Dahfeh, William A. Coolidge Professor of Electrical Engineering and Computer Science Chair, Engineering Systems Division Education Committee
d bA
d b
Signature redacted
Maura Hersoi;-'birector of MIT Sloan MBA Program MIT Sloan School of Management Accepte
Characterizing and Improving the Service Level Agreement at Amazon by
Alberto Luna
Submitted to the MIT Sloan School of Management and the MIT Engineering Systems Division on May 8, 2015 in Partial Fulfillment of the Requirements for the Degrees of
Master of Business Administration and Master of Science in Engineering Systems
Abstract
Amazon's Service Level Agreement (SLA) is a promise to its customers that they will receive their orders on time. At the Fulfillment Center (FC) level, the SLA is based on the capability to fulfill open orders scheduled to ship at each departure time. Each center's capability depends on a complex interaction between fluctuating product demand and time-dependent processes. By lowering SLA, Amazon could provide an enhanced the customer experience, especially for same day delivery (SDD). However, providing additional time to the customer also means that the FCs have less time available to fulfill open orders, placing the customer experience of those orders at an increased risk of a missed delivery.
This thesis explores cycle time reductions and throughput adjustments required to reduce the SLA at one of Amazon's Fulfillment Centers. First, a method to analyze
time-dependent cycle time is used to evaluate the individual truck departure times, revealing that the current process conditions have difficulty meeting current demand. Then, using lean principles, process changes are tested to assess their ability to improve the current processes and allow for an SLA reduction. Although a 1% increase in capacity is possible by improving the processes, system constraints make the changes impractical for full implementation. Consequently, a capacity analysis method reveals that an additional capacity of up to 9.38% is needed to improve the current process conditions and meet
current demand. The capacity analysis also reveals that reducing the SLA from its current state requires up to 13.79% more capacity to achieve a 50% reduction in SLA.
Through capacity adjustments, the added cost of late orders is mitigated, resulting in a reduced incidence of orders late to schedule and a reduced risk of missed deliveries. The methods utilized in this thesis are applicable to other Amazon FC's, providing a common capability and capacity analysis to aid in fulfillment operations.
Thesis Supervisor: Juan Pablo Vielma
Title: Richard S. Leghorn (1939) Career Development Assistant, MIT Sloan School of Management
Thesis Supervisor: Bruce Cameron
Title: Director, System Architecture Lab, and Lecturer, MIT Engineering Systems Division
Acknowledgments
I would like to thank everyone at Amazon's Fulfillment Center in Chattanooga, TN for giving me a glimpse into what it means to be an Amazonian. I owe thanks to all the Ambassadors who took the time to train me in the Amazon ways during my first week
and who later provided valuable information and insight to the inner workings of a fulfillment center. I would like to thank the numerous managers at Chattanooga, in particular Travis Duea, who met with me every time I needed to gage my ideas and kept
me on the right track, and to Erik Kurtz, who gave me his time, resources, and guidance to test new setups. Special thanks go to Ben Mullican, one of the best managers I have
ever worked for.
I must also thank and acknowledge the Leaders of Global Operations Program for their support of this work and the opportunity to belong to this amazing and challenging community. Additionally, thank you to my academic advisors, Bruce Cameron and Juan Pablo Vielma, for their guidance and support.
I owe a great debt of gratitude to my fellow LGO, fellow Amazon intern, and friend, Hugh Churchill, whom I used as a sounding board more times than I can remember. Thank you Hugh, for listening to my ideas and helping me figure out which ones made sense. Thank you as well to the rest of my fellow LGOs for making these 2 years of my life a great and adventurous journey.
Finally, I would like to thank my family for their support and guidance throughout my entire life. The values and beliefs that my family has imparted on me have made me into the person I am today, and I would not be here if it were not for them.
Table of Contents
A bstract...2
A cknow ledgm ents ... 3
Table of Contents ... 4
List of Figures ... 6
List of Tables...6
1 Introduction... 7
1.1 Project Motivation: Continuous Improvement at Amazon Fulfillment Centers ... 7
1.2 Problem Statement: Enhancing the Service Level Agreement ... 8
1.3 Project Hypothesis:... 9
1.4 Project Approach ... 9
1.5 Thesis Outline ... 10
2 Operations at Amazon Fulfillment Centers ... 12
2.1 Fulfillm ent Center Operations ... 12
2.2 Outbound Operations... 13
2.2.1 Custom er order flow ... 13
2.2.2 Order Prioritization...17
2.2.3 Orders Late to Schedule... 18
2.3 Chapter Sum m ary... 18
3 Literature Review ... 20
3.1 Process Capacity...20
3.1.1 Process Flow Diagram ... 20
3.1.2 Capacity Calculation and Bottleneck Identification ... 22
3.1.3 Utilization ... 24
3.2 Lean Operations ... 24
3.3 Linear Regression Analysis ... 25
3.3.1 Sim ple Linear Regression [5, Ch. 6]... 26
3.4 Chapter Sum m ary... 27
4 Current State A nalysis... 29
4.1 Cycle Tim e Analysis... 29
4.1.1 Data Collection for the Cycle Time Analysis and Process Improvement Analysis 30 4.1.2 Data Analysis for Average Cycle Times and Standard Deviations ... 31
4.2 Process Im provem ent Analysis ... 37
4.2.1 Process Cycle Tim es at Outbound Operations ... 37
4.2.2 Process Steps at Sorting Areas... 39
4.3 Capacity Analysis ... 43
4.3.1 Data Collection for the Capacity Analysis... 43
4.3.2 Current Capacity Performance at Outbound Operations... 45
5 Future State Analysis... 52
5.1 Process Im provem ent Implem entation Analysis... 52
5.1.1 Process Improvement Implementation Analysis... 53
5.1.2 Process Improvement Limitations... 58
5.2 Capacity to Support Current and Future State ... 59
5.2.1 Capacity for On-Time Orders at Current SLA ... 60
5.2.2 Capacity for On-Time Orders at Reduced SLA... 65
5.3 Chapter Sum m ary... 65
6 Conclusions and Recom m endations ... 67
6.1 Recom m endations for Improving the SLA... 68
6.2 Future Research ... 69
6.3 Chapter Conclusion ... 70
List of Figures
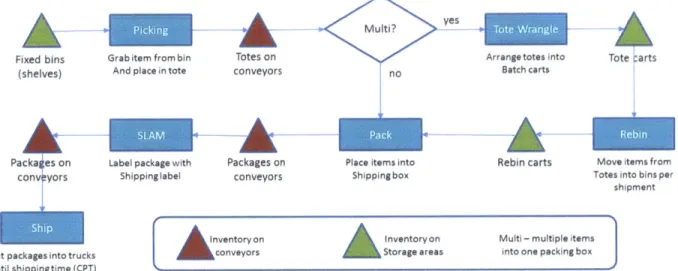
Figure 1. Process map for outbound operations at a fulfillment center...14
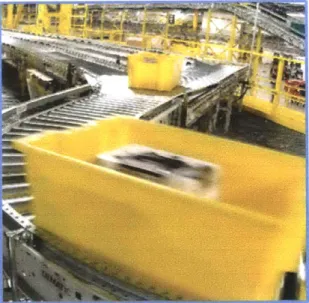
Figure 2. Totes with picked items travelling on the conveyor system...15
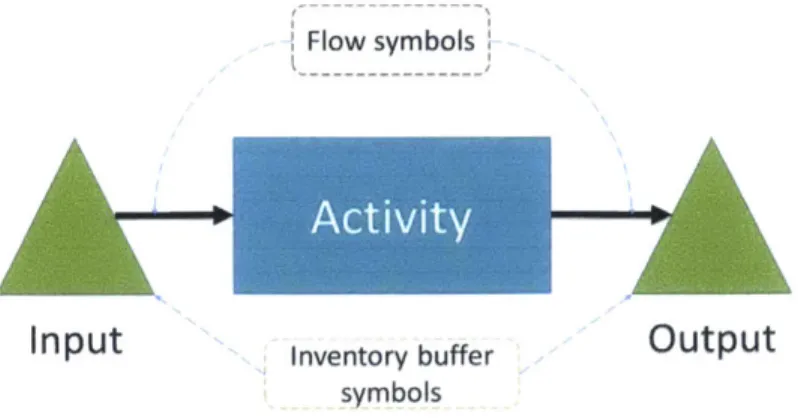
Figure 3. Elem ents of a process flow diagram . ... 21
Figure 4. The three types of process constraints. The thickness of the arrows are proportional to the flow ... 23
Figure 5. Scatter plot of cycle times for each order relative to departure time...32
Figure 6. Boxplot of cycle time as orders approach departure time...33
Figure 7. Average cycle time, standard deviation, and percentile as orders approach departure tim e...34
Figure 8. Outbound operations cycle time per activity in a multis order...38
Figure 9. Schematic of the current layout for tote wrangling (upper area on schematic) and rebin (lower portion of schematic)...42
Figure 10. Average cycle times for single, multi, and all orders...42
Figure 11. Example of incoming demand during the week...46
Figure 12. Daily total number of units for outbound operations over 28 weeks...50
Figure 13. Daily total number of worker hours at outbound operations over 28 w e e k s...5 0 Figure 14. Daily total number of units completed per worker hour...51
Figure 15. Histogram of the normalized units per worker hour (left) and the
Q-Q
plot for the data (right)... 51Figure 16. Schematic of the proposed layout for the tote wrangling and rebin com b in ed op eration ... 53
Figure 17. Plot of cycle time for current sorting operations and proposed process.56 Figure 18. Cumulative percent of late units for each day with late orders...61
Figure 19. Example of incoming orders during the last 24 hours prior to departure tim e u p to S LA ... 6 3 Figure 20. Capacity effect from SLA reduction. ... 66
List of Tables
Table 1. Table illustrating six scheduled departure times for an FC...31 Table 2. Estimates of worker hours relative to conservative, median, and optimisticw o rk er h o u rs...4 8 Table 3. Example of late orders per departure time and day of the week based on
1
Introduction
As an online seller, Amazon constantly works on ways to improve the customer experience for its clients. The subject of this thesis stems from these efforts, focusing on the service level agreement (SLA), Amazon's on-time delivery promise to its customer, as a conduit to a better customer experience. The service level agreement takes the form of the words "Order within 2hr 44min to get it Wed Free" on Amazon's website, and is directly linked to the performance of the Fulfillment Center, Amazon's version of a distribution center, to deliver an order on time. By improving the performance at the fulfillment center, Amazon improves the customer experience for its clients.
This chapter introduces the subject of this thesis: to characterize and improve the service level agreement at Amazon's fulfillment centers. First, it covers the motivation behind improving the service level agreement, followed by the problem to be solved: how to improve the SLA while minimizing the risk of missing a scheduled shipment departure time. Then the hypothesis of this thesis is stated, followed by the approach used to test the hypothesis. The chapter closes by providing the outline for this thesis.
1.1 Project Motivation: Continuous Improvement at Amazon Fulfillment Centers Since its incorporation in 1996, Amazon has grown from an online book seller to a global company offering a multitude of products and services. Amazon offers web services,
manufactures and sells electronic devices, and provides software to develop, publish, and sell content to a client base that ranges from consumers to sellers, and from content creators to enterprises.
Still true to its origins, Amazon remains an online seller, offering millions of unique items to its customers worldwide. At the heart of online retail operations lie Amazon's 96 fulfillment centers (FCs) [1, p. 5], its version of distribution centers, where it stores and ships items
purchased from vendors as well as items offered by third party sellers. Once an order arrives to a fulfillment center, dozens of activities start immediately, and follow a sequence to complete the order accurately and ship it on time so that it arrives at the customer when promised.
Amazon fulfilment centers continuously seek to improve their selection and service, not only to stay ahead of the competition, but also to reinvent 'normal' for its customers. It is in this spirit that Amazon seeks to enhance fast order delivery, especially for its 2"d day, next day, and same day deliveries, while maintaining the highest standard in customer satisfaction.
1.2 Problem Statement: Enhancing the Service Level Agreement
The Service Level Agreement (SLA) is a promise made to the customer about order delivery. At Amazon, this promise takes its form with the words "Order within 2hr 44min to get it Wed Free" on Amazon's website. This promise is tied to the fulfilment center from which the order will ship. The "order within" time given to the customer at the website depends on when the order has to depart the FC to be delivered on the promise date. It takes into consideration how much time it takes the FC to prepare the order and place it on a truck and how much time it takes the order to arrive at the customer from the FC. At the fulfilment center level, thousands of orders have to be ready to ship at each truck departure time to get to their destinations on time. The SLA then becomes an aggregate promise to hundreds to thousands of customers each time a truck leaves the FC.
At Amazon's fulfilment centers, the SLA is a time setting used to stop accepting orders that ship at the upcoming, scheduled truck departure time. The FC stops accepting orders so that
it has enough time to finish processing all the open orders leaving at the next departure time. Each order is assigned a scheduled departure time when the order arrives based on algorithms that look for the lowest delivery costs to Amazon, among other criteria. Except for some delivery options (like same day delivery), if an order is not ready by the scheduled time, it gets upgraded to a new departure time, usually at an added cost absorbed by Amazon. Orders normally have at least one upgrade option in case of a missed scheduled departure time, and the risk of missing the promised delivery date is increased every time the FC misses a departure time.
The problem for Amazon then becomes how to improve the service level agreement, in particular for same day, next day, and 2"d day delivery, while curbing the increased risk of
missing the scheduled departure time.
1.3 Project Hypothesis:
The hypothesis for this project is that reductions in cycle time and process variation through process improvements will allow Amazon to reduce the time setting of its service level agreement and reduce the risk of missing scheduled departure times.
1.4 Project Approach
Reductions cycle time and process variation stem from areas of opportunity in Amazon's FC operations. Identifying these areas of opportunity requires two phases. The approach for this project is segmented into these two phases, plus an additional phase that addresses the case when process improvement is insufficient to reduce the SLA and the risk of missing scheduled
departure times. Due to physical and time constraints, only one fulfillment center is analyzed for this project.
In the first phase, the current process conditions must be well understood to determine the current performance. Amazon's collected data provides the information needed to assess the
current conditions. At this step, the conditions are determined by two parameters: cycle time and volume. By segmenting orders into their respective scheduled departure times, each departure time can be characterized individually. The trends for both cycle times and volumes define the capacity of each departure time, and thus define the current state. Once defined, the current state of the individual scheduled departure times is compared to determine the departure times that can run on a shorter SLA and the ones that cannot.
In the second phase, the scheduled departure times that do not support a shorter SLA provide the opportunities to improve the processes and reduce cycle time. Using lean principles, the activities with the longest cycle times and highest waiting times are the best candidates for process improvements. After performing tests in the selected areas, the resulting cycle time is compared to the current cycle time to assess if the process improvement supports a shorter SLA.
In the case that process improvement alone is insufficient to support a shorter SLA, then the last phase for the project involves adding the labor force to the two parameters from phase 1.
With the labor force in the mix, the analysis needs to determine how many associates are needed to support shorter SLAs.
1.5 Thesis Outline
The next chapter summarizes Amazon Fulfillment Centers and their operations. The chapter reviews the outbound operations, the operations responsible for preparing and shipping orders, in detail. Outbound operations are the operations of interest to this thesis. The chapter describes the customer order flow, order prioritization, and order upgrades.
Chapter 3 contains the literature review for the concepts and methods used in this thesis. It first reviews process capacity analysis used to determine the maximum capacity of a process through the use of process maps, input and output constrains, and utilization analysis.
Afterwards, the seven wastes associated with lean are identified and describes. Lastly, the topic of simple linear regression is described.
Chapter 4 delves into the analysis of each phase described in this chapter. It begins with the data collection and analysis of the current state to determine the cycle time for order completion. After the cycle time analysis of the current state, the chapter describes the selection process for the process improvement activities. The chapter closes with the capacity analysis.
Chapter 5 uses the analysis from Chapter 4 to identify the systems state where the
fulfillment center ships orders on time and utilizes shorter SLAs. It first describes the process changes tested at the fulfillment center to reduce cycle time, followed by discussion about its benefits and limitations. The chapter then digs into the throughput capacity and how many worker hours are needed both for the current SLA and for reduced SLAs.
Chapter 6 summarizes the results of the analyses, and provides recommendations for Amazon's fulfillment centers as well as recommendations for future areas of research and analysis.
2 Operations at Amazon Fulfillment Centers
Amazon's customer orders are prepared and shipped from their fulfillment centers.
Fulfillment centers are divided into two operations, inbound and outbound operations. Of these, outbound operations are responsible for shipping customer orders. Inbound operations receive inventory to fulfill orders, and are outside of the scope of this thesis.
This chapter covers the operations at a fulfillment center's outbound operations, specifically for customer orders. The path followed by all customer orders involves multiple activities, each described in detail. Order prioritization and late orders are also discussed.
2.1 Fulfillment Center Operations
Amazon's fulfilment centers serve two purposes. The first purpose they serve is to prepare and store the millions of items available through Amazon.com. Having these items at hand helps minimize the customer's waiting time to receive their order. The second purpose that the fulfilment centers serve is to prepare and ship orders to their customers and to other
fulfilment centers. These two purposes naturally divide the FC's operations into two sub-business: Inbound and Outbound operations. These two operations are interlaced by the goal to place the customer first and to provide the best prices and the widest selection of items.
Inbound operations are responsible of stocking the millions of items made available to Amazon's customers. Amazon purchases these items from thousands of different vendors and receives them at the FC's dock. From there the items are received, unpacked, inspected for quantity and quality, added to inventory, and then routed to be placed on the hundreds of shelves that hold the FC's inventory. Once the items are placed on the shelves, any online purchases will get matched with the inventory and the outbound operations begin.
Outbound operations are responsible for picking ordered items from the shelves and getting them packed and shipped for delivery. These are the operations of interest for this thesis. The next section goes into the details of the multiple activities for preparing orders.
2.2 Outbound Operations
At Amazon's fulfilment centers, the outbound operations are composed of the activities that prepare and ship all customer and transship orders, plus all support activities. All outbound operations activities share the same resources, namely equipment and associates. Managers continuously monitor incoming, in-process, and outgoing workflow to manage resources and maintain a balanced workflow. When needed, managers activate or deactivate equipment and move associates around, giving them flexibility to match demand.
Outbound operations are segmented into three groups: customer orders, transship orders, and quality control. Customer orders are those placed on Amazon's website by its customers.
Transship orders are requests for items by other fulfillment centers. These requests are necessary when a fulfillment center lacks the inventory needed to complete customer orders. The quality control group supports all outbound operations. They audit inventory levels and location to reduce and correct discrepancies, evaluate performance against process guidelines, implement corrective actions when inventory or process deviations are identified, and analyze customer-facing metrics [2]. Of these three groups, the focus of this thesis is in customer orders.
2.2.1 Customer order flow
When an order arrives at a fulfillment center, it triggers a sequence of decisions and steps based on multiple parameters. Orders get sorted by order type, by item size, and by priority. While the type and size determine where the order gets routed within the FC and how many steps it goes through, while the order priority determines when it gets processed. Although multiple
systems determine an order's priority, one of the main priority factors is the scheduled departure time. Orders that ship sooner are given priority over orders that ship later. Combined with the profile of incoming orders, these three parameters dictate how the orders flow through the fulfillment center.
At the time an order is received at the fulfillment center, the order is categorized and marked as one of two main types. The first order type is singles, which are orders that contain
only one item. The second order type is then orders that contain more than one item, called multis. Orders of the same type are grouped together by computer systems into groups of orders.
Typically, the order items within a group are physically close together from each other to facilitate picking from the shelves.
Multi?
yes-Fixed bins Grab item from bin Totes on Arrange totes into Tote darts (shelves) And place in tote conveyors no Batch carts
-
P-]
i
Packa es on Label package with Packages on Place items into Rebin carts Move items from conv yors Shippinglabel conveyors Shippingbox Totes into bins per
shipment
Put packages into trucks Until shippingtime (CPT)
A
nventory on Inventory on Multi - multiple itemsconveyors Storage areas into one packing box
Figure 1. Process map for outbound operations at a fulfillment center.
Picking is the first activity in the outbound process ('Picking' in Figure 1), and it consists of associates armed with a handheld scanner and a small cart with a tote. The handheld scanner shows the associate where it needs to go in the FC to find the next item to pick. Once at the location, the associate looks in the scanner indicated bin on the shelves and grabs, or picks, the item and places it in the tote. The scanner keeps track of how many items are in a tote, and, once
the tote is full, the scanner relays the information to the computer systems and the associates place the tote in one of the conveyors located throughout the picking area. The conveyor system
at Amazon's fulfillment centers are highly automated, and since the order information is constantly updated, the conveyor system knows where to route the totes from Pick (see Figure 2). Based on order type, the totes are routed to a singles packing area or to a multis sorting area. This point is where the order types go through different activities.
Multis orders have the extra complication of having multiple items spread throughout the fulfilment center that need to come together and
get packed together. At picking, the items from one order may be picked by one picker or by as many pickers as there are items in the order, placing each item in the order into different totes throughout different locations in the FC.
Figure 2. Totes with picked items travelling on
Because the computer systems grouped orders the conveyor system.
of the same type together, they keep track of the totes that contains all the items from the group of orders, which, for multis, are called batches. The conveyor system routes all totes in a batch to the same location, where the next activity takes place. The next activity is called tote wrangling ('Tote Wrangling' in Figure 1), and it consists of associates with handheld scanners pulling totes from the conveyors and placing them on batch carts, effectively regrouping the all the items from all the orders in one batch. Once all totes from a batch are collected, the cart is moved to the next
At this point, a batch cart has numerous items from numerous orders on different totes. The items from the different orders need to be segregated from multiple totes into each individual order. This activity is called rebin, and it consists of an associate at a rebin computer station sorting items from the numerous totes into bins on a cart, hence the activity's name, rebin ('Rebin' in Figure 1). The associate scans each item at the computer station and the computer station indicates the bin to place the item. After all items are processed, each bin on the cart contains all the items from one order. Afterwards the rebin cart is moved to the next activity, packing.
Packing for mutis takes place at a packing station, where an associate moves the items from a rebin cart bin into a packing box ('Packing' in Figure 1). In this activity, the computer system tells the associate which box to use for each order and which order from the rebin cart to pack next. One by one the associate packs all orders from the cart and sends the packed and taped boxes down a conveyor. Each box is identified with a barcode that is scanned prior to placing on the conveyor, updating the computer systems. Packages from multis orders are joined by packages from singles orders on the same conveyor.
Singles packing is different from multis packing in three ways. First, the totes travel straight from picking to the singles packing area without going through tote wrangling and rebin, therefore taking less time between picking and packing than it takes for multis. Second, since
items do not need to be sorted, items from singles orders are packed straight from the tote. And third, because the items are for singles orders, there is only one item per packing box. Packing takes place at packing computer stations where associates pull a tote from the conveyor. One by one, each item of the tote is scanned, and the computer indicates the box to use for packing.
At this point in the process each individual package on the conveyor represents one individual order.
The conveyor moves all packages through an automated system for label application (SLAM in Figure 1). The automated station scans each individual package and applies the
shipping label. From this point on the conveyor system starts routing the packages to different dock stations. Each dock station represents a different shipping company departing at different times. Associates grab packages from the conveyor and place them in the trucks. Thousands of packages may go into each truck, and the associates arrange the boxes to maximize the amount of packages in each truck. Packages accumulate at the trucks until it is time to depart ('Ship' in Figure 1).
2.2.2 Order Prioritization
As mentioned previously, customer orders get sorted by priority, and priority determines when an order gets processed. In general, orders that are scheduled to ship earlier get priority over orders that are scheduled to ship later.
Most prioritization is controlled automatically. Computer systems determine which orders get processed and when they get processed, like the items at pick. Other systems, like at the packing station, let the associates know if an order has priority over another so that it can get packed first. The rest of prioritization requires human intervention. For example, two multis batches start at the same time, get through rebin at the same time, and are in queue for packing. One of the batches has an earlier departure time than the other batch. The next associate that goes fetch a rebin cart will grab the former before the latter. These priority decisions are made
2.2.3 Orders Late to Schedule
Orders that are not completed prior to their scheduled departure time are deemed late. This does not necessarily mean that all late shipments will arrive late to the customer. What it means is that the order missed the lowest cost shipping option available to the FC, and Amazon may have to incur extra shipping costs. It also means that, by missing the original scheduled departure time, the risk of a late customer delivery is higher. The risk increases because the order now has less time to arrive at its destination and fewer shipping options to get there.
When an order misses it scheduled departure time it gets rescheduled to another departure time, and typically at a cost to Amazon. Depending on the shipping option, the order may have
several opportunities to be delivered on time, or it may have only one opportunity. A same day delivery option may have only one departure time available to get to its destination, and missing it would mean arriving late at a customer's address. The scheduled departure time are assigned to take advantage of the lowest-cost, ground transportation option. When scheduled departure times
are missed, the shipping options escalate, and Amazon has to incur additional costs to ship via more expensive options, like air transport.
2.3 Chapter Summary
Customer orders are completed at Amazon fulfillment centers, which are tied to the service level agreement. Each center has inbound operations, responsible for receiving inventory, and outbound operations, responsible for preparing and shipping orders. When they arrive, customer orders are classified into orders of a single item or of multiple items. This classification dictates the path orders follow through the fulfillment center, sending them through picking, sorting, and packing at their respective stations. These activities control how an order gets prepared, while order priority controls when it gets prepared. If an order missed its scheduled departure time,
Amazon provides a new departure time, typically at an increased shipping cost and at an
increased risk of arriving late at the customer's doorstep. Meeting the service level agreement is paramount for Amazon's level of customer experience.
The next chapter summarizes the concepts and methods used to analyze outbound operations.
3 Literature Review
Amazon's service level agreement performance can be analyzed in numerous ways. This chapter discussed the concepts and methods used to analyze a fulfillment center's outbound operations. This chapter first describes process capacity analysis and its three main components: process flow diagrams, bottlenecks, and utilization. Then it gives a brief description of lean and
of the seven wastes that lean seeks to eradicate from operations. Finally, it defines linear regression and identifies the mathematical expressions used in linear regression analysis.
3.1 Process Capacity
Process capacity is the measure which indicates the maximum product that a process can make in a given time period [3, p. 32]. This measure is determined by analyzing the operation in detail, and understanding the activities involved in the production or provision of a good or service. The analysis entails the preparation of a process diagram, the calculation of the capacity for each resource, and identifying the bottleneck. The analysis is limited to the process of
interest, considering its inputs and outputs, and all the steps in between. The analysis of a process can be as simple as one input, one activity, and one output, or as complicated as a whole supply chain.
3.1.1 Process Flow Diagram
A process flow diagram is a graphical representation of the materials, steps, and flow of a process. Process flow diagrams help identify and organize the information needed for the process analysis, and they define the process boundaries, the inputs and outputs, the process activities and their sequence, the flow units, and the buffers that collect inventory.
Flow symbols
Input Inventory buffer Output
symbols
Figure 3. Elements of a process flow diagram.
The process boundaries determine the start and end of the process. The boundary definition
depends on the project and the analysis that needs to be performed. For example, in the
manufacture of turbine airfoils for jet engines there might be multiple manufacturing lines processing different parts. A project that looks at the incoming raw material for all parts would set the boundary as the entire site, while a project looking at the manufacturing capability of one part would set the boundary as the manufacturing line for said part and ignore the rest of the site.
Once the boundary is defined, the process is mapped out with a series of boxes, arrows, and triangles representing the activities, the flows, and the buffers that define the process (see Figure 3). The items that move through the process are called flow units, and they represent the object or information that is moved through the mapped process. The flow units can be the turbine blades in the example above, patients in a hospital, or data packets in a data system. The flow units are transformed by the activities in the process. Activities add value to the flow units and have a limit to how many units can flow through the activity in a given time frame. Buffers, on the other hand, do not add value to the flow unit, and they can accumulate units. Because they can accumulate units, there may be a limit to how many units a buffer can hold. Finally, the flows indicate the progression of units between activities and buffers. Flows can be different
flow units within the process, like an inflow of components into an activity that outputs an assembly.
Process flow maps can be as simple or as complicated as necessary. Their purpose is to help make business decisions based on capacity and performance of a process.
3.1.2 Capacity Calculation and Bottleneck Identification
The capacity of a process is the maximum amount of output that can be produced in a given time frame. Capacity is a flow rate, or the rate at which the flow unit moves through the process in the given time frame. The time frame depends on the desired analysis and can be as short or as long as needed (microseconds or years). If the process has only one activity then the activity limits the capacity of the process. If the process has more than one activity then the activity with the smallest capacity limits the capacity of the entire process. An example of process capacity would be a process able to manufacture a maximum of 200 turbine blades in
one day even in the case when there is ample input and demand. In this example, one of the activities in the process can only process 200 blades per day, with the rest having a higher capacity. As the example suggests, the input or demand could limit the amount of blades
manufactured each day. If the input or demand only allow 100 blades per day to be produced, the process still has the capacity to produce 200 blades per day. This last example illustrates that, aside from capacity, input and demand are flow rates [3, p. 38].
Any one of the three flow rates can limit the output from the process (see
Figure 4). When demand is lower than the available capacity and there is ample input, the process is demand-constrained. This would be the case when 150 blades are needed per day and the manufacturing site would limit production to 150 even though it can make 200 blades per day. When demand exceeds the process output the process is supply-constrained, and in this case
the limiting factor can be either the input or the capacity (input-constrained or
capacity-constrained, respectively). An example of an input-constrain is when the process runs out of raw material and can only produce what the limited raw material allows. On the other hand, when there is enough raw material and demand to produce 250 blades per day, the process is
capacity-constrained because the manufacturing site can only produce 200 blades per day.
Capacity constraints are determined by the activity in the process with the lowest
capacity [3, p. 40]. No matter how much more capacity other activities have, the lowest capacity activity does not allow a higher flow rate through the process. In the turbine blade example, if one activities has a flow rate of 250 blades per day, the maximum output is still 200 blades per day. This lowest capacity activity is known as a bottleneck, analogous to a bottle, where the neck of the bottle only allows a maximum amount of fluid to flow out regardless of how much fluid
Demand
Input
Output
-Inp
DemandInput
Output
DemandInput
Output
Figure 4. The three types of process constraints. The thickness of the arrows are proportional to the flow. The demand-constrained process (top) has enough input material and process capacity, but since demand is lower than the possible output, production is limited to demand. The input-constrained process (middle) has
ample demand, but not enough input to supply the process and meet demand. The capacity-constrained process (bottom) has ample input and demand, but the process cannot output more product due to its
the bottle may hold. Identifying the activity with the lowest capacity is one way to identify the bottleneck of a process.
3.1.3 Utilization
Utilization is the ratio of the amount of output produced to the amount of output that can be produced [3, p. 41]. In other words, it is the ratio of actual output to maximum capacity, and it is always less than or equal to 100%. Going back to the turbine blade example operating at full process capacity of 200 blades per day, the bottleneck process runs at 100% utilization (200 blades per day/200 blades per day), while the second process runs at 80% utilization (200 blades per day/250 blades per day). The activity with the highest utilization is the process's bottleneck.
Another useful definition is implied utilization, which is similar to utilization but with the caveat that it uses the desired amount of output to be produced rather than the actual amount of output produced [3, p. 43]. With implied utilization the ratio can be higher than 100%, which indicates that the process does not have the capacity to meet demand. If the customers wanted 300 blades per day, the implied utilization of the manufacturing process is 150% (300 blades per day/200 blades per day) and 120% (300 blades per day/250 blades per day) for both activities in the process. Like with utilization, the highest implied utilization points to the bottleneck.
3.2 Lean Operations
Lean is a discipline which focuses efforts in eliminating non-value added activities from a process. A value added activity is one that adds value to the good or service as the customer sees it. Examples of value added activities are fastening an assembly together or applying paint to a car. These activities increases the value of the good or service for the customer and their willingness to pay for it. Lean eliminates the activities that do not add value for the customer. Some non-value added activities are moving goods from one location to another or accumulating
items in a buffer. As lean principles are applied, the removal of non-value added activities leads to increased productivity, reduced defects and reduced costs, among other benefits.
Non-value added activities are referred to as wastes, or muda. Different sources list different types of wastes. Typically, there are seven sources of wastes associated with lean [3, p. 226]:
1. Overproduction - producing more output than needed.
2. Waiting - waiting can take two forms: a resource waiting for flow units and flow units waiting for a resource.
3. Transport - moving flow units from one location to another.
4. Overprocessing - spending more time than necessary on a flow unit.
5. Inventory - accumulating flow units without processing them or turning them over to the customer.
6. Rework - processing a flow unit through an activity more than once. 7. Motion - movement associated with performing a task.
By removing wastes, the process will take less time to complete and may add capacity to the operations. Removing wastes may also reduce cost associated with losses from rework and defects.
3.3 Linear Regression Analysis
Regression is the analysis of the relationship between variables. More specifically, regression analyzes how some variables affect other variables. The variables that affect others are called independent, predictor, or regressor variables, while the affected variables are called dependent or response variables [4, p. 373]. Regression analysis is used to model this
predicting how the response variables will behave. In the case of linear regression, the variables follow a linear relationship between themselves.
3.3.1 Simple Linear Regression [5, Ch. 6]
A simple linear regressions is a type of linear regression where there is only one independent and one dependent variable. The linear relationship between the two variables, defined as
yi 0 + f1 * Xi + Ei,
linearly models the independent variable, xi, and its effect on the dependent variable, yi. The other terms in the equation define the y-intercept of the linear equation, Po, the slope,
Pi,
and a random error, Ei. The slope represents the ratio of change between the variables. If the slope iszero then there is no relationship between the two variables.
There are several methods available to calculate the estimates of the slope and the
intercept. Of these methods, the least squares estimation minimizes the sum of the squares of the residuals, where the residuals are the difference between the actual dependent variable and the
predicted dependent variable. The resulting equations for the intercept and slope are bo = - b1*
SSxY
SSxx
where ? is the average for the independent variable values,
y
is the average of the dependent variable values, andn n n SSY = xi *yi - * x yi = i=1= n n 2
ss
= x1 i=1 = /The linear regression equation is complete once the intercept and the slope are calculated. However, the linear regression equation might predict a value that is too different from the actual value. One way to determine if the model is adequate is calculating the coefficient of
determination, commonly known as R2. This coefficient compares the variability explained by
the model to the total variability (which is the variability explained by the model plus the variability that is left unexplained). The model explains the data well when the coefficient is closer to 1. The formula for the coefficient of determination is
R' SSres
SStotai
where
SSres = (i-y
nn 2
SStotai = SSreg + SSres =
7
( Yi)and 9 is the predicted value of the dependent variable. A high coefficient of determination does not necessarily mean that the linear regression is adequate. However, when the plotted data looks linear and the coefficient of variation is close to 1, the model is adequate to accurately predict the dependent variable.
3.4 Chapter Summary
The analysis of Amazon's performance requires the use of the three concepts covered in this chapter. Process capacity for the fulfillment center's outbound operations is critical to understand how many orders the center can process. Lean concepts and the seven wastes aide in the
regression provides the analysis needed to condense hours on information into a handful of variables, facilitating interpretation.
Chapter 4 uses the concepts presented in this chapter to analyze outbound operations. These concepts allow the cycle time analysis, the analysis for process improvement, and the capacity analysis.
4 Current State Analysis
Amazon's priority is to improve the customer experience. In this case, they seek to improve the customer experience by shortening the service level agreement through process
improvement. However, the performance of Amazon's fulfillment centers needs to be evaluated to determine if they meet the customer's expectations with the current SLA. The current SLA needs to be characterized.
The characterization of the current state begins with the analysis of cycle time. The analysis of the cycle time defines the performance of outbound operations and defines the baseline, which is later used for before and after process change comparisons. Once the cycle time and its
baseline are set, a lean analysis of the individual activities and their cycle times aids in
identifying areas of process improvement opportunities. Finally, capacity analysis determines the current throughput capacity which sets the limits to Amazon's shipped units per day. These three analyses pave the way for identifying the future state with a shorter SLA.
4.1 Cycle Time Analysis
There are many metrics maintained by Amazon to describe the performance of the different individual activities within outbound operations and of outbound operations as an integrated system, from unit flow per hour to average cycle times. However, these metrics are an aggregate of all orders averaged over all departure times, rather than orders segmented per individual departure time. Also, the metric that tracks the quantity of late orders only focuses in one day's performance in aggregate. With current metrics, it is unclear beforehand whether an order is more likely to be completed on time than to be completed late, and vice versa. With this in mind, this analysis focuses on identifying a practical way to clearly diagnose how the
4.1.1 Data Collection for the Cycle Time Analysis and Process Improvement Analysis Amazon continuously collects data for all of its outbound operations. Data is transferred daily to Amazon's Data Warehouse for long-term storage and for use by all Amazon employees. In general, the collected data is marked with different tags to indicate the operations and their date and time stamps. With this information cycle times are calculated for the different operations at their different times of the day, of the week, or of the year.
The information extracted from the data warehouse is consolidated into several parameters that are useful to characterize the current state. These parameters help categorize the orders' characteristics on an individual order basis given their assigned departure time:
* Order identification - Each order is assigned a unique number that identifies the order in Amazon's systems.
* Quantity - The number of items in each order is important to determine the order type and the order density (number of items per order).
" Order type - Orders are separated into two main categories: orders that only contain one item (singles), and orders that contain more than one item (multis).
* Cycle time - Using date and time stamps for each order at each step of the process, the cycle time is calculated by subtracting stamps at the beginning of a process from stamps at the end of a process. Cycle times for individual activities and for the overall process (from order receive to order ship) help analyze the system and its parts.
* Time until assigned departure time - Orders are assigned a departure time when they arrive. The time to departure is calculated by subtracting the order's arrival time from its assigned departure time. This parameter illustrates how orders arrive relative to their departure time.
These parameters are pulled from the data warehouse for each departure time on a specific date using Structured Query Language, or SQL. The data is pulled per departure time and per day because it provides a practical way to segment orders and analyze the data. Table 1 illustrates the six departure times used to pull the data. Other alternatives, like pulling data on a per day basis, prove difficult to analyze due to the large volume of orders and transactions recorded in one day.
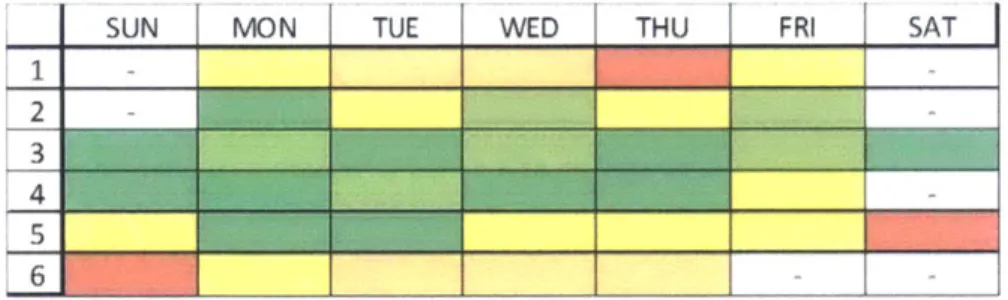
Table 1'. Table illustrating six scheduled departure times for an FC.
The numbers on the left margin identify the individual departure times. The colors indicate the departure times which ship orders on time (green color) escalating towards the departure times that have frequent late shipments (red color). The dashed lines indicates that the departure time is not active on that specific day of
the week.
SUN MON TUE WED THU FRI SAT
2
3
4
6
4.1.2 Data Analysis for Average Cycle Times and Standard Deviations
The scatter plot of order cycle time against the time until departure, depicted in Figure 5,
reveals the trend of decreasing cycle time as the departure time approaches. Orders that arrive farther from their scheduled departure time take longer to complete than orders arriving closer to their scheduled departure time. There is a minimum amount of cycle time required to complete an order, indicated by the gap at the bottom of the plotted data. This minimum time is the fastest time that the FC can fulfill an order. The diagonal gap in the plot indicates one of the work breaks during the shift, like lunch or shift change, where the associates are not working on the lines. The gaps are in different locations of the plot depending on the times of the work breaks
relative to the scheduled departure times. After segregating the data into fractions of an hour to improve the statistical analysis, the box plot of the data shows two key characteristics of the data (see Figure 6). The first one is that even though the spread of cycle time per order occupies almost all the available time, the bulk of the orders' cycle times are concentrated closer to the top of the graph. This indicates that most orders take more time to complete rather than less time, regardless of when they arrive relative to their departure time. The second key characteristic of the data is that the median declines as the departure time approaches.
+
.E
0 , k 0 0
-
Time To Departure +
Figure 5. Scatter plot of cycle times for each order relative to departure time.
Each dot represents the time the order arrived relative to its departure time (x-axis) and the time it took to complete the order (y-axis). Data points to the right of the plot have more time available prior to departure
than data points to the left of the plot. Data points towards the top of the plot have a longer cycle time than the data points towards the bottom of the plot. The diagonal gap indicates a work break during the shift.
The trend in the data suggests a linear relationship of decreasing cycle time as departure time approaches, which is supported by the boxplot in Figure 6. The calculated averages and standard deviations visually exhibit a linear relationship relative to time left to departure, shown
in Figure 7. Linear regression verifies the linear relationship of these two parameters. Visually, the difference between the data points and the regressed line is small, and the coefficient of determination (R2) is higher than 0.99 for both parameters. Therefore, the linear regression is adequate to describe and predict the average cycle time and its standard deviation based on the time to departure.
1 2 3 4 5 6 7 8 9 10 11 12 13 14 15 -Time to departure +
Figure 6. Boxplot of cycle time as orders approach departure time. The x-axis represents the time to departure segmented into fractions of an hour.
The regression analysis of the average cycle time and its standard deviation consolidates the information from all the data points in Figure 5 into four numbers: a slope and an intercept for the average cycle time and its standard deviation. Alternatively, the data points can be expressed graphically in two lines as illustrated in Figure 7. This allows either a visual
comparison of process performance using figures or a numerical comparison using the slopes and intercepts from the regression analysis.
E U
E
...
- Time To Departure +
-Boundary
99.80% -Avg
-StdDev
--0.20%
Figure 7. Average cycle time, standard deviation, and percentile as orders approach departure time.
The solid and dashed lines represent the calculated parameters. The area near the middle of the x-axis where the solid and dashed lines stop indicates the SLA, where the FC stops accepting orders for the current departure time. The dotted lines represent the linear regression. The boundary line splits the on-time orders
from the late orders. Anything above the boundary line is a late order.
In addition to the average cycle time and its standard deviation, the data allows the
calculation and prediction of percentiles. Figure 7 depicts the 0.20 and the 99.80 percentile lines and their regression line. These lines represent the cycle time for completing the 0.020 and the 99.80 of all orders relative to the departure time. This information proves crucial since it establishes a direct measure of how quickly orders can be processed (0.20 percentile) and how many orders are shipped on time per departure time (99.8 percentile). A 0.20 percentile means that 2,000 out of one million orders will be processed at or below the cycle time depicted by the percentile plot. A 99.80 percentile means that 2,000 out of one million orders will be late to their
scheduled departure time. The 0.20 percentile provides an idea of how fast orders can be processed at low volumes. The 99.8 percentile provides a target for dividing a well performing departure time from one that frequently misses scheduled departure times.
The baseline analysis applied on the six departure times shown on Table 1 characterizes the performance of SLA at each departure time for one fulfillment center. The results indicate that:
" Two of the departure times consistently ship orders as scheduled. Figure 7
illustrates one of these departure times. These are represented by departure times 3 and 4 on Table 1. The regression analysis predicts that these departure times are capable of running shorter SLAs than the current SLA. This prediction is supported by two key facts about the departure times. The first is that these two departure times have a volume several times smaller than the other four departure times. The second fact is that these two departure times occur in the same shift as one of the higher volume departure times. This means that they have the same amount of workers and thus the same capacity. If workers within a shift can process the higher volume and occasionally ship orders late to schedule at other departure times, then it is likely that they will be able to process the smaller volume with a shorter SLA at these departure times.
* Two of the departure times occasionally complete some of the orders late with respect to their schedule. These are represented by departure times 2 and 5 on Table 1. The regression analysis suggests that slightly longer SLAs would improve on-schedule shipping. Given that these two departure times are on the fringe between being able to manage the volume and occasionally shipping orders late to schedule, it is unclear if these two departure times could handle a shorter SLA. " The two remaining departure times consistently ship orders late to schedule. These
require significantly longer SLAs for on-schedule shipping. Based on the
performance of these two departure times, they need additional capacity to reduce the incidence of shipping orders late to schedule.
These results indicate that the performance of the current state is not sufficient to meet demand at the current SLA for two out of the six departure times, with an additional two
departure times that occasionally ship orders late to schedule. Consistent late shipments at these departure times are likely due to lack of capacity rather than last minute preparation or
unexpected variability for three reasons. First, prioritization is controlled automatically, with priority increasing as orders get closer to departure time (see Section 2.2.2 for reference) which minimizes last minute preparation. Second, of all the departure times, only departure time 1 gets a high volume of orders within the last few hours prior to departure time (see Figure 19). The high volume at this departure time is consistent week after week, so unexpected variability has little impact on its volume. Lastly, since departure times 1, 2, and 6 are in the same shift (night shift) and have the same capacity, their consistent and occasional late shipments indicates a lack of capacity. This is accentuated by the better performing departure times, 3, 4, and 5, only have occasional orders shipped late to schedule. Without a discernible difference in arrival volume (see Figure 19), it is likely that the day shift is better staffed for demand than the night shift.
The results bring into question whether reducing the SLA is a viable option to improve the customer experience. While orders late to schedule do not mean that they are late for the
customer, decreasing the SLA setting will exacerbate the situation and increase the risk of orders late deliveries at customers' doorsteps. Process improvements must achieve a significant cycle time reduction to consider decreasing the SLA setting.
4.2 Process Improvement Analysis
The process improvement efforts to reduce cycle time and variation start with identifying the process or processes to analyze and modify. With six distinct activities that directly affect cycle time, it is important to apply efforts at the right location to obtain the largest benefit. The analysis of the individual activities, based on lean waste identification, indicates that the sorting area, where tote wrangle and rebin take place for multis orders, provides the largest opportunity for improvement.
This section describes the selection process for the areas of process improvement. 4.2.1 Process Cycle Times at Outbound Operations
Outbound operations consists of four or six activities in sequence that process customer orders from the time of their arrival to the time of their departure. The factor that determines the number of activities is the order type. Singles orders go through four activities while multis orders go through six. Section 2.2.1 describes these activities in detail. Each activity consumes a certain amount of available time, and each activity must be completed prior to starting the next activity. The time each activity takes to complete decreases as orders approach departure time. Figure 8 illustrates the sequence of activities and the relative cycle time differences between the activities for multis orders. The width of the bands are proportional to the length of the activities' cycle time.
The longest cycle time in Figure 8 is the time between applying the shipping label and departing in a truck, which corresponds to the top layer in the figure (thickest layer). However, this activity is where packages get delivered to the dock automatically via conveyors and then get placed into the trucks by associates. Although there is a lot of waiting time involved in this part of the process, it is the end of the outbound processes, and it is irrelevant if a package waits
hours or minutes for the truck to depart. At this point of the process the orders are ready to leave and there are no other value added activities to perform.
* SLAMToShip
+ UPackToSLAM
E
RebinToPack
0
Rebin
PickToRebin
Pick
N
GroupToPick
ArriveToGroup
-Time To Departure
+
Figure 8. Outbound operations cycle time per activity in a multis order.
The second longest cycle time in Figure 8 is the time after pick and up to rebin. At the end of pick, the totes filled with order items are placed in the conveyor system, which delivers them automatically to the right location in the FC to get sorted into batches, then delivered to the rebin queue to wait for an associate to become available so that they can rebin the batch. Although some of the cycle time for this activity is attributed to movement on the conveyor system, it still has a longer cycle time than the next longest activity, rebin to pack, even after compensating for the time spent on the conveyor.
The long cycle time of this portion of the process can be attributed to two conditions of the processes. The first one is that grouping totes into batches strongly depends on the pick activity.
A multis batch has the items from its group of orders spread all over the FC. Different pickers pick the different items at different times, which means that the totes carrying the items are placed in the conveyors at different times and arrive to the sorting station over a period of time. Although the average time to pick all the items in a batch declines as the departure time
approaches, the associates at the sorting area wait a significant amount of time for all the totes from one batch to arrive. To compensate for the time it takes for all totes from a batch to arrive, associates in this area sort through numerous batches in parallel. The second condition that characterizes the long cycle time of the activities between pick and rebin is that once a batch is completed it is transferred to a queuing area. Depending on the time of the day, batches may be snatched from the queue as soon as they become available, or they may wait in queue for an associate to become available. These two characteristics contribute to waste in the form of (a) resources waiting for units and (b) units waiting for resources (see Section 3.2 for details), which makes this section of outbound operations attractive for process improvement.
4.2.2 Process Steps at Sorting Areas
The current state of the sorting area involves a series of activities consisting of tote wrangling and rebin. Section 2.2.1 contains details on the sequence of operations. Figure 9 depicts the schematic for the current layout at the sorting area. The sequence of events for the
current processes is as follows:
1. Totes arrive at conveyor buffer lane where they wait for an associate to process them. Totes from multiple batches arrive at random times, depending on pick activities.
2. An associate scans the tote with a handheld scanner, which tells the associate the buffer number in which to place the tote (see Figure 9 for an illustration of