HAL Id: hal-01343436
https://hal.archives-ouvertes.fr/hal-01343436
Submitted on 1 Apr 2019
HAL is a multi-disciplinary open access
archive for the deposit and dissemination of
sci-entific research documents, whether they are
pub-lished or not. The documents may come from
teaching and research institutions in France or
abroad, or from public or private research centers.
L’archive ouverte pluridisciplinaire HAL, est
destinée au dépôt et à la diffusion de documents
scientifiques de niveau recherche, publiés ou non,
émanant des établissements d’enseignement et de
recherche français ou étrangers, des laboratoires
publics ou privés.
Transmission quality evaluation of Tire Pressure
Monitoring Systems
Mohammed Cheikh, Jean-Guy Tartarin, Jacques David, Sébastien Kessler,
Alexis Morin
To cite this version:
Mohammed Cheikh, Jean-Guy Tartarin, Jacques David, Sébastien Kessler, Alexis Morin.
Trans-mission quality evaluation of Tire Pressure Monitoring Systems.
ITSC 2009 12th International
IEEE Conference on Intelligent Transportation Systems, Oct 2009, Saint-Louis, United States. 5p.,
�10.1109/ITSC.2009.5309712�. �hal-01343436�
Transmission quality evaluation of Tire Pressure
Monitoring Systems
Mohamed Cheikh*, Jean-Guy Tartarin**, Jacques David***, Sébastien Kessler*, Alexis Morin*
*
Continental Automotive France SAS, 1 rue Paul Ourliac, 31036 Toulouse, France**
LAAS Laboratory, Universite de Toulouse, 7 av. Colonel Roche, 31077 Toulouse, France***
LAPLACE Laboratory, Universite de Toulouse, 2 rue Camichel, 31000 Toulouse, FranceAbstract- Many papers dealing with the TPMS (Tire Pressure Monitoring System) communication mechanisms between sensors (transmitters) and receiver have been published, but most of the work has been focused on the particular effects of the radiofrequency channel [1], the antenna design [2], the communication protocol or the mechanical housing. The full transmission context analysis lacks to the understanding of the observed phenomena, in particular the effects of propagation channel on dynamic reception quality for TPMS. In this study, we propose a step by step analysis by evaluating the influence of each element contributing to the overall performance of the communication process. In the first section, an original space sounding is developed to characterize the radiofrequency channel variation. The second part presents simulations in order to improve the burst reception efficiency: the protocol is investigated versus different channel profiles in order to reduce the rate of lost frames.
Keywords-automotive TPM systems; communication protocol; transmission quality; propagation channel.
I. INTRODUCTION
Today more and more vehicles are equipped with the Tire Pressure Monitoring System (TPMS) in the world. Two basic approaches to TPM system have been developed: direct systems measure directly parameters (such as the pressure, the temperature, acceleration….) in the tire cavity; indirect systems work by measuring a loss of pressure that leads to a decrease of the effective radius of the tire [3]. In this paper, we focus only on the direct system.
TPMS is developed to improve the vehicles safety [4]: the control of the tire’s pressure contributes to the reduction of the accident risks caused by under or over inflated tires (9% of serious accidents caused by under/over-inflated tire). Moreover, TPMS also increases the tire lifetime (10% to 20% of tire lifetime) and reduces the fuel consumption (1.5% to 3% of energy saved) by detecting the low pressure variation, and contributes directly to lower CO2 emissions (10 millions tons per year estimated in Europe).
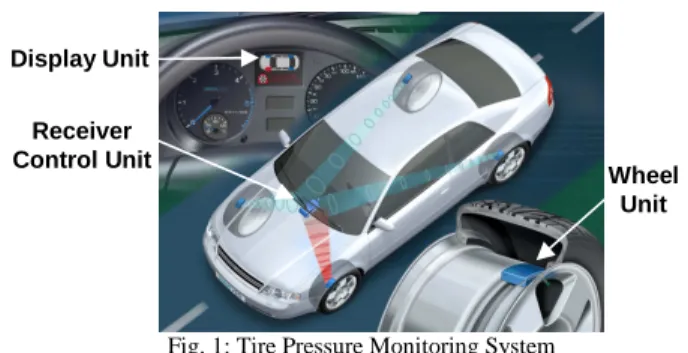
As shown in figure 1 TPM System corresponds to a wireless radiofrequency transmission between a transmitter module (TX) in each tire of the car and a fixed central receiver (RX). The transmitter, next called "Wheel Unit", is composed with different electronic sensors (temperature, pressure, acceleration...) for the detection of the tire inflation status. The data are collected by the receiver where the different wheel unit frames from each tire are decoded
by the control unit. Then a graphical display informs the driver with the pressure and temperature variations.
Fig. 1: Tire Pressure Monitoring System
The paper investigates different parameters of the communication budget to improve the rate of the received unit frames from the tire sensors to the receiver, under hard electromagnetic environments and versus different vehicle speeds. Therefore, it is necessary to characterize and to optimize each major RF design parameter, in order to achieve a reliable frame transmission.
II. CHANNEL PROFILES IN TIRE PRESSURE MONITORING
SYSTEMS
The knowledge and mastery of the propagation channel properties are important to design a TPM System as it allows to determinate the suitable receiver’s location by a full evaluation of the profile of the received signal. We propose an innovating space sounding procedure for the TPMS propagation channel: the field variation of the channel is measured versus space and wheel rotation angle (transmitter configuration). The wave propagation in the particular context of a moving embedded system such as car is penalized by the high wavelength λ=69 cm of the TPMS module. As the complex design of a vehicle involves metallic modules ranging from less than λ/10 to some 10.λ, the situation is relevant to multi-scale electromagnetic problems: the main mechanisms involved in an electromagnetic wave propagation are absorption, reflection, diffraction and scattering by objects (like the body of the car , the passengers, etc.). The emitted waves thus change in phase and power according to the multi-path propagation and produces both destructive and constructive behaviours all along the channel, and particularly at the receiver side. The received field thus varies according to numerous
Receiver Control Unit Display Unit
Wheel Unit
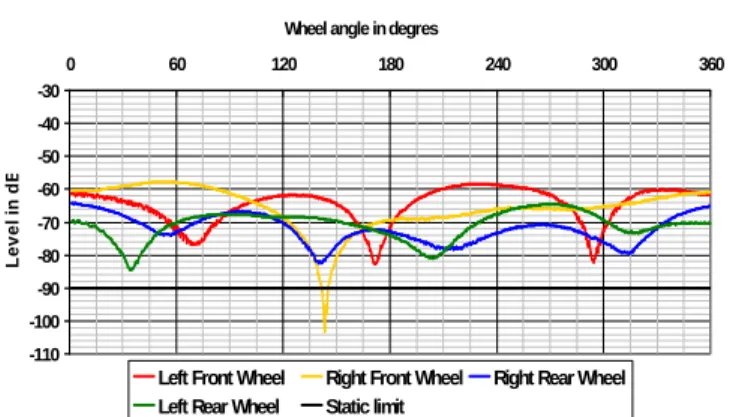
parameters among which the wheel rotation [5]. This power variation, called signature, is unique for each four wheels as shown in figure 2, and repetitive every 360° wheel turn. Some signal fading called “black spots” can be noticed in the variation of the received level: the received power is lower than the sensitivity threshold (fixed at -90 dBm), the signal is corrupted and cannot be interpreted.
-110 -100 -90 -80 -70 -60 -50 -40 -30 0 60 120 180 240 300 360
Wheel angle in degres
L e v e l in d B m
Left Front Wheel Right Front Wheel Right Rear Wheel Left Rear Wheel Static limit
Fig. 2: field variation of TPMS (measured between the sensor in the wheel and the receiver) versus the angle of the wheel.
The measurements are performed at 433,92 MHz, and the characterization setup consists of four main modules:
-Wheel unit: is activated by Low Frequency commands (at 125 kHz); the triggering signal issued from a programmed device, activates the RF signal transmission of the wheel unit and assures a continuous transmission during two minutes. The sensor is composed of a loop antenna and a transmitter generating a maximal power of -24dBm. During this measurement campaign, only the tire sensor located in the right front wheel (featuring a black spot) is sounded. However the procedure is suitable whatever the considered wheel unit.
-Receiver: is moved along a parallel line in eight different positions inside the sounded zone (the shift of the receiver is modulo λ/8). For each receiver location we collect the angular power variation over three turns of wheel. The average gain of the receiver is -15dB (housing package and PCB are included). The receiver computes the RSSI values (Received Signal Strength Indicator).
-Optical components: are used to get an accurate non disturbing field measurement technique. The RSSI collected in each cell is transmitted through an optical fiber system which includes an optical transmitter, a fiber link and an optical receiver.
-Portable PC: collects and processes the data received from the sounded zone.
The measurements are processed with MATLAB. The sounded zone is presented in two dimensions map (figure 3) where the received power is plotted using a scale of colour versus the angular wheel position (y-axis) and versus the space variation (x-axis). The image of the received field in a defined zone inside the vehicle close to the receiver’s expected location (dashboard) helps the understanding of the radiofrequency signal propagation: the angular fading
and the space power distribution data are exploited to model and analyse the probability of reception in the next section.
Fig. 3: radiofrequency channel variation versus the distance and the wheel rotation.
From figure 3, we notice that the received field varies differently in step with the wheel rotation (source Tx) and the location of the receiver (Rx). Moreover, we find some high power level zones (upper than -55dBm) for different angular positions, but the main problem is the channel variation. In the characterized zone the channel attenuation varies from 20dB to 55dB: the 35dB dynamic reception range indicates a high complexity context of the TPMS channel between the sensors and the receiver (reflection and near field effects, radiation pattern profile of the emitting module, …). The size of the cold zones with low power levels (below -80dBm) can originate from different causes, and can also change into “black spots” during the lifetime of the wheel unit (for example when the battery degrades): in the measurement map of figure 3, the angular size of each cold zone (cz1, cz2 and cz3) is about 10°, and the spatial length varies from 10 cm to 20 cm. The goal of this work is not to evidence the accurate origin of these cold zones, clearly related to the angular position of the wheel unit (rotation y-axis) and to the metallic interferences (distance x-axis): this study is next used to dimension the TPMS channel, and adjust internal parameters to model and optimize the rate of the frame’s reception.
III.IMPACT OF THE RF CHANNEL VARIATIONS
In this part, an analytical tool is used to evaluate the reception rate under different environments. From the signatures measured as presented in figure 3, the reception’s situation can be tuned from “no black spot” to “one black spot” (cz1) or “two black spots” (cz2 and cz3) just by shifting by 20 cm the placement of the reception cell. The ‘final’ full evaluation of the TPM System thus needs to investigate on the quality of the reception for several situations featuring different angular sizes and different number of ‘black spots’.
Typical development steps of a TPMS are validated by measuring the rates of successful frames and packet reception versus different speeds of the vehicle to ensure the
cz3 cz2 cz1
reliability of the system. However, this procedure do not allows the evaluation of such a TPMS module versus several parameters (cf. the list below): this empirical characterization would be time consuming and less accurate. The development of a computed analytical representation of the radio-link budget reduces greatly the time of development and also allows to study the influence of numerous parameters: the signature of the measured RF channel is modelled and incorporated in the software where the other main system parameters contributing to the analytical expression of the radio-link are: the frame size, the burst structure, the receiver’s sensitivity, the data rate, the wheel circumference, … All these parameters and signature model are used to compute efficiently and accurately the burst and frame reception rates versus the speed of the vehicle (the speed step is 0.3 km/h).
First, we evaluate the reception probability on the TPMS communication for the following simulation scenario: -Frame length: 100 bits
-Data rate: 9.6 kb/s
-Packet structure: 3 identical frames.
-Inter frames spacing: 110 ms between the first frame and second frame, and 150 ms between the second frame and the third frame.
-Worst receiver sensitivity: -90 dBm. -Wheel circumference: 2 m.
-Speed range simulation: 0 km/h to 250 km/h.
-Communication channel: 1 black spot featuring 5° angle width.
The frame reception rate (without temporal diversity) decreases linearly when the vehicle speed increases. The following equations (1 and 2) are used to model the probability of the frame’s reception according to different protocols and channel parameters:
= D V R F V A . . . 360 ) ( π (1) + − = 360 ) ( 1 . 100 ) (V B AV FP (2) where:
A(V) is the angular frame length in degree, given at speed V.
F is the frame length in bits. R is data rate in bits/second. V is the vehicle speed in meter/s.
D represents the wheel diameter in meter. FP is frame reception probability in percent. B is the black spot size in degree.
Equation (1) explicitly computes the angular coverage of the frame around the wheel (in degree), and is used jointly with the black spot size in equation (2) to compute the frame reception probability (%). The temporal diversity, consisting in sending several frames at different time spacings, improves the reception rate of the data in comparison with previous simulation conditions using a single frame. Temporal diversity has a major influence on
the overall system reliability: making use of several frames allows a large coverage around the wheel. Thus, the ‘black spot’ corrupting one specific angular frame does not affect the second or the third frame.
Equation (3) defines the burst reception rate under dynamic-speed condition using the previously defined protocol: this figure takes account for the intersection between the sent frames. The larger the intersection is, the lower the reception probability.
+ + + − × = 360 . ). 2 1 ( . 360 ) ( . 2 . . 1 . 360 ) ( ) ( 1 100 ) ( D V T T Dec V A D V T Dec V A V A V BR π π I I (3) where:
BR is the burst reception probability (%) given at speed V. T1 is the inter frame separation between first and second frame in ms.
T2 is the inter frame separation between second and third frame in ms.
Dec is the function ‘decimal part of ( )’.
At some particular vehicle speeds, the burst reception probability (with diversity) equals the frame rate: this characteristic occurs when the three transmitted frames of the burst are aligned in the same angular position (cf. figure 4 b). This situation thus corresponds to a single frame transmission case (0% improvement by temporal diversity). For all other situations, the temporal diversity provides up to 60% improvement over the reception probability (essentially at high speeds).
(a) (b)
Fig.4: illustration of the case where the gain of temporal diversity is efficient at 90 km/h (a) and null at 180 km/h (b) (the burst constituted by 3 frames then corresponds to a single frame situation)
The dynamic burst loss is evaluated using the measurement channel variation of figure 3, and with the previous proposed protocol:
In accordance with the theory, we notice from figure 5 that the burst loss increases with the vehicle speed and for unfavourable RF channel profiles (strong attenuation around 30cm). Each parameter contributing to equation (3) is then optimized by a modification of the temporal frame positions to avoid the influence of the “black spots” occurring essentially at very high speed:
Fig.6: dynamic burst loss rate for the optimized protocol
From figure 6, we notice that the optimized protocol avoids the burst loss until speeds of 250km/h, and decreases the average burst loss by about 26%.
The last part of this investigation presents the simulation of the effect of the “black spots” size on the reception rate of a single burst (figure 5.a). The size of the “black spot” varies from 5° to 90°. In the 5° situation, the “black spot” effect only happens at a speed of 180 km/h. In fact, this speed of 180 km/h presents a great degradation of the burst reception rate whatever the black spot size, but the range around this speed widens when the spot is larger, as expected. For the worst situation of 90°, some more speeds present losses of the received bursts: for angles of the black spot upper than 20°, the degradation is sensitive at a speed of 120 km/h, and for angles of more than 45°, the degradation also occurs for a speed of 55 km/h. Some secondary critical speeds can also be noticed with a lower influence (@ 80km/h, 100km/h and 200 km/h).
(a) (b)
Fig.7: Dynamic burst reception rate versus the black spot size (single black spot: a) and versus the inter black spots separation (two black spots: b)
From a large number of channel soundings, the “black spot” rarely exceeds 15° (dotted line in figure 7.a): thus, realistic situations involve less critical speeds than those represented at higher “black spot” sizes. Moreover, the
“black spot” is sensitive to a very narrow range of speed (at 90% of received burst, ∆v=4 km/h).
In some zones of the vehicle, the receiver can be corrupted by two “black spots” for different angular positions on the measured signature: therefore, it is necessary to model the reception rate in this channel configuration for different inter “black spot” spacings. The symmetry of the wheel permits to simulate only half of its circumference: the spot spacing varies from 20° to 180°, and the simulation results are given in figure 7.b. In comparison with figure 7.a (single black spot), numerous deteriorations are observed at lower speeds. From figure 7.b, the worst case is observed for a black spots separation around 180° which contains 11 weighty critical speeds. The symmetry between the two “black spots” increases the area of risk. The best case is obtained at low inter spots separation, less than 40°.
IV.CONCLUSIONS
A new characterization sounding technique has been developed to model the RF channel power variations versus space location at the receiver side, and versus the rotation angle of the transmitter in the wheel. This technique, using optical link, does not disturb the channel signature. A model of the channel signature is developed and integrated in an analytical equation to compute the behaviour of the TPMS communication versus different parameters: this analytical approach based on realistic channel power variation profiles shortens the time of development of such TPM systems. It is thus convenient to optimize each parameter contributing to the communication quality and reliability. From this study, we have quantified how the channel profile influences the degradation of the radiofrequency transmission in TPMS: the use of distortion of the data frames in spite of temporal diversity is evidenced, as well as the influence of the black spot width and spacing, for different speeds of the vehicle. The proposed procedure stands as a powerful tool to fix the strategies of design, and find out the optimal parameters for a reliable TPMS protocol.
REFERENCES
[1] M. Brzeska, J.Pontes, G.-A. Chakam, W.Wiesbeck "RF Design Characterization and Modeling of Tire Pressure Sensors" IEEE Antennas and Propagation, 2007, The Second European Conference on Volume, Issue, 11-16 Nov. 2007 Page(s):1 - 5.
[2] E.Hirose, N.Tenma, N.Michishita and Y.Yamada "Radiated Waves from a Transmitter contained in a Vehicle Tire", Antennas and Propagation Society International Symposium 2006, IEEE Volume, Issue, 9-14 July 2006 Page(s): 2369 – 2372
[3] M.Fischer "Tire Pressure Monitoring, design and functionality of direct measuring systems", Siemens VDO Automotive, Die Bibliothek der technik, Vol.243
[4] "Tire Pressure Control systems from Continental", available on
www.conti-online.com/
[5] R.W. Wiese, H.J. Song and H.P. Hsu "RF Link Budget Analysis of a 315MHz Wireless Link for Automotive Tire Pressure Monitoring System", SAE, 2005-01-1532.
[6] Vikas Kukshya, Hyok J.Song, Hui P.Hsu and Richard W. Wiese "Impact of Inter Vehicular Interference On the Performance of Tire Pressure Monitoring System ", vehicular technology conference, 2007.VTC-2007 Fall.2007 IEEE 66th.
![[PDF] Apprendre C++ avec QtCreator Collectionner les pointeurs | Formation informatique](data:image/gif;base64,R0lGODlhAQABAIAAAP///wAAACH5BAEAAAAALAAAAAABAAEAAAICRAEAOw==)