Publisher’s version / Version de l'éditeur:
Vous avez des questions? Nous pouvons vous aider. Pour communiquer directement avec un auteur, consultez la Questions? Contact the NRC Publications Archive team at
[email protected]. If you wish to email the authors directly, please see the first page of the publication for their contact information.
https://publications-cnrc.canada.ca/fra/droits
L’accès à ce site Web et l’utilisation de son contenu sont assujettis aux conditions présentées dans le site LISEZ CES CONDITIONS ATTENTIVEMENT AVANT D’UTILISER CE SITE WEB.
Research Report (National Research Council of Canada. Institute for Research in
Construction), 2004-10-26
READ THESE TERMS AND CONDITIONS CAREFULLY BEFORE USING THIS WEBSITE.
https://nrc-publications.canada.ca/eng/copyright
NRC Publications Archive Record / Notice des Archives des publications du CNRC :
https://nrc-publications.canada.ca/eng/view/object/?id=e14af56b-738f-4e41-ad56-cf0b6df585b5 https://publications-cnrc.canada.ca/fra/voir/objet/?id=e14af56b-738f-4e41-ad56-cf0b6df585b5
For the publisher’s version, please access the DOI link below./ Pour consulter la version de l’éditeur, utilisez le lien DOI ci-dessous.
https://doi.org/10.4224/20377010
Access and use of this website and the material on it are subject to the Terms and Conditions set forth at
Analysis of Fire Statistics in Canada 1986-2000
Analysis of Fire Statistics
in Canada 1986-2000
Research Report No. 172
Date: October 26, 2004
Authors: Abderrazzaq Bounagui
Noureddine Bénichou
Ederne Victor
Published by
Institute for Research in Construction National Research Council Canada Ottawa, Canada
Fire is a challenge faced by all society and Canada is no exception. The consequences of fire in terms of human lives and material damages are an important tool to aid in identifying potential hazards in the built environment. The analysis of the fire data gathered for the period 1986-2000 reveals that the fire incidents sloped downward over the last few years. However, with an annual average of 63,622 fires occurring over the last 15 years, the number of fires in this country is still high. Ontario, Quebec, Alberta, British Columbia, Manitoba, and Saskatchewan are the provinces in which 90% of the fires occurred and over 92% of these fire costs were recorded. Residential houses are the properties most affected: 42% of the fires, and approximately 80% of the fire deaths took place in residential properties. Cooking equipment, heating equipment, electrical distribution equipment, and smoker’s materials are the leading factors responsible for fire in Canada. They account for 42% of the fires across the country. Mechanical and electrical failures are also important circumstances leading to fire incidents.
Table of contents
Abstract ... i
List of figures...iii
List of tables ... iv
List of tables ... iv
Analysis of Fire Statistics in Canada 1986-2000... 1
1 INTRODUCTION... 1
1.1 Number of fires per year (1986-2000) ... 1
1.2 Number of fire deaths per year (1986-200) ... 2
1.3 Number of fire injuries per year (1986-2000) ... 2
1.4 Fire Losses in CDN dollars (1986-200) ... 3
1.5 Fires by jurisdiction... 4
1.6 Fire losses by jurisdiction ... 5
2 FIRE IN CANADA BY PROPERTY CLASS ... 7
2.1 Fire by property classification ... 8
2.2 Fire deaths by property classification ... 9
2.3 Fire losses by property classification... 10
2.4 Residential properties... 11
2.4.1 Fires by residential occupancy ... 13
2.4.2 Fire losses by residential occupancy... 14
2.5 Fire deaths by residential occupancy ... 16
2.6 Special property ... 16
2.6.3 Fire in special property by occupancy ... 18
2.6.4 Fire losses in special property by occupancy ... 19
3 IGNITION OBJECT – SOURCE OF IGNITION... 20
3.1 Fires by source of ignition ... 21
3.2 Fire deaths by source of ignition ... 23
3.3 Fire losses by source of ignition ... 25
4 ACT OR OMISSION... 27
4.1 Fires by act or omission causing fires ... 27
4.2 Fire loss by act or omission causing fire ... 29
CONCLUSION ... 31
Figure 3: Number of fire injuries per year (1986-2000) ... 3
Figure 4: Fire losses in CDN dollars (1986-2000)... 3
Figure 5: Average fire distribution by jurisdiction over the period 1986-2000 ... 4
Figure 6: Number of fires by jurisdiction (1986-2000) ... 5
Figure 7: Number of fires by jurisdiction (1986-2000) ... 5
Figure 8: Average fire losses by jurisdiction for the period 1986-2000 in percentage ... 6
Figure 9: Fire losses in CDN dollars by jurisdiction (1986-2000) ... 6
Figure 10: Fire losses in CDN dollars by jurisdiction (1986-2000) ... 7
Figure 11: Fires by property classification (1986-2000) in percentage ... 8
Figure 12: Number of fires by property classification (1986-2000) ... 8
Figure 13: Fire deaths by property classification (1986-2000) in percentage ... 9
Figure 14: Number of fire deaths by property classification (1986-2000) ... 9
Figure 15: Fire losses by property classification (1986-2000) in percentage... 10
Figure 16: Fire losses in CDN dollars by property classification (1986-2000) ... 11
Figure 17: Fire losses in CDN dollars by property classification (1986-2000) ... 11
Figure 18: Fire distribution in residential property by jurisdiction over 1986-2000 ... 12
Figure 19: Number of fires in residential properties by jurisdiction (1986-2000)... 12
Figure 20: Number of fires in residential properties by jurisdiction (1986-2000)... 12
Figure 21: Fires by residential occupancy (1986-2000) in percentage ... 13
Figure 22: Number of fires by residential occupancy (1986-2000) ... 14
Figure 23: Fire losses by residential occupancy (1986-2000) in percentage... 15
Figure 24: Fire losses in CND dollars by residential occupancy (1986-2000) ... 15
Figure 25: Fire deaths by residential occupancy (1986-2000) in percentage ... 16
Figure 26: Fire distribution in special property by jurisdiction for the period 1986-2000 . 17 Figure 27: Number of fires in special properties by jurisdiction (1986-2000) ... 17
Figure 28: Number of fires in special properties by jurisdiction (1986-2000) ... 18
Figure 29: fires in special properties by occupancy (1986-2000) in percentage... 18
Figure 30: Number of fires in special properties by occupancy (1986-2000)... 19
Figure 31: Fire losses in special properties by occupancy (1986-2000) in percentage .. 19
Figure 32: Fire losses in CND dollars in special properties by occupancy (1986-2000). 20 Figure 33: Average fire distribution by source of ignition for the period 1986-2000... 21
Figure 34: Fires by source of ignition (1986-2000) in percentage... 22
Figure 35: Number of fires by source of ignition (1986-2000)... 22
Figure 36: Number of fires by source of ignition (1986-2000)... 23
Figure 37: Fire-related deaths by source of ignition (1986-2000) in percentage ... 23
Figure 38: Number of fire deaths by source of ignition (1986-2000)... 24
Figure 39: Number of fire deaths by source of ignition (1986-2000)... 24
Figure 40: Fire losses by source of ignition (1986-2000) in percentage ... 25
Figure 41: Fire losses in CDN dollars by source of ignition (1986-2000)... 26
Figure 42: Fire losses in CDN dollars by source of ignition (1986-2000)... 26
Figure 43: Fires by act or omission causing fire (1986-1999) in percentage ... 28
Figure 44: Number of fires by act or omission causing fire (1986-1999) ... 28
Figure 45: Number of fires by act or omission causing fire (1986-1999) ... 29
Figure 46: Fire losses by act or omission causing fire (1986-1999) in percentage... 29
Figure 47: Fire losses in CDN dollars by act or omission causing fire (1986-1999) ... 30
List of tables
Table 1: Description of property class terms... 7 Table 2: Description of source of ignition terms ... 20 Table 3: Description of Act or Omission Terms... 27
1 INTRODUCTION
Fire has significant social and economic impacts on our society and it is one of the major problems which continues to challenge Canadian society. Each year, Canada sees a number of deaths occurring in different locations as a result of fires. These fires also result in injuries and losses of quality of life and property. In order to assess how life safety is being affected year after year, this report presents an analysis of fire statistics in Canada during the period 1986-2000 [1 to 15].
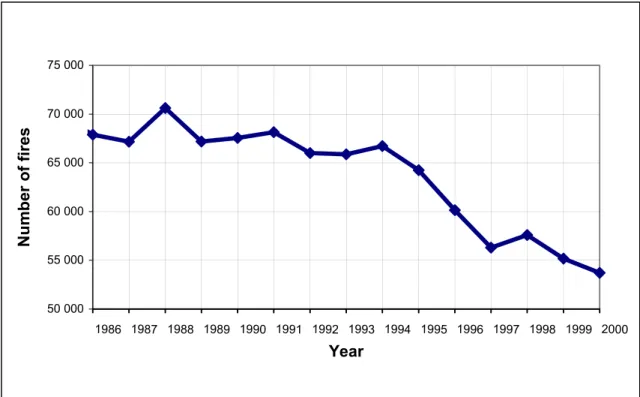
1.1 Number of fires per year (1986-2000)
This section summarizes the fire statistics in Canada and describes their consequences. Fire incidents are still high in Canada even though the overall number of fires is generally down over the period 1986-2000. An annual average of 63,622 fires occurred in Canada for a total of 954,331 declared fires over the same period under consideration. Over the first ten years, the average number of fires was above the period average and reached 68,083 and 66,199 respectively. The last five years averaged out to 56,584 fires and is by far less than the previous ones. These three averages actually vindicate that the fire frequency is slowing down over the period 1986-2000 and is still above 52,000 a year, which represents an average of more than 1,000 fires a week. Figure 1 shows the trends of the fires over this period.
50 000 55 000 60 000 65 000 70 000 75 000 1986 1987 1988 1989 1990 1991 1992 1993 1994 1995 1996 1997 1998 1999 2000 Year Number of fires
1.2 Number of fire deaths per year (1986-200)
One of the reasons why the number of fires is considered high in Canada is that it results in a significant loss of lives. From 1986 to 2000, 6,408 people died from fire across the nation. Most of these casualties, an average of 506 per year occurred during the first five years of the 15-year period. This average exceeds the period average of 427 deaths. Over the next ten years, the number of fire-related deaths is lower and remains stable despite the drastic decrease in the number of fires over the same time period. Figure 2 illustrates how fire-related deaths vary over the period 1986-2000.
300 350 400 450 500 550 600 1986 1987 1988 1989 1990 1991 1992 1993 1994 1995 1996 1997 1998 1999 2000 Year
Number of Fire deaths
Figure 2: Number of fire deaths per year (1986-2000)
1.3 Number of fire injuries per year (1986-2000)
Fires account for 51,212 reported injuries over the period 1986-2000. Fire injuries display a similar trend to the number of fires occurring in the country. They remain high with respect to the period average (3,414) and practically constant throughout the first and second five years periods, namely 3,772 and 3,581 injuries respectively. During the last five years of the period, the number of fire injuries falls below the average at 2,890 except for the year 2000 where the number increased sharply. This similarity between the fire incidence and the fire injury trend shows that the number of fire injuries can be reduced if the fire incidents are somehow contained. Figure 3 represents the trend in fire injuries in Canada during the period.
2 000 2 500 3 000 1986 1987 1988 1989 1990 1991 1992 1993 1994 1995 1996 1997 1998 1999 2000 Year Numbe r of fire injurie
Figure 3: Number of fire injuries per year (1986-2000)
1.4 Fire Losses in CDN dollars (1986-200)
The monetary losses are important in the sense that they represent a lose of resources in society as a whole. Unlike the number of fires in Canada, the monetary losses due to fire are roughly sloped upward over the period 1986-2000. Inflation is probably responsible for that unexpected variation. Over 17 billions dollars of damage were recorded in Canada from 1986 to 2000, which represents on average more than 1 billion dollars per year. The five years averages fluctuate about the period average but the largest one was observed from 1991 to 1995 ($ 1,185 076 944 a year). Figure 4 shows the Zigzag trend of the monetary losses due to fire from 1986 to 2000.
900 000 000 950 000 000 1 000 000 000 1 050 000 000 1 100 000 000 1 150 000 000 1 200 000 000 1 250 000 000 1 300 000 000 1 350 000 000 1986 1987 1988 1989 1990 1991 1992 1993 1994 1995 1996 1997 1998 1999 2000 Year CDN dollars
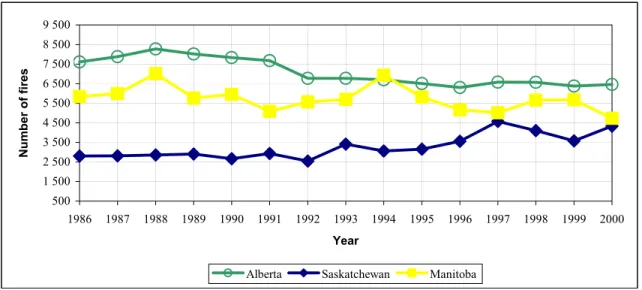
1.5 Fires by jurisdiction
The jurisdictions within Canada include the Provinces, the Territories as well as the National Defence, the Indian Reserves, and the Federal Properties. But only six of them, namely Ontario, Quebec, British Columbia, Alberta, Manitoba, and Saskatchewan, are of great statistical interest inasmuch as 90% of the total number of fires in the country took place there.
Fire incidents in the period 1986-2000 are not uniformly distributed among the different parts of the country. The overall trend of the fires is down in Ontario and Quebec where more than 50% of the incidents happened (Figure 5). The fires in the other 4 provinces oscillate slightly about constant values over the same period. Although the number of fires in Saskatchewan tailed up over the period, it does not influence the overall trend because of its relatively low weight (5% on average) with respect to fire incidents. Figures 6 and 7 show the trends by jurisdiction.
11.2 11.3 9 5.3 33.8 19.2
Alberta British Columbia Manitoba
Saskatchewan Ontario Quebec
2 000 7 000 12 000 17 000 1986 1987 1988 1989 1990 1991 1992 1993 1994 1995 1996 1997 1998 1999 2000 Year Number of fires
British Columbia Ontario Quebec
Figure 6: Number of fires by jurisdiction (1986-2000)
500 1 500 2 500 3 500 4 500 5 500 6 500 7 500 8 500 9 500 1986 1987 1988 1989 1990 1991 1992 1993 1994 1995 1996 1997 1998 1999 2000 Year Number of fires
Alberta Saskatchewan Manitoba
Figure 7: Number of fires by jurisdiction (1986-2000)
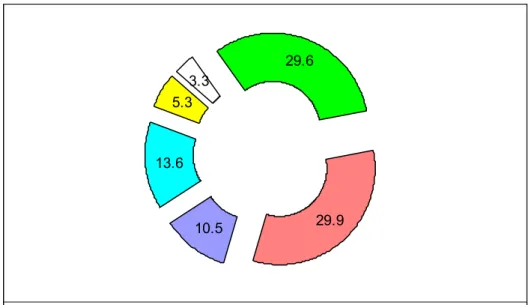
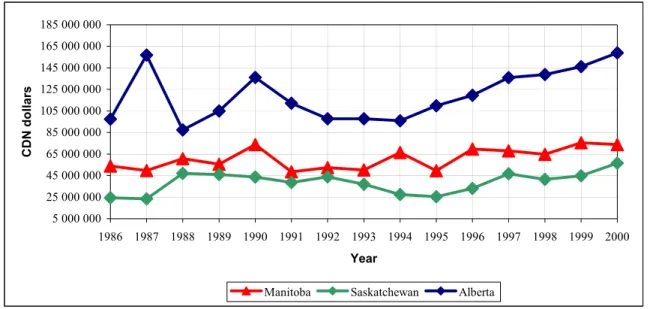
1.6 Fire losses by jurisdiction
It is not surprising that the same 6 provinces have the largest monetary fire losses given the fact that they are responsible for most of the fires. Indeed, over 92% of the total fire losses were recorded in these provinces (Figure 8). It is important to note that the fire losses are not proportionately distributed among the provinces according to the number of fires. Many more fires, for instance, occurred in Ontario than in Quebec (Figures 6 and 7), yet they are approximately subjected to the same monetary losses over the period. Figures 9 and 10 effectively illustrate this point.
10.5 13.6 5.3 3.3 29.6 29.9
Alberta British Columbia Manitoba Saskatchewan Ontario Quebec
Figure 8: Average fire losses by jurisdiction for the period 1986-2000 in percentage
50 000 000 100 000 000 150 000 000 200 000 000 250 000 000 300 000 000 350 000 000 400 000 000 450 000 000 1986 1987 1988 1989 1990 1991 1992 1993 1994 1995 1996 1997 1998 1999 2000 Year CDN dollars
British Columbia Ontario Quebec
5 000 000 25 000 000 45 000 000 65 000 000 85 000 000 105 000 000 125 000 000 1986 1987 1988 1989 1990 1991 1992 1993 1994 1995 1996 1997 1998 1999 2000 Year CDN dollars
Manitoba Saskatchewan Alberta
Figure 10: Fire losses in CDN dollars by jurisdiction (1986-2000)
2 FIRE IN CANADA BY PROPERTY CLASS
One of the key parameters used to analyze fire statistics is the type of property involved in the incidents. This classification will allow, among other things, to target specific areas of action if measures have to be taken. Table 1 shows the classification employed and also provides examples for every category so that any misinterpretation is avoided.
Property class Examples
Residential 1&2 Family Dwellings; Apartment; Hotel, Inn, Lodge; Dormitory; Mobile Home; Camp/Retreats, …
Assembly Theatre, Studio, Auditorium; School, College, University; Church, Funeral Parlour; Library, Museum, Art Gallery; … Institutional Penitentiary, Correctional Facility, Reformatory; Home for
Aged; Community Care Facility; Medical Facilities; … Business and Personal
Service
Office; Personal Service; Electronic Equipment; Miscellaneous, Business & Personal Service.
Mercantile Food, Beverage Sale; Textile, Wearing Apparel Sale; Recreation, Hobby Supplies; Department, Variety; … Industrial Manufacturing
Properties
Chemical, Petroleum, Paint, Plastic; Wood, Furniture, Paper, Printing; Food Processing; Textiles; …
Storage Properties Agriculture, Products Storage; Textiles, Fibres, Clothing Storage; Chemical, Plastics, Paints; Vehicle Storage; … Special Properties-
Transportation Equipment
Outdoor Property; Watercraft; Rail, Transport Vehicle & Equipment; Ground Transport Vehicle; Aircraft; … Farm Properties
Miscellaneous Properties Laboratories; Farm Facilities; Utilities; Mining, Quarrying; Communications; Cement, Glass, Pottery Manufacturing; … Table 1: Description of property class terms
2.1 Fire by property classification
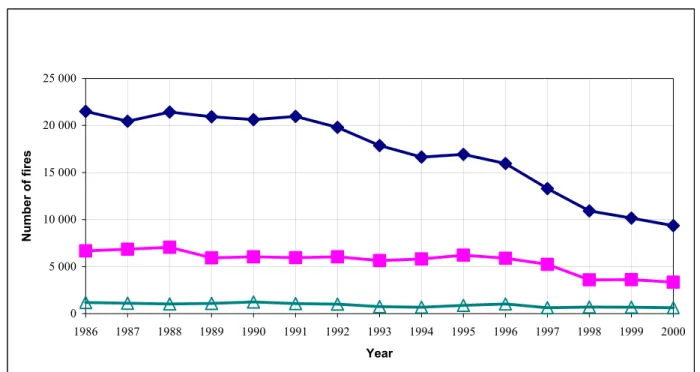
Residential and special properties are the main places where the majority of fires took place in Canada from 1986 to 2000. Of the declared fires, over 42% occurred in residential properties followed by the special properties with more than 36%. These two categories accounted for about 80% of the total fires over the period. Figure 11 is the distribution of the fire incidents from 1986 to 2000, while Figure 12 shows the trends of these two categories over the same period. It turns out that the gap between the two trends has shrunk at the end of the period.
48.2 45.8 45.0 44.9 44.9 44.7 44.2 40.2 37.6 40.1 40.5 37.0 40.9 40.1 39.5 34.4 36.3 36.4 36.5 37.2 37.4 37.5 33.5 35.1 38.6 35.8 35.4 37.7 36.9 35.6
1986 1987 1988 1989 1990 1991 1992 1993 1994 1995 1996 1997 1998 1999 2000
Year
Percentage
Residential Special properties
Figure 11: Fires by property classification (1986-2000) in percentage
15 000 20 000 25 000 30 000 35 000 1986 1987 1988 1989 1990 1991 1992 1993 1994 1995 1996 1997 1998 1999 2000 Year Number of fires
Residential Special properties
Figure 12: Number of fires by property classification (1986-2000)
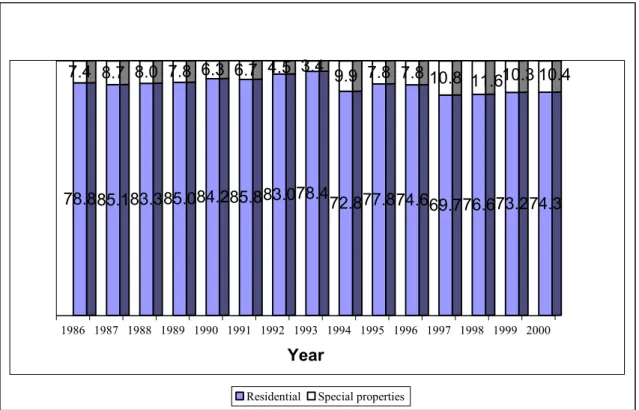
special properties. These two categories totalled on average 87% of all the fatalities. The difference between the trends of these two categories becomes much more important when it comes to fire-related deaths. See Figures 13 and 14 for illustration.
78.8 7.4 85.1 8.7 83.3 8.0 85.0 7.8 84.2 6.3 85.8 6.7 83.0 4.5 78.4 3.4 72.8 9.9 77.8 7.8 74.6 7.8 69.7 10.8 76.6 11.6 73.2 10.3 74.3 10.4 1986 1987 1988 1989 1990 1991 1992 1993 1994 1995 1996 1997 1998 1999 2000 Year
Residential Special properties
Figure 13: Fire deaths by property classification (1986-2000) in percentage
0 50 100 150 200 250 300 350 400 450 500 1986 1987 1988 1989 1990 1991 1992 1993 1994 1995 1996 1997 1998 1999 2000 Year
Number of fire deaths
Residential Special properties
2.3 Fire losses by property classification
The cost of the fires is important in the residential category. In fact, 43% of the monetary losses fall into this group. Otherwise, the cost of the fires is fairly distributed over the other categories. The special property still comes second but at a much lower level in terms of cost (11% on average). Categories such as Assembly, Mercantile, and Industrial Manufacturing are not very likely to be involved in a fire but if they do the cost is fairly high, given the nature of the equipment involved. Whether it is the overall cost of fire or the losses by residential classification, the trends are still sloped upward over the period 1986-2000. Figures 15, 16 and 17 give the distribution and the variation of the monetary losses over the period.
39.2 40.0 44.0 40.6 43.4 45.5 43.5
40.8 39.8 47.3 45.6
41.3
44.7 42.0 44.7
8.4
7.5
7.8
7.2 7.1
6.3 9.4
6.8 5.9
5.8 6.9
7.0
6.6
5.2
5.3
8.4
10.5
11.4
12.2 9.8 10.4
9.7 7.8
8.3
8.4 10.8
7.2
7.3
7.5
9.0
8.4 15.4 9.4 11.4 12.2 11.1
8.8 9.9 10.3 9.1 9.3
14.7
12.4
13.8 10.0
4.8
6.6 5.7 5.7 7.5 5.8 6.0 5.5 4.1 5.9 5.4
6.7
4.1 5.0 5.2
11.7 9.2 10.7 10.3 10.3 12.1 9.0
7.2 10.1 9.6 9.1
16.4
10.4 11.4 11.6
1986 1987 1988 1989 1990 1991 1992 1993 1994 1995 1996 1997 1998 1999 2000 Year PercentageResidential Assembly Mercantile Industrial manufacturing properties Storage properties Special properties
0 100 000 000 200 000 000 300 000 000 1986 1987 1988 1989 1990 1991 1992 1993 1994 1995 1996 1997 1998 1999 2000 Year CDN dollars
Residential Assembly Special properties
Figure 16: Fire losses in CDN dollars by property classification (1986-2000)
20 000 000 40 000 000 60 000 000 80 000 000 100 000 000 120 000 000 140 000 000 160 000 000 180 000 000 200 000 000 1986 1987 1988 1989 1990 1991 1992 1993 1994 1995 1996 1997 1998 1999 2000 Year CDN dol la rs
Mercantile Industrial manufacturing properties Storage properties Figure 17: Fire losses in CDN dollars by property classification (1986-2000)
2.4 Residential properties
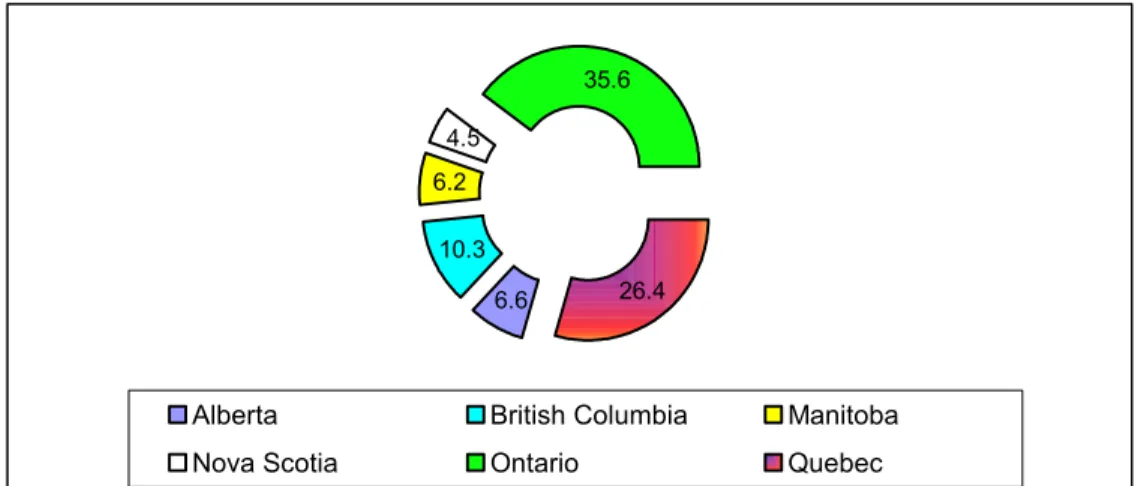
It was previously observed that most of the fires occurred in 6 provinces and particularly in Ontario and Quebec. As a result, those provinces incurred the majority of the fire consequences. The same reality prevails when the focus is shifted to the residential category of its own. The six provinces, Ontario, Quebec, British Columbia, Alberta, Manitoba, and now Nova Scotia are responsible for 90% of the fires recorded in this group (Figure 18). The weight of Ontario is now 36% while that of Quebec is on average 26%. Figures 19 and 20 present the trends of the group by jurisdiction over the period under consideration.
6.6 10.3 6.2 4.5 35.6 26.4
Alberta British Columbia Manitoba Nova Scotia Ontario Quebec
Figure 18: Fire distribution in residential property by jurisdiction over 1986-2000
1 000 3 000 5 000 7 000 9 000 11 000 13 000 1986 1987 1988 1989 1990 1991 1992 1993 1994 1995 1996 1997 1998 1999 2000 Year Number of fires
British Columbia Ontario Quebec
Figure 19: Number of fires in residential properties by jurisdiction (1986-2000)
0 5 0 0 1 0 0 0 1 5 0 0 2 0 0 0 2 5 0 0 3 0 0 0 19 8 6 19 8 7 19 8 8 19 8 9 19 9 0 19 9 1 19 9 2 19 9 3 19 9 4 19 9 5 19 9 6 19 9 7 19 9 8 19 9 9 2 0 0 0 Year Nu mb e r o f f ire
Nova Scotia Alberta Manitoba
the residential group occurred in the following three subcategories: “one and two family residence”, “apartment, tenement, flat”, and “mobile home, trailer”. It is also remarkable that over 83% of these fires took place in the first two subcategories, which actually represent the regular homes. Figures 21 and 22 clearly show the trends over the period 1986-2000.
66.8 66.5 67.5 69.4 68.0 68.7 67.8 67.5 66.3 65.7 65.5 63.7 46.4 45.8 44.1
20.7 22.3 22.2 19.7 19.9 19.5 20.7 21.3 23.2 24.1 24.2 25.1 15.3 16.4 15.7
3.7 3.6 3.3 3.6 4.1 3.5 3.5 2.8 2.8 3.4 4.3 3.0 3.0 3.1 3.0
1986 1987 1988 1989 1990 1991 1992 1993 1994 1995 1996 1997 1998 1999 2000 Year PercentageOne and two family residence Apartment, tenement, flat Mobile home, trailer
0 5 000 10 000 15 000 20 000 25 000 1986 1987 1988 1989 1990 1991 1992 1993 1994 1995 1996 1997 1998 1999 2000 Year Number of fires
One and two family residence Apartment, tenement, flat Mobile home, trailer
Figure 22: Number of fires by residential occupancy (1986-2000)
2.4.2 Fire losses by residential occupancy
The monetary losses are proportionately distributed among the three subcategories. Indeed, their cost reached over 85% of the total cost in the residential property. The same subgroups “One and two family residence”, “apartment, tenement, flat” have a weight of about 83% in terms of loss. It is evident that all the fire issues boil down to these two types of property where fires and their damages are more disastrous. Figures 23 and 24 illustrate the bar distribution and the trends of the residential properties by occupancy from 1986 to 2000.
64.9 66.7 66.470.2 67.3 67.3 70.8 70.0 72.6 70.7 71.8 70.8 48.5 51.3 51.4
1986 1987 1988 1989 1990 1991 1992 1993 1994 1995 1996 1997 1998 1999 2000
Year
Percentage
One and two family residence Apartment, tenement, flat Mobile home, trailer
Figure 23: Fire losses by residential occupancy (1986-2000) in percentage
0 50000000 100000000 150000000 200000000 250000000 300000000 350000000 400000000 450000000 1986 1987 1988 1989 1990 1991 1992 1993 1994 1995 1996 1997 1998 1999 2000 Year CDN dollars
2.5 Fire deaths by residential occupancy
As mentioned earlier, 80% of fire related deaths come from residential property. The fire deaths in residential property are proportionally distributed among three subcategories: “one and two family residence”, “Apartment, tenement, flat” and “mobile home, trailer”. These three subgroups have a weight of about 88% in terms of fire deaths in residential property. Figure 25 illustrates the bar distribution of fire residential fire deaths by
occupancy from 1986 to 2000. 64.9 63.1 63.8 66.9 63.1 68.8 64.6 75.2 63.0 61.4 56.6 55.9 49.2 52.1 51.0 24.8 22.3 20.4 16.9 20.1 15.6 18.9 13.1 21.2 25.7 28.0 26.6 15.9 15.1 17.3 3.2 5.5 6.5 7.4 7.0 7.8 9.0 5.8 5.1 6.4 10.0 7.9 4.7 7.0 4.9
1986
1988
1990
1992
1994
1996
1998
2000
Year
Percentage
One and two family residence Apartment, tenement, flat Mobile home, trailer
Figure 25: Fire deaths by residential occupancy (1986-2000) in percentage
2.6 Special property
In terms of fire occurrence and fire loss, the special property is the second most important of the property classifications. The distribution of the fires in the special property is similar to that in the residential group. Most fires in that group, 94% on average, happened in 6 jurisdictions: Ontario, British Columbia, Manitoba, Alberta, Quebec, and Saskatchewan. But in the special property category, Ontario and British Columbia record the highest weights of 33% and 14% respectively, while Quebec and Saskatchewan have the lowest percentages among the six provinces (Figure 25). Figures 27 and 28 clearly show the lead of Ontario and the overall down trend of the
13.4
14.3 32.5
11.6
Alberta British Columbia Manitoba Saskatchewan Ontario Quebec
Figure 26: Fire distribution in special property by jurisdiction for the period 1986-2000
0 1 000 2 000 3 000 4 000 5 000 6 000 7 000 8 000 9 000 10 000 1986 1987 1988 1989 1990 1991 1992 1993 1994 1995 1996 1997 1998 1999 2000 Year Number of fires
Alberta Ontario Quebec
1 000 1 500 2 000 2 500 3 000 3 500 4 000 4 500 1986 1987 1988 1989 1990 1991 1992 1993 1994 1995 1996 1997 1998 1999 2000 Year Number of fires
British Columbia Manitoba Saskatc hewan
Figure 28: Number of fires in special properties by jurisdiction (1986-2000)
2.6.3 Fire in special property by occupancy
The relative importance of this category leads to splitting it into sub-groups in order to have an in-depth understanding of its components. Among the subcategories considered, the ground transportation vehicle come first with an average of 67% of the fires, then follows the outdoor property, and the special vehicle groups with 22% and 5% respectively. These three subcategories total around 94% of the fires occurring in the special property group. Figures 29 and 30 highlight the distribution of the fires in the group by occupancy as well as their trends from 1986 to 2000.
15.2 17.8 21.1 18.2 17.8 17.4 20.3 19.5 23.0 22.1 24.9 28.2 29.2 27.7 26.9 75.1 71.8 69.6 72.6 72.7 73.1 70.9 73.0 70.4 42.8 64.9 62.0 62.4 63.9 59.4 5.2 4.7 4.7 4.8 4.7 4.7 4.1 3.2 3.3 3.2 5.1 5.9 6.0 6.2 11.9 1986 1987 1988 1989 1990 1991 1992 1993 1994 1995 1996 1997 1998 1999 2000 Year Percentage
0 2 000 4 000 6 000 8 000 10 000 12 000 14 000 16 000 1986 1987 1988 1989 1990 1991 1992 1993 1994 1995 1996 1997 1998 1999 2000 Year Number of fires
Outdoor property Ground transport vehicle Special vehicle
Figure 30: Number of fires in special properties by occupancy (1986-2000)
2.6.4 Fire losses in special property by occupancy
Once again, three subcategories cover more than 82% of the total cost of fire in the special property group. The majority of the loss took place in a ground transport vehicle (around 55%). The “special vehicle”, and the “construction, demolition, and vacant” subgroups come after with 16% and 11% respectively. In 1996, an unusual increase of the fire loss was recorded in the “construction, demolition, vacant” subgroup (47%), which consequently brought down the fire cost weight of the ground transport vehicle to 35%. Figures 31 and 32 illustrate the variation within the special property over the period. 15.2 9.7 8.9 9.1 10.4 9.1 8.1 5.4 14.2 7.9 46.8 6.8 4.4 5.2 7.8 42.0 56.6 54.0 54.7 58.2 53.365.4 69.5 56.5 36.7 35.2 55.669.0 62.952.6 12.6 16.3 18.6 16.0 16.212.314.0 10.5 12.2 13.3 11.5 12.1 20.2 19.1 34.7 1986 1987 1988 1989 1990 1991 1992 1993 1994 1995 1996 1997 1998 1999 2000 Year percentage
Construction, demolition, vacant Ground transport vehicle Special vehicle
0 20 000 000 40 000 000 60 000 000 80 000 000 100 000 000 120 000 000 1986 1987 1988 1989 1990 1991 1992 1993 1994 1995 1996 1997 1998 1999 2000 Year CDN dollars
Construction, demolition, vacant Ground transport vehicle Special vehicle
Figure 32: Fire losses in CND dollars in special properties by occupancy (1986-2000)
3 IGNITION OBJECT – SOURCE OF IGNITION
The table below is helpful to understand the different items causing fire in Canada and what is included in each of them.
Sources of Ignition Examples
Cooking Equipment Stove, Range involved; Self Heat Appliances; Warming Appliances; Unclassified.
Heating Equipment Central Heating Unit; Water Heating; Space Heaters, Wood Stove; Fireplace; Chimney; Flue Pipe; … Appliances & Equipment Television, Radio, Stereo; Clothes Dryer, Air
Conditioning, Refrigeration; Incinerator; … Electrical Distribution
Equipment
Electrical Writing; Electrical Components; Battery, Rectifier- includes charger.
Other Electrical Equipment Electric Motors; Electric Equipment; Video Game
Equipment; Photocopier, Facsimile, Computer Printer; .. Smoker’s material & Open
flame
Smoker’s material (all in conjunction with smoking); Cigarette; Pipe (Contents); Match; Lighter; Lamp; …
Exposure Structures; Lumber Yard; Outside Storage Containers;
Open Fire; Forest, Grass, Trees, Shrubs, Brush; Vehicle.
Miscellaneous Internal Combustion Engine, Exhaust System; Heat Treatment Equipment; Industrial Oven, Kiln; Tar Pot; … Table 2: Description of source of ignition terms
fewer fires and consequently less damage will be recorded in the future. All the above factors make fire happen but not at the same level. Over the period 1986-2000, an average of 12% of the total fires in Canada originated from “cooking equipment”; each of the “ heating equipment” and “electrical distribution equipment” contributed to 9% of the fires; the “smoker’s material” and the “smoker’s material or open flame unclassified” were involved in 6% of the fires (Figure 33). These are the 5 leading causes of fire in the country and accounted for around 42% of the fires over the period 1986-2000. Figures 34, 35 and 36 show the distribution of these fire factors and their trends over the period.
11.8 9.2 9.3 5.8 6.0 Cooking equipment Heating equipment
Electrical distribution equipment Smoker's material
Smoker's material or "open flame" unclassified
13.0 13.3 12.7 13.2 13.1 12.8 12.5 11.6 10.2 11.2 10.8 10.4 10.8 11.1 10.3
11.5 10.1 10.5 10.3 9.5
9.3
9.8 8.9 8.0 8.1 8.4 6.9 9.2 8.8 8.9
11.6 10.8
10.2 10.8 10.5
10.1
9.5 7.5 7.5
9.3 8.7 8.3 8.4 8.7 8.3
7.1 5.9
5.6
7.1 6.4
6.1
4.9 3.8 3.8 5.9 5.7 6.1 5.7 5.2 7.3
3.0 4.4
7.3 4.6 5.2
2.0
7.4 6.6 7.3 7.5 6.7 6.6 7.5 7.6 6.5
1986 1987 1988 1989 1990 1991 1992 1993 1994 1995 1996 1997 1998 1999 2000 Year PercentageCooking equipment Heating equipment
Electrical distribution equipment Smoker's material Smoker's material or "open flame" unclassified
Figure 34: Fires by source of ignition (1986-2000) in percentage
3 000 4 000 5 000 6 000 7 000 8 000 9 000 10 000 1986 1987 1988 1989 1990 1991 1992 1993 1994 1995 1996 1997 1998 1999 2000 Year Number of fires
Cooking equipment Heating equipment Electrical distribution equipment
1 0 0 0 1 5 0 0 2 0 0 0 2 5 0 0 3 0 0 0 3 5 0 0 19 8 6 19 8 7 19 8 8 19 8 9 19 9 0 19 9 1 19 9 2 19 9 3 19 9 4 19 9 5 19 9 6 19 9 7 19 9 8 19 9 9 2 0 0 0 Year Number of fires
Smoker's material Smoker's material or "open flame" unclassified
Figure 36: Number of fires by source of ignition (1986-2000)
3.2 Fire deaths by source of ignition
Smoker’s material is by far the most fatal of all the fire factors. It is the cause of over one-fifth of the fire deaths in Canada. The same factors responsible for fires are also the most deadly ones. More than 50% of the fire-related deaths come from them. Figures 37, 38 and 39 present the variation of fire-related deaths in Canada by source of ignition from 1986-2000.
8.5
9.3
8.4 10.8 9.1
9.3
9.1
14.1
10.1 9.5 9.9 12.3 9.2 8.8 9.8
10.8 6.2 10.2
9.0
7.4
5.9
7.6
6.2
4.5
8.8
7.0
4.8
6.5
3.1
5.2
20.6
21.5 21.3
23.8
21.7 22.9
17.7
16.1
11.7
17.8 26.7
25.5 25.2
18.3
20.5
4.5
6.2
5.6
5.0
5.6
8.2
16.4
5.0
14.1
2.3
3.2
3.8
3.0
6.4
3.1
7.8
7.0
8.8
2.2
3.5
1.0
7.8
6.2
6.6
8.0
7.5 10.6 10.1 9.0 10.7
1986 1987 1988 1989 1990 1991 1992 1993 1994 1995 1996 1997 1998 1999 2000 Year PercentageCooking equipment Heating equipment
Smoker's material Match, lighter(not used with smoking), lamp, candle, taper Smoker's material or "open flame" unclassified
0 20 40 60 80 100 120 140 1986 1987 1988 1989 1990 1991 1992 1993 1994 1995 1996 1997 1998 1999 2000 Year
Number of fire deaths
Cooking equipment Smoker's material
Match, lighter(not used with smoking), lamp, candle, taper
Figure 38: Number of fire deaths by source of ignition (1986-2000)
0 10 20 30 40 50 60 70 1986 1987 1988 1989 1990 1991 1992 1993 1994 1995 1996 1997 1998 1999 2000 Year
Number of fire deaths
Heating equipment Smoker's material or "open flame" unclassified
of the five most significant fire causes relative to the total cost lies in the range 5-12% and all combined add up to 28% of the monetary cost. Figures 40, 41 and 42 give a better graphic representation of the fire loss by source of ignition over the period 1986-2000.
5.5 5.7 5.9 5.6
7.2 5.8 6.0 8.0 4.8 6.4 6.0 5.6 5.9 6.2 5.8
10.0
9.7 9.4 8.6 7.9
9.0
8.2
11.1
8.4 8.4 8.9 5.8 10.0
7.0
8.3
19.0
10.9
11.2
11.1 11.2
11.5
12.4
14.2
10.1
12.8 12.8
9.3
10.0
9.7
12.1
5.0 5.0 7.8 3.6 5.4
0.5 6.5
0.7
5.0 6.8 7.4
7.4 8.6
5.1
5.4
5.4 3.5 3.6 4.9 4.5 4.6 3.0 3.8 2.8 3.8 3.6 3.3 3.5 3.0 4.8
1986 1987 1988 1989 1990 1991 1992 1993 1994 1995 1996 1997 1998 1999 2000 Year PercentageCooking equipment Heating equipment
Electrical distribution equipment Smoker's material or "open flame" unclassified
Smoker's material
0 20 000 000 40 000 000 60 000 000 80 000 000 100 000 000 120 000 000 140 000 000 160 000 000 180 000 000 200 000 000 1986 1987 1988 1989 1990 1991 1992 1993 1994 1995 1996 1997 1998 1999 2000 Year CDN dollars
Heating equipment Electrical distribution equipment Cooking equipment
Figure 41: Fire losses in CDN dollars by source of ignition (1986-2000)
1 000 000 21 000 000 41 000 000 61 000 000 81 000 000 101 000 000 121 000 000 1986 1987 1988 1989 1990 1991 1992 1993 1994 1995 1996 1997 1998 1999 2000 Year CDN dollars
Smoker's material Smoker's material or "open flame" unclassified
Act or Omission causing fire
Examples
Misuse of Material Ignited Misuse of flammable liquid; Improper Storage or Container; Overheated oil, grease, wax; … Mechanical, Electrical Failure
Malfunction
Failure of part or control; Electric Short Circuit; Part worn out; Backfire (engine).
Construction, Design or Installation Deficiency
Design, Construction, Installation Deficiency; Installed too close to combustible; Over-fusing; …
Misuse of Equipment Overfuelling; Woodburning appliance.
Vehicle Accident Road vehicle; Rail vehicle; Watercraft; Aircraft.
Miscellaneous Tampering with Safety Devices; Hot exhaust/Catalytic converter; Act or omission not applicable.
Table 3: Description of Act or Omission Terms
4.1 Fires by act or omission causing fires
This section is closely related to the previous one but they refer to distinct situations. The source of ignition identifies the different items that are actually causing the fires; this section by contrast describes the context of the fires. With an average of 23% over the period, mechanical and electrical failure or malfunction starts most of the fires in Canada. The other main acts or omissions are “other set fires”, “arson or suspected arson”, “misuse of material ignited”, and “construction, design or installation deficiency” which are each responsible for at least 4% of the fires. All these items display a downward trend over the period 1986-1999 (see Figures 43, 44 and 45).
4.0 9.2 7.4 26.9 3.5 3.8 9.6 12.6 26.0 6.9 1.4 12.5 6.4 25.0 3.9 4.1 9.1 9.7 26.0 4.2 9.1 6.3 4.1 25.8 3.5 6.4 9.8 4.9 25.1 3.2 11.5 6.9 4.2 23.5 3.2 7.1 10.1 3.3 20.4 2.5 7.9 8.5 3.5 20.2 2.4 7.6 11.0 4.7 22.6 4.8 7.3 12.7 4.7 20.3 4.7 4.1 12.7 3.4 19.3 4.4 7.3 11.1 3.4 21.3 4.7 7.0 11.4 3.8 21.3 4.6 1986 1987 1988 1989 1990 1991 1992 1993 1994 1995 1996 1997 1998 1999 Year
Arson/ suspected arson Other set fires
Misuse of material ignited Mechanical, electrical failure, malfunction Construction, design or installation deficiency
Figure 43: Fires by act or omission causing fire (1986-1999) in percentage
0 2 000 4 000 6 000 8 000 10 000 12 000 14 000 16 000 18 000 20 000 1986 1987 1988 1989 1990 1991 1992 1993 1994 1995 1996 1997 1998 1999 Year Number of fires
0 1 000 2 000 3 000 4 000 5 000 1986 1987 1988 1989 1990 1991 1992 1993 1994 1995 1996 1997 1998 1999 Year Nu mb e r o
Misuse of material ignited Construction, design or installation deficiency
Figure 45: Number of fires by act or omission causing fire (1986-1999)
4.2 Fire loss by act or omission causing fire
The fire loss by omission causing fire follows the same pattern as the distribution of the fires by act or omission. Around 19% of the fire cost comes from the mechanical, electrical failure, while the other set fires account for 11%. The same five factors represent on average 45% of the total monetary loss from 1986 to 1999. As expected from the overall trend of the fire loss in Canada, the monetary damage caused by the five factors is generally sloped upward over the period. Figures 46, 47 and 48 illustrate that fact. 5.0 17.2 17.7
4.4
3.5
6.2 10.3 24.68.9
6.4
8.7 8.8 19.54.2
3.6
8.5 8.3 19.36.7
3.2
17.1 2.8 18.82.9
2.9
9.8 9.3 18.13.8
2.9
15.2 4.9 17.83.5
3.1
5.5 14.1 17.72.9
2.1
5.9 10.8 15.62.3
2.8
5.5 12.4 19.33.5
4.1
5.8 15.3 21.63.7
4.0
4.5 9.7 17.43.9
3.3
5.6 16.4 18.52.4
5.9
3.5 9.6 16.52.2
3.0
1986 1987 1988 1989 1990 1991 1992 1993 1994 1995 1996 1997 1998 1999 YearConstruction, design or installation deficiency
Other set fires
Misuse of material ignited
Mechanical, electrical failure, malfunction Arson/ suspected arson
0 50 000 000 100 000 000 150 000 000 200 000 000 250 000 000 300 000 000 1986 1987 1988 1989 1990 1991 1992 1993 1994 1995 1996 1997 1998 1999 Year CDN dollars
Arson/ suspected arson Other set fires Mechanical, electrical failure, malfunction
Figure 47: Fire losses in CDN dollars by act or omission causing fire (1986-1999)
0 10 000 000 20 000 000 30 000 000 40 000 000 50 000 000 60 000 000 70 000 000 80 000 000 90 000 000 1986 1987 1988 1989 1990 1991 1992 1993 1994 1995 1996 1997 1998 1999 Year CDN dollars
Misuse of material ignited Construction, design or installation deficiency
The overall trend of fires is downward from 1986 to 2000, but the resulting cost is moving in the other direction. On average, 63,622 fires occurred in Canada over the period under study. Because of these fires, 427 persons perished, 3,414 were injured, and the monetary loss amounted to $1,150, 217,144.
Ontario, Quebec, Alberta, British Columbia, Manitoba, and Saskatchewan are the provinces in which 90% of the total fires occurred and over 92% of the total fire costs were recorded. It is also important to note that more than 42% of the fires, and approximately 80% of the fire deaths took place in residential properties. These fires occurred particularly in family residences and in apartments.
Finally, the main causes of fires and fire-related damages in the country are cooking and heating equipment, electrical distribution equipment, and smoker’s material. They are responsible for over 42% of the fires and more than 50% of the fire fatalities. Mechanical and electrical failures constitute the primary starting point of fires across the country. Residential property is the group of paramount importance in terms of fire incidents and fire damages. Therefore, this category requires special considerations.
REFERENCES
1. Fire losses in Canada “Annual report 1986”, Labour Canada 2. Fire losses in Canada “Annual report 1987”, Labour Canada 3. Fire losses in Canada “Annual report 1988”, Labour Canada
4. Fire losses in Canada “Annual report 1989”, Labour Canada 5. Fire losses in Canada “Annual report 1990”, Labour Canada
6. Fire losses in Canada “Annual report 1991”, Association of Canadian Fire
Marshals and Fire Commissioners
7. Fire losses in Canada “Annual report 1992”, Association of Canadian Fire
Marshals and Fire Commissioners
8. Fire losses in Canada “Annual report 1993”, Association of Canadian Fire
Marshals and Fire Commissioners
9. Fire losses in Canada “Annual report 1994”, Council of Canadian Fire Marshals
and Fire Commissioners.
10. Fire losses in Canada “Annual report 1995”, Council of Canadian Fire Marshals
and Fire Commissioners
11. Fire losses in Canada “Annual report 1996”, Council of Canadian Fire Marshals
and Fire Commissioners
12. Fire losses in Canada “Annual report 1997”, Council of Canadian Fire Marshals
and Fire Commissioners
13. Fire losses in Canada “Annual report 1998”, Council of Canadian Fire Marshals
and Fire Commissioners
14. Fire losses in Canada “Annual report 1999”, Council of Canadian Fire Marshals
and Fire Commissioners
15. Fire losses in Canada “Annual report 2000”, Council of Canadian Fire Marshals