Publisher’s version / Version de l'éditeur:
Vous avez des questions? Nous pouvons vous aider. Pour communiquer directement avec un auteur, consultez la première page de la revue dans laquelle son article a été publié afin de trouver ses coordonnées. Si vous n’arrivez Questions? Contact the NRC Publications Archive team at
[email protected]. If you wish to email the authors directly, please see the first page of the publication for their contact information.
https://publications-cnrc.canada.ca/fra/droits
L’accès à ce site Web et l’utilisation de son contenu sont assujettis aux conditions présentées dans le site LISEZ CES CONDITIONS ATTENTIVEMENT AVANT D’UTILISER CE SITE WEB.
Client Report (National Research Council of Canada. Institute for Research in Construction), 2004-12-01
READ THESE TERMS AND CONDITIONS CAREFULLY BEFORE USING THIS WEBSITE.
https://nrc-publications.canada.ca/eng/copyright
NRC Publications Archive Record / Notice des Archives des publications du CNRC :
https://nrc-publications.canada.ca/eng/view/object/?id=93ed3e91-be5e-452d-b79d-c20d4ac77002 https://publications-cnrc.canada.ca/fra/voir/objet/?id=93ed3e91-be5e-452d-b79d-c20d4ac77002
NRC Publications Archive
Archives des publications du CNRC
For the publisher’s version, please access the DOI link below./ Pour consulter la version de l’éditeur, utilisez le lien DOI ci-dessous.
https://doi.org/10.4224/20377409
Access and use of this website and the material on it are subject to the Terms and Conditions set forth at An Evaluation of Condition Assessment Protocols for Sewer Management
N a t iona l Re se a rc h Conse il na t iona l Counc il Ca na da de re c he rc he s Ca na da
Client Report
B-5123.6
Municipal Infrastructure Investment Planning (MIIP)
MIIP Report: An Evaluation of Condition Assessment Protocols
for Sewer Management
for
City of Calgary
City of Edmonton
City of Hamilton
City of Ottawa
City of Prince George
Department of National Defence
Regional Municipality of Durham
Regional Municipality of Halton
Regional Municipality of Niagara
December 2004
Municipal Infrastructure Investment Planning (MIIP)
Author
S. Rahman, Ph.D., NSERC Fellow
Author
D.J. Vanier, Ph.D., Project Manager
Quality
Assurance
Y. Kleiner, Ph.D., P.Eng., Group Leader Buried Utilities Group
Approved
D.A. Taylor, Ph.D., P.Eng., Director Urban Infrastructure Program
Report No: B-5123.6
Report Date: December 2004
Contract No: B-5123
Program: Urban Infrastructure Program
iv + 22 pages Copy No. 1 of 15 copies
Table of Contents
Table of Contents ... i
List of Figures... iii
List of Tables ... iii
MIIP Report: An Evaluation of Condition Assessment Protocols for Sewer Management .. 1
Abstract... 1
1 Introduction ... 1
1.1 Need for Condition Assessment Protocols ... 2
2 Condition Assessment for Sewers ... 3
2.1 Condition Assessment Methodologies ... 3
2.1.1 Introduction ... 3
2.1.2 Subjective Grading ... 3
2.1.3 Distress-Based Evaluation ... 3
2.1.4 Non-Destructive Testing... 3
2.2 Sewer Classification ... 4
2.3 Typical Defects and Defect Coding System ... 5
2.4 Deduct Values and Condition Grading... 6
3 Existing Condition Assessment Protocols and Guidelines ... 6
3.1 Water Research Centre (WRc) ... 6
3.1.1 Defect Location ... 6
3.1.2 Deduct Values and Condition Grades ... 7
3.1.3 Criticality ... 7
3.2 National Research Council of Canada (NRC) ... 7
3.2.1 Deduct Values and Condition Grades ... 8
3.2.2 Rehabilitation Priority Selection ... 8
3.3 City of Winnipeg – Sewer Management Study ... 8
3.3.1 Deduct Values and Condition Grades ... 9
3.3.2 Criticality ... 9
3.4 City of Edmonton ... 10
3.4.1 Deduct Values and Condition Grades ... 10
4 Comparison and Discussion of Protocols... 10
4.1 Defect Coding Systems... 12
4.2 Defect Deduct Values ... 12
4.3 Comparison of Condition Grades ... 16
4.4 Criticality of Sewers ... 17 4.5 Maintenance Prioritization... 18 5 Report Summary... 18 6 Concluding Remarks ... 19 7 Acknowledgements... 20 8 References ... 20
List of Figures
Figure 1. Typical Defect Coding System... 5
Figure 2. Clock References for Defect Location ... 7
Figure 3. Comparison of Light and Moderate Structural Defects ... 14
Figure 4. Comparison of Severe Structural Defects ... 15
Figure 5. Comparison of Light, Moderate and Severe Operational Defects ... 15
Figure 6. Edmonton’s Condition Grades Mapped to WRc Protocol ... 17
List of Tables Table 1. Classification for Large Combined Sewers ... 4
Table 2. Common Defects in Sewer Systems (WRc) ... 5
Table 3. Deduct Value Ranges for Condition Grades... 7
Table 4. Deduct Value Ranges for Condition Grades - NRC ... 8
Table 5. Rehabilitation Priority... 8
Table 6. Effects of Soil Types and Frequency of Surcharge on SPG ... 9
Table 7. Comparison of Defect Coding for Sewer Pipes... 11
Table 8. Ranges of Deduct Values for Sewer Condition ... 12
Table 9. Comparison of Deduct Values for Structural Defects ... 12
Table 10. Comparison of Deduct Values for Operational Defects ... 13
Table 11. Condition Grading System... 16
Table 12. Comparison of Peak, Mean and Total Scores... 16
Table 13. Peak Deduct Values for Condition Grade... 16
Table 14. Typical Critical Sewer Categories ... 17
MIIP Report: An Evaluation of Condition Assessment Protocols for Sewer Management Saidur Rahman, Ph.D., National Research Council of Canada
Dana J. Vanier, Ph.D., National Research Council of Canada
Issued: 2004-09-30
Abstract
This paper reviews various aspects of a condition assessment protocol developed by the Water Research Centre (WRc) and compares this protocol with guidelines developed by the National Research Council of Canada (NRC) and others used by Canadian municipalities and utilities. The report also discusses survey results from a number of municipal organizations, outlining the present condition of existing infrastructure, usages of condition assessment protocols, and costs for upgrading the ageing municipal infrastructure. A detailed comparison of defect coding systems, the assigned “deduct” values for various types of defects, and condition grading
systems for the different protocols are discussed. The report also compares maintenance priority rankings based on criticality and consequence of failure. An overall picture of inconsistencies in the field of sewer condition assessment has been drawn and the report stresses the need for an integrated, consistent condition assessment protocol for the prioritization of sewer repair and renewal.
1 Introduction
A sewage collection system is an expensive, yet essential part of today’s civil infrastructure. A modern sewer system is a reflection of the development and quality of life of any urban society. Assessing the existing condition of assets is important for predicting future conditions and determining appropriate investment planning. The term “condition assessment” relates to establishing the existing physical condition, identifying the deterioration pattern, and
determining the potential of collapse or failure of an asset. Therefore, condition assessment is needed to obtain information about an asset’s operational performance (based on its current condition) and to determine timely, appropriate and cost-effective maintenance.
More than a decade ago, the National Association of College and University Business Officers (NACUBO 1990) introduced the facility condition index (FCI), a ratio of the cost of
maintenance deficiencies to the current replacement value (CRV), as a simplified metric to represent the condition of assets. The Association grouped the FCI ranges as <0.05 for facilities in good condition, 0.05~0.10 for fair, and >0.10 for poor. Although, this is a coarse tool for establishing the condition of an asset, it is one of the few metrics currently available. Another expression for asset condition is the asset condition index (ACI), defined as the ratio of the cost of correcting deficiencies to the replacement value as proposed by the City of Ottawa (Ottawa 2003).
A recent survey of condition assessment practices in Canadian cities, conducted by CH2M HILL on behalf of the Federation of Canadian Municipalities (FCM) in 2000 is cited in a recent asset management report by the City of Ottawa (2003). This survey produced 115 responses from all provinces. Among the responding cities, 25 municipalities (22%) had a condition assessment program. Another 29 cities were in the early stages of developing a condition evaluation system. The remaining 61 cities (53%) did not have a condition assessment system.
There is currently no Canadian national standard for sewer condition classification. The Water Research Centre (WRc 2001), a UK-based research organization, developed the unified
Sewerage Rehabilitation Manual (SRM) for industry practitioners almost 20 years ago. The Centre’s condition classification manual (WRc 1993) is one of the resources available for condition classification and defect coding; it is based on closed circuit television (CCTV) inspection.
The North American Association of Pipeline Inspectors (NAAPI), a Canadian organization, has developed a training manual on sewer condition classification based on the WRc manual. In addition, NAAPI offers courses and a certification program for “CCTV operators” and “CCTV reviewers” (NAAPI 2004).
In the United States, the National Association for Sewer Service Companies (NASSCO 2004) has developed the Pipeline Assessment and Certification Program (PACP), with assistance from the WRc, to provide a standardized and consistent way to evaluate sewer pipes using CCTV inspection.
1.1 Need for Condition Assessment Protocols
Condition assessment looks at the current condition of an asset and establishes a benchmark for prioritizing maintenance and rehabilitation activities. Assessing sewer condition is a primary activity in implementing a successful sewer management program because the cost of the sewer system failure can have a significant impact on the immediate economic consequences for the municipality or utility and its taxpayers, as well as on long-term health and environmental issues. The physical condition of sewer systems is not readily visible; therefore sewers are often
overlooked as maintenance or rehabilitation priorities. In addition, many older municipalities do not have maps or records of maintenance activities for their aged sewer systems, let alone the location, age, condition, or attribute information about individual pipe segments required to facilitate condition assessment. New municipalities created as a result of an amalgamation of several smaller municipalities may have problems managing their sewer data due to the amalgamation of different asset management systems or condition assessment protocols. A number of surveys by different organizations describe the condition of Canada’s sewer infrastructure. The average age of Canada’s municipal infrastructure is 42 years (Allouche and Freure 2002). McGill University and the FCM jointly published a survey report (1996) that identified 55% of Canada’s water and wastewater infrastructure as substandard. The estimated cost of upgrading the sanitary and combined sewers, storm sewers, and sewer treatment plants was $4.3 billion, $3.0 billion, and $4.5 billion, respectively (Mirza and Haider 2003). In 2010, 80% of municipal trunk sewers in Canada will be over 50 years old (Zhao 1998). The Municipal Infrastructure Investment Planning (MIIP) survey of municipal assets shows that over 50% of the assets (including sanitary, combined and water networks) are at least 30 years old, and in 10 years (without renewal) 75% of assets will be over 30 years old (Vanier and Rahman 2004). Allouche and Freure (2002) conducted a survey of maintenance and management practices for storm and sanitary sewers to determine the use of condition assessment techniques in Canadian municipalities. Survey questionnaires were sent to 38 municipalities across Canada and 24 responded (62%). This represents municipalities serving 5.2 million people or approximately 17% of the population of Canada. The survey results showed that 68% of the respondents used the WRc protocol. Most large Canadian municipalities in the survey were directly or indirectly
using WRc assessment methods or had developed their own system based on WRc guidelines. In addition, a large number of these Canadian municipalities were using NAAPI-certified operators or reviewers.
To overcome huge maintenance backlogs and to improve the condition and performance of sewer systems, a unified consistent condition assessment protocol is essential. This report compares the various condition assessment protocols in use.
2 Condition Assessment for Sewers
2.1 Condition Assessment Methodologies
2.1.1 Introduction
Condition assessment evaluates and compares the current physical state or performance of an asset to a “like new” asset. Infrastructure managers need good quality inventory and inspection data to perform a proper condition assessment. The challenge is to provide a combined or overall
condition grade1 for the infrastructure, or sections of the network, that accurately represents the
actual condition. Most municipal organizations rely on sewer condition assessment based on visual inspection or expert opinion. Nowadays, advanced diagnostic tools, non-destructive methods, and integrated decision support tools have enhanced the reliability of condition assessment systems. Typical methods in use today include subjective grading, distress-based evaluation, and non-destructive evaluation.
2.1.2 Subjective Grading
Subjective grading is based on visual inspection, in-situ measurements, or expert opinion. The grading scale is represented by a score that is consistent with the level of distress indicated by the defects. The accuracy of a subjective grading depends on an inspector’s experience and the reliability of the system used. Typically, this type of grading system ranges from 0 to 5, 1 to 3, 1 to 7, or 1 to 100. The numbers represent the range of conditions from “like new” to “collapsed” or “collapse imminent.” Subjective grading can be performed by trained personnel based on viewing CCTV tapes or digital movies, in conjunction with site inspections.
2.1.3 Distress-Based Evaluation
Distress diagnosis is primarily done by observations using a predefined protocol developed by experts to rate distresses and to identify the most serious conditions affecting the performance of the asset. Generally, weighted factors or deduct values are used to grade the severity of the condition. WRc and the NRC Guidelines are premised on distress-based evaluation.
2.1.4 Non-Destructive Testing
Non-destructive testing (NDT) examines an asset without destroying it. It is a widely used, efficient, but not always an accurate method for condition assessment; however, it is more expensive than visual inspection. The technologies involved in NDT depends primarily on pipe size, material, and depth, but are also dependent on flow velocity and the criticality of the
1
expected problem. Currently available tools and techniques for condition assessment of wastewater, storm, and sewer pipes include electromagnetic (radar), magnetic, acoustic (leak detection), sonar, infrared thermography, fibre optic sensing, ultrasonic, ground penetrating radar (GPR), and electrical methods (eddy current). Visual and physical inspections are aided by zoom cameras, CCTV, smoke tests, impact hammer tests and dye penetrant testing (Allouche and Freure 2002, Zhao et al. 2001, NGSMI 2004).
2.2 Sewer Classification
Sewer pipes can be classified based on the purpose of the service, type of material, and in-situ conditions. Major sewer classification is related to function: storm water, sanitary sewage, combined, or land drainage. Other sewer classifications are based on:
• Material: Flexible (brick and clay) and rigid (concrete, reinforced concrete, plastic, metallic,
and asbestos cement).
• Diameter: Large sewers (diameter >900mm or person entry) and small sewers (diameter
<900mm or non-person entry).
• Soil type: Cohesive and non-cohesive soils.
• Depth of cover: Typical depth (0.9m ~ 6.0m) and non-typical depth (i.e., <0.9m or >6.0m). • Criticality (location, importance, collateral damage and replacement cost): Critical and
non-critical.
• Groundwater table (GWT): High GWT (pipe below GWT) and low GWT (pipe above
GWT).
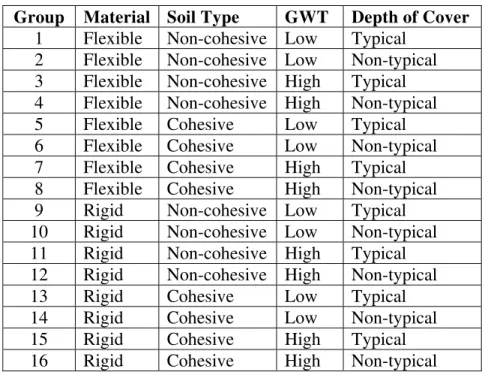
An example of a detailed classification of 16 groups of combined sewer pipes used for condition deterioration modeling is presented in Table 1 (Wirahadikusumah et al. 2001).
Table 1. Classification for Large Combined Sewers
Group Material Soil Type GWT Depth of Cover
1 Flexible Non-cohesive Low Typical
2 Flexible Non-cohesive Low Non-typical
3 Flexible Non-cohesive High Typical
4 Flexible Non-cohesive High Non-typical
5 Flexible Cohesive Low Typical
6 Flexible Cohesive Low Non-typical
7 Flexible Cohesive High Typical
8 Flexible Cohesive High Non-typical
9 Rigid Non-cohesive Low Typical
10 Rigid Non-cohesive Low Non-typical
11 Rigid Non-cohesive High Typical
12 Rigid Non-cohesive High Non-typical 13 Rigid Cohesive Low Typical 14 Rigid Cohesive Low Non-typical 15 Rigid Cohesive High Typical 16 Rigid Cohesive High Non-typical
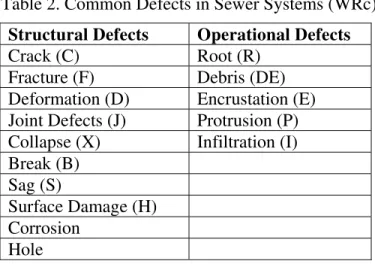
2.3 Typical Defects and Defect Coding System
Defects are typically the result of ageing, environmental loading, quality of construction, inappropriate material usage, soil conditions, hydraulic properties, increased overburden loads, unanticipated user demands, or natural forces. Table 2 classifies some common defects in a sewer system according to the WRc and accepted practice.
The most common defects in sewer systems are categorized as structural or operational (serviceability). Most municipalities or utilities are concerned with structural defects, but operational defects also have an important impact on system performance. For example, a pipe may be structurally sound but roots and debris block the flow.
Table 2. Common Defects in Sewer Systems (WRc)
Structural Defects Operational Defects
Crack (C) Root (R)
Fracture (F) Debris (DE)
Deformation (D) Encrustation (E)
Joint Defects (J) Protrusion (P)
Collapse (X) Infiltration (I)
Break (B) Sag (S)
Surface Damage (H) Corrosion
Hole
Each defect identified in Table 2 can be classified as light, moderate, or severe according to the size, number, shape, and orientation of the defect(s) in a given pipe segment. The classification of the defect and its severity can vary between inspectors according to their experience and the quality of the images provided. Typically, a comprehensive assessment protocol provides thorough assessment instructions and examples of both the defect type and severity in order to assist inspectors and reviewers.
Defect coding provides a convention for quickly identifying defects in a sewer system. Defects are generally identified by a two- or three-letter abbreviation. The first letter indicates the defect type, the second letter indicates defect direction (if any) or distress level, and the third letter (when used) indicates the distress level for the specific defect. Figure 1 illustrates a typical defect coding system (WRc 1993; Zhao et al. 2001).
Figure 1. Typical Defect Coding System )
2.4 Deduct Values and Condition Grading
A typical sewer condition grade is identified by a number from 1 to 5 (WRc 2001). It is determined by a defect score calculation that is based on the sum of the deduct values for the various defects in the pipe segment. The value, or weight, for each defect is assigned according to the condition assessment protocol used and it determines the impact of the defect on the service life and performance of the sewer pipe segment. The length of the pipe segment should be less than 120 metres from manhole to manhole. The mean score represents an average of the deduct values along the pipe segment or manhole-to-manhole length. The total score represents the summation of all deduct values while the peak score represents the highest deduct value in the pipe segment. Typically, defect scores are calculated as follows:
(a) Mean Score=Length ∑(Deduct ofPipeValues)Segment (1)
(b) Peak Score=MaximumDeduct Value (2)
(c) TotalScore=
∑
(Deduct Values) (3)How these scores are used to determine condition grading will be discussed in the next section.
3 Existing Condition Assessment Protocols and Guidelines
As noted earlier, WRc protocol forms the basis for the development of other sewer condition assessment protocols and guidelines in use in Canada and around the world.
3.1 Water Research Centre (WRc)
In 1978, the WRc initiated a five-year research project to investigate the failure of over 250 collapsed pipes. From the findings of this research, the WRc developed the first Sewerage
Rehabilitation Manual (SRM) (2001). This manual subsequently underwent several revisions. The fourth and latest edition (WRc 2001) was compiled from the updated contents of the
previous editions of the SRM. This edition now includes current best practices on environmental, operational, and maintenance investigation, a computerized grading system compatible with European defect coding systems, and new design methods for renovation techniques (WRc 2001). The fourth edition is divided into two volumes. Volume 1 deals with the determination of the structural performance of sewers, survey techniques, and procedures for assessing
deterioration and collapse mechanisms, analysis of hydraulic performance, and maintenance planning. Volume 2 deals with new renovation techniques and structural design methods for sewer renovation.
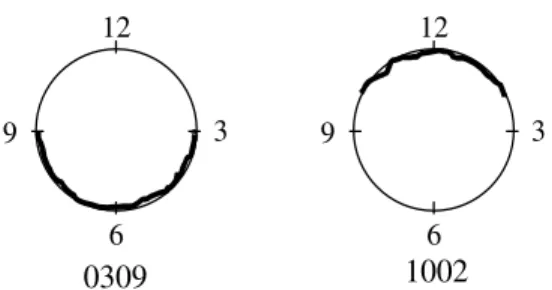
3.1.1 Defect Location
The WRc’s condition classification manual, third edition (1993) introduced a unique method to identify defect location from the CCTV inspection data called the “clock reference method.” The clock reference method for images is shown in Figure 2, where the light line is for original shape and the dark line represents the distorted shape of the pipe. The twelve o’clock position locates the top of the sewer pipe and six o’clock locates for bottom part of the pipe. For example, 0309
(three o’clock to nine o’clock) indicates that the bottom half section of the pipe has problems with either structural or operational defects. And 1002 (ten o’clock to two o’clock) indicates that defects are located at the top on the sewer pipe.
12 3 6 9 0309 1002 12 3 6 9
Figure 2. Clock References for Defect Location
3.1.2 Deduct Values and Condition Grades
The WRc determines the condition of a pipe based on structural and operational2 defects
obtained from the CCTV and person entry inspections. The WRc protocol assigns deduct values for various defects (both structural and operational) ranging from 1 to 165, then it assigns condition grades from 1 to 5 for predetermined deduct value ranges as shown in Table 3. The WRc suggests using the peak deduct values (worst defect) in determining condition grade.
Table 3. Deduct Value Ranges for Condition Grades
Condition Grade 1 2 3 4 5
Structural <10 10 – 39 40 – 79 80 – 164 165 and >
Operational <1 1 – 1.9 2 – 4.9 5 – 9.9 10 and >
3.1.3 Criticality
The WRc manual classifies sewers into three categories: A, B, and C, based on criticality issues. The category depends on the size of the sewer, traffic flow above the sewer, depth of the sewer, soil conditions, and location of the services (e.g., hospital zone, industrial zone, beneath
highways). For sewers in Category A, the failure cost (both direct and indirect) would be
extremely expensive and the loss of the asset would be critical to the municipality or utility. With Category B, the failure cost would be less than for Category A. The Category C failure cost would be the least expensive. For example, a deep sewer in bad ground conditions with a high traffic flow is rated as Category A, whereas, a shallow sewer in good ground conditions in a low traffic route is rated as Category B (WRc 2001).
3.2 National Research Council of Canada (NRC)
The Institute for Research in Construction (IRC) of the NRC recently published Guidelines for
Condition Assessment and Rehabilitation of Large Sewers (Zhao et al. 2001). Researchers from the IRC and several municipal partners from Canada worked together to develop these guidelines for practitioners and sewer system managers. The condition assessment methods are limited to large sewers, defined as sewers of 900 mm diameter and larger. The NRC Guidelines define
2
various structural and operational defects along with a number of severity levels, as per the WRc. It also provides detailed definitions of common defects (with a mnemonic defect coding system), as well as sewer inspection and rehabilitation techniques.
3.2.1 Deduct Values and Condition Grades
The deduct values assigned for various defects are used to calculate the condition grade of the pipe segment. The deduct values range from 1 to 20 for structural defects and 1 to 10 for operational defects as shown in Table 4. Six condition ratings (grades) are proposed for both structural and operational conditions: 0 – excellent, 1 – good, 2 – fair, 3 – poor, 4 – bad, and 5 – failure or collapse imminent.
Table 4. Deduct Value Ranges for Condition Grades - NRC
Condition Grade 0 1 2 3 4 5
Structural 0 1 – 4 5 – 9 10 – 14 15 – 19 20
Operational 0 1 – 2 3 – 4 5 – 6 7 – 8 9 – 10
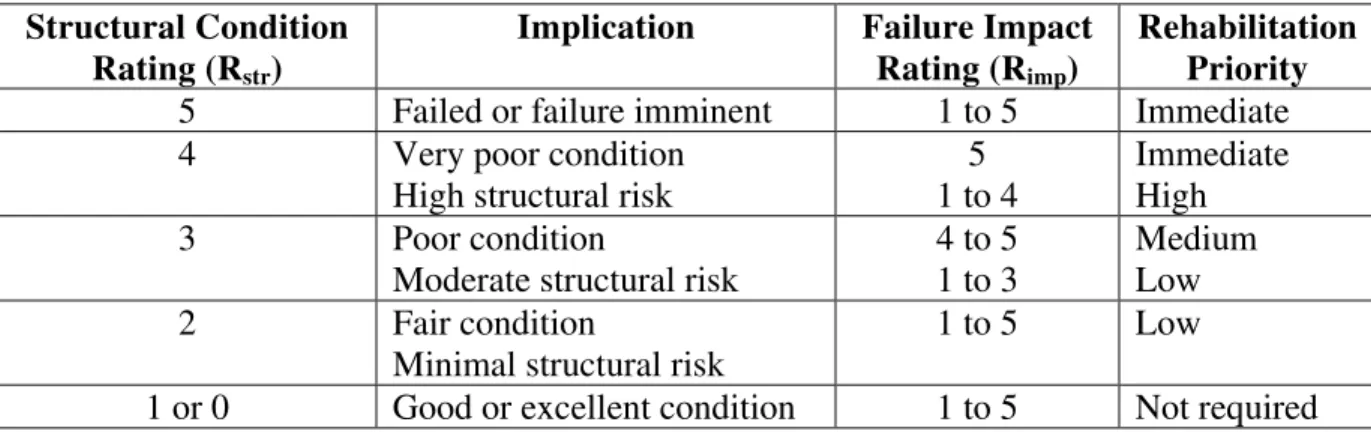
3.2.2 Rehabilitation Priority Selection
The NRC Guidelines also propose failure impact factors for spatial contexts (location, soil type) and global contexts (size, depth, zone and function). Adding up these factors provides the failure impact rating, which in combination with the structural condition rating, assists in decision making for rehabilitation/renewal priority selection. Table 5 summarizes the rehabilitation priority based on the structural condition and failure impact ratings (Zhao et al. 2001).
Table 5. Rehabilitation Priority
Structural Condition Rating (Rstr)
Implication Failure Impact
Rating (Rimp)
Rehabilitation Priority
5 Failed or failure imminent 1 to 5 Immediate
4 Very poor condition
High structural risk
5 1 to 4
Immediate High
3 Poor condition
Moderate structural risk
4 to 5 1 to 3
Medium Low
2 Fair condition
Minimal structural risk
1 to 5 Low
1 or 0 Good or excellent condition 1 to 5 Not required
The NRC Guidelines also provide examples of condition assessment for access holes (types of defects, physical condition coding, rehabilitation methods) and a data management format (suggested fields, data access, updating, and maintenance). Innovative rehabilitation methods are also illustrated with examples of rehabilitation costs from case studies. The NRC Guidelines
were published before the release of WRc, 4th Edition (2001).
3.3 City of Winnipeg – Sewer Management Study
Winnipeg’s Sewer Management Study (2001) describes existing approaches to manage sewer infrastructure and recommends a best management practice. The study is based on the WRc’s
SRM (2nd Edition) and a modified condition grading system developed by NAAPI for Winnipeg. The study is divided into three volumes. Volume I provides an overview of Winnipeg’s Sewer Management Study, an integrated approach to sewer rehabilitation, inspection, and monitoring of sewer condition, as well as a recommends sewer condition assessment protocol for Winnipeg. Volume II describes details of available rehabilitation technologies and their application, including trenchless technologies. A generalized design procedure dealing with direct and indirect costs (social cost) is presented. Volume III describes and recommends sewer
maintenance strategies, benefits of maintenance, implementation concerns, and maintenance cost issues.
3.3.1 Deduct Values and Condition Grades
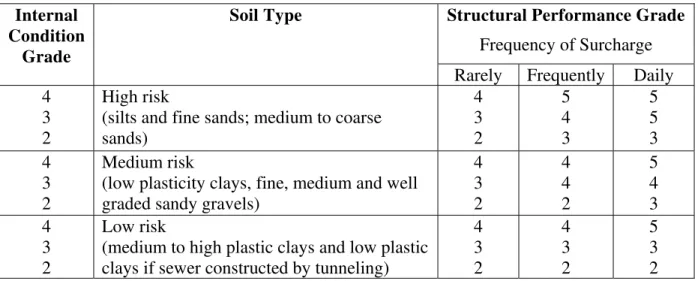
The study assigns deduct values ranging from 0.1 to a maximum of 165 for individual defects and condition grades from 1 to 5, which is similar to the second edition WRc (WRc 1986). The study also suggests that it is essential to determine the internal condition grade (ICG) from field inspections and from the values deducted for defects. The grade should then be converted to a final structural performance grade (SPG) based on risks related to soil type and the frequency of surcharging as described in Table 6 (also described in WRc 1994).
Table 6. Effects of Soil Types and Frequency of Surcharge on SPG
Structural Performance Grade
Frequency of Surcharge
Internal Condition
Grade
Soil Type
Rarely Frequently Daily 4
3 2
High risk
(silts and fine sands; medium to coarse sands) 4 3 2 5 4 3 5 5 3 4 3 2 Medium risk
(low plasticity clays, fine, medium and well graded sandy gravels)
4 3 2 4 4 2 5 4 3 4 3 2 Low risk
(medium to high plastic clays and low plastic clays if sewer constructed by tunneling)
4 3 2 4 3 2 5 3 2 3.3.2 Criticality
The study classifies the criticality of sewer systems as A, B, or C based on overall cost (sum of both direct and indirect costs). Category A sewers are those where the overall cost for post-failure repair is greater than six times the planned repair cost. For Category B, the cost is three to six times, and for Category C, the overall cost is less than three times the planned repair costs. The report also describes the criticality of sewers for repair cost factors based on the sewer pipe diameter, the depth of the sewer, ground conditions, and traffic volumes, as was done in the WRc protocol.
The report gives a three-step screening process to characterize the sewer category. First, identify minimum information on the sewer. Then calculate the potential repair costs and overall costs.
The Winnipeg study also includes examples of typical collapse mechanisms and recommends inspection frequencies that consider the criticality and condition grades of the sewers.
3.4 City of Edmonton
Edmonton developed the Standardized Sewer Condition Rating System Report (Edmonton 1996a) in conjunction with its Sewer Physical Condition Classification Manual (SPCCM)
(Edmonton 1996b). Both are based on the WRc 2nd Edition (1986) and include specific
Edmonton modifications. The SPCCM is used to evaluate Edmonton sewer pipe conditions, and this information is then used to establish priorities for investment in rehabilitation or renewal. The SPCCM provides defect descriptions for various severity levels and shows examples of CCTV images, along with defect diagrams, to facilitate the preparation of inspection reports.
3.4.1 Deduct Values and Condition Grades
The Standardized Sewer Condition Rating System Report presented a comprehensive physical condition rating system for structural and operational defects to ensure consistent reporting from different inspection agencies. It defined each defect and severity level and provided deduct values for specific defects to calculate defect scores for final grading. Edmonton assigns these values ranging from 1 to 115 for structural defects and 1 to 3 for operational defects. Edmonton’s system estimates the rating for total, mean and peak defect scores and uses the highest rating of the three scores to determine the overall condition grade for the pipe. The condition grades proposed are 1 to 5, where 1 stands for excellent and 5 for worst (collapse) condition.
3.5 NAAPI and NASSCO
Both NAAPI and NASSCO protocols use WRc, as described earlier. As such, it was not necessary to review these protocols in this report.
NAAPI uses the Manual of Sewer Condition Classification developed by WRc (1993). NAPPI offers a CCTV operator certification course that includes topics such as: CCTV inspection and review, and the positioning and focusing of cameras, as well as proper lighting. The course includes instructions on computerized defect scoring/grading system.
NASSCO has implemented its PACP (NASSCO 2004) to standardize evaluating and rating of sewer pipes using CCTV inspection. NASSCO has also developed data format and mapping symbology standards. NASSCO condition grading system is based on WRc and considers only internal pipe conditions and has condition grades for both structural defects and operation and maintenance defects. Each defect code is assigned a condition grade from 1 to 5 (1 for excellent and 5 for failed) using its PACP Condition Code Matrix. The overall pipe rating is calculated from the sum of peak scores for the contributing pipe segments.
4 Comparison and Discussion of Protocols
The existing sewer condition assessment protocols described in the previous section differ in how the defect coding, deduct values for defects and condition grading, definitions of criticality, and assignment of prioritization are determined. These differences are highlighted in the
Table 7. Comparison of Defect Coding for Sewer Pipes
Defects Distress Level Defect Codes
Structural NRC Edmonton WRc
Deformation
• Light (<5% change in diameter) DL DL D • Moderate (5%–10% change in diameter) DM DM D Deformation
(D)
• Severe (11%–25% change in diameter) DS DS D Crack Longitudinal
• Light (up to 3 cracks, no leakage) CLL
• Moderate (>3 cracks, leakage) CLM CM CL Crack Circumferential
• Light (up to 3 cracks, no leakage) CCL CL
• Moderate (>3 cracks, leakage) CCM CC Crack Diagonal
• Light (up to 3 cracks, no leakage) CDL • Moderate (>3 cracks, leakage) CDM Crack (C)
Crack Severe (multiple cracks, leakage) CS CS CM
Joint Displacement
• Light (<1/4 pipe wall thickness) JDL JL
• Moderate (1/4 – ½ pipe wall thickness) JDM JM JDM • Severe (>½ pipe wall thickness) JDS JS JDL Joint Opening
• Light (<10 mm, gasket in place) JOL OL
• Moderate (10 to 50 mm, gasket off, leakage) JOM OM OJM Joint Defects
(J)
• Severe (>50 mm, soil visible, leakage) JOS OS OJL
Operational (serviceability) NRC Edmonton WRc
• Light (fine roots, reduction in diameter <10%, F- fine roots, J-joint)
RL RL RF(J) • Moderate (reduction in diameter 10% – 25%, T-
tap roots over 10mm thick)
RM RM RT(J) Root (R)
• Severe (reduction in diameter >25%, M-mass, J- joint)
RS RS RM(J) • Light (reduction in diameter <10%) Edmonton
uses B for Blockage
DEL BL DE • Moderate (reduction in diameter 10% – 25%, S-
silt, G- grease)
DEM BM DE(S,G) Debris (DE)
• Severe (reduction in diameter >25%) DES BS DE • Light (reduction in diameter <10%, J- joint) EL EL EL(J) • Moderate (reduction in dia.10% – 25%, J- joint) EM EM EM(J) Encrustation
(E)
• Severe (reduction in diameter >25%, H- heavy, J- joint)
ES ES EH(J) • Light (reduction in diameter <10%) PL PL
• Moderate (reduction in diameter 10%-25%) PM PM Protrusion (P)
• Severe (reduction in diameter >25%) PS PS
• Light (S- seeping, D- dripping, J- joint) IL IL IS(J), ID(J) • Moderate (R- running, J- joint) IM IM IR(J) Infiltration (I)
4.1 Defect Coding Systems
The various defects and differences in defect coding for common structural and operational defects from the three protocols in use in Canada are compared in Table 7. As can be seen, Edmonton’s coding system uses a two-letter notation while the NRC and the WRc coding systems use two-or three-letter notations. In both notations, the first letter represents the type of defects and the second and third letters represent the defect orientation or severity level.
4.2 Defect Deduct Values
Deduct values for defects for any one protocol should be assigned in a consistent manner. Table 8 presents a comparison of the ranges of values for structural and operational defects.
Table 8. Ranges of Deduct Values for Sewer Condition
Protocols WRc NRC Edmonton Winnipeg
Structural Defects 1 - 165 1 - 20 1 - 115 0.1 - 165
Operational defects 1 - 20 1 - 10 1 - 3 -
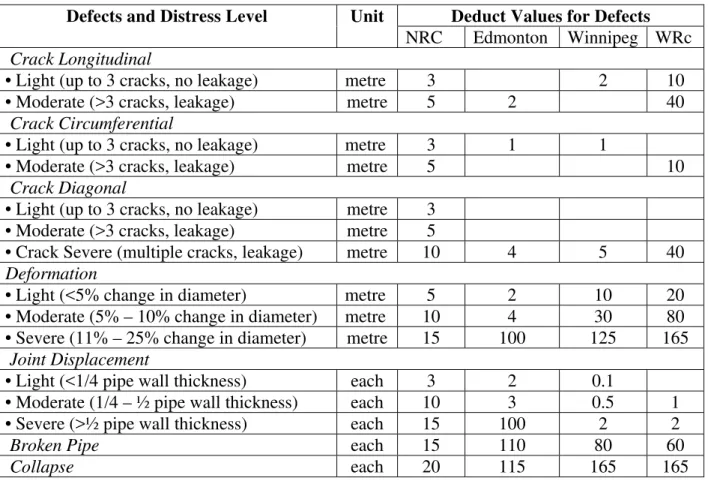
The comparisons of values for a number of the structural and operational defects are shown in Tables 9 and 10, respectively. Defects such as cracks, deformation, fractures and surface damage are measured by unit length. Other defects, such as broken pipes, deformation, joint defects, and collapses are measured by number of defects.
Table 9. Comparison of Deduct Values for Structural Defects
Deduct Values for Defects Defects and Distress Level Unit
NRC Edmonton Winnipeg WRc
Crack Longitudinal
• Light (up to 3 cracks, no leakage) metre 3 2 10
• Moderate (>3 cracks, leakage) metre 5 2 40
Crack Circumferential
• Light (up to 3 cracks, no leakage) metre 3 1 1
• Moderate (>3 cracks, leakage) metre 5 10
Crack Diagonal
• Light (up to 3 cracks, no leakage) metre 3
• Moderate (>3 cracks, leakage) metre 5
• Crack Severe (multiple cracks, leakage) metre 10 4 5 40
Deformation
• Light (<5% change in diameter) metre 5 2 10 20
• Moderate (5% – 10% change in diameter) metre 10 4 30 80
• Severe (11% – 25% change in diameter) metre 15 100 125 165
Joint Displacement
• Light (<1/4 pipe wall thickness) each 3 2 0.1
• Moderate (1/4 – ½ pipe wall thickness) each 10 3 0.5 1
• Severe (>½ pipe wall thickness) each 15 100 2 2
Broken Pipe each 15 110 80 60
It was found that the values and severity levels used by the various organizations in this review differ for the same defect. For example, a severe crack (i.e., presence of multiple cracks and leakage) is assigned 10 out of 20 by NRC, 4 out of 115 by Edmonton, 5 out of 165 by Winnipeg, and 40 out of 165 by WRc as shown in Table 9. The fourth edition of the WRc manual (2001) does not provide any deduct value for infiltration, because the deduct values for the water entering the sewer system through cracks, fractures, breaks, and displaced or open joints are accommodated using structural deduct values (Table 10).
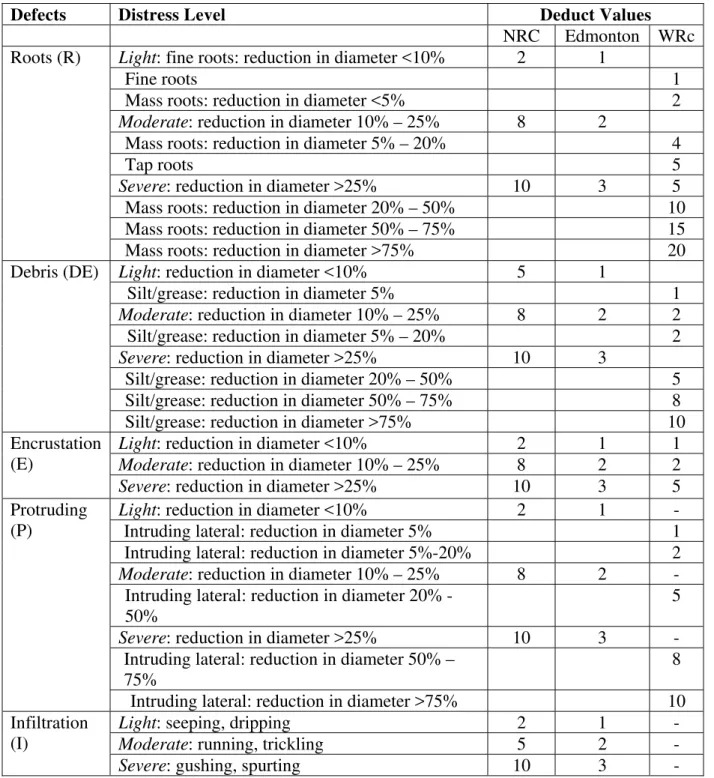
Table 10. Comparison of Deduct Values for Operational Defects
Defects Distress Level Deduct Values
NRC Edmonton WRc
Light: fine roots: reduction in diameter <10% 2 1
Fine roots 1
Mass roots: reduction in diameter <5% 2
Moderate: reduction in diameter 10% – 25% 8 2
Mass roots: reduction in diameter 5% – 20% 4
Tap roots 5
Severe: reduction in diameter >25% 10 3 5
Mass roots: reduction in diameter 20% – 50% 10
Mass roots: reduction in diameter 50% – 75% 15
Roots (R)
Mass roots: reduction in diameter >75% 20
Light: reduction in diameter <10% 5 1
Silt/grease: reduction in diameter 5% 1
Moderate: reduction in diameter 10% – 25% 8 2 2
Silt/grease: reduction in diameter 5% – 20% 2
Severe: reduction in diameter >25% 10 3
Silt/grease: reduction in diameter 20% – 50% 5
Silt/grease: reduction in diameter 50% – 75% 8
Debris (DE)
Silt/grease: reduction in diameter >75% 10
Light: reduction in diameter <10% 2 1 1
Moderate: reduction in diameter 10% – 25% 8 2 2 Encrustation
(E)
Severe: reduction in diameter >25% 10 3 5
Light: reduction in diameter <10% 2 1 -
Intruding lateral: reduction in diameter 5% 1
Intruding lateral: reduction in diameter 5%-20% 2
Moderate: reduction in diameter 10% – 25% 8 2 - Intruding lateral: reduction in diameter 20%
-50%
5
Severe: reduction in diameter >25% 10 3 - Intruding lateral: reduction in diameter 50% –
75%
8
Protruding (P)
Intruding lateral: reduction in diameter >75% 10
Light: seeping, dripping 2 1 -
Moderate: running, trickling 5 2 -
Infiltration (I)
Figures 3, 4 and 5 show the relative percentages of the deduct values for the various levels of structural defects (refer to Table 7 for a description of the defect codes). Figure 3 shows light and moderate level structural defects; each protocol assigns values below 25% of the maximum deduct value for light defects and 25% to 50% for moderate defects. The values for light and moderate level defects in Edmonton and Winnipeg are significantly lower than in other
protocols. The NRC assigns deduct values of 50% of the maximum or collapse value for most of the moderate-level defects as shown in Figure 3.
0 20 40 60 CL Lig ht CL Mo dera te CC Lig ht CC Mo dera te FL Lig ht FL Mo dera te FC Lig ht FC Mo dera te D L igh t D M ode rate JD Lig ht JD Mo dera te JO Lig ht JO Mo dera te H L igh t H M ode rate
Light and Moderate Structural Defects
WRc NRC
Edmonton Winnipeg
Figure 3. Comparison of Light and Moderate Structural Defects
A similarly wide variation, for severe-level structural defects is observed among the protocols under comparison, even though most of the severe defects lead to collapse (Figure 4). For example, there is a close agreement between all protocols for “Deformation Severe” whereas there is little agreement for “Fracture Multiple.” It is notable that Edmonton and Winnipeg assign lower deduct values than the other protocols for severe defects like a crack, fracture, or joint opening. Exceptions are observed for defects like “Deformation Severe” and “Joint Displacement Severe” for which Edmonton assigns 87% of the maximum deduct score, and Winnipeg assigns 76% of the maximum score for “Joint Displacement Severe”. “Surface Damage” includes corrosion, wear and spalling for which Edmonton imposes the lowest value (3.5%) compared to other protocols such as the NRC (73%) and the WRc (75%). In another example, for “Broken Pipe” Edmonton assigns 96% of the maximum deduct score, which is very close to the collapse value, whereas the NRC, WRc and Winnipeg assign 75%, 36%, and 48%
Relative % of Ma
respectively, as shown in Figure 4. 0 20 40 60 80 100 Cra ck Fra ctu re M ultip le De form atio n Join t D isp lace me nt Join t O pen ing Su rface Da ma ge Bro ken Pip e Co llap se
Severe Structural Defects
WRc NRC
Edmonton Winnipeg
Figure 4. Comparison of Severe Structural Defects
Operational defects play an important role in the overall performance of a sewer system. The comparisons of deduct values for operational defects for light, moderate, and severe distress levels are shown in Figure 5. The light, moderate, and severe distress levels for each type of defect are represented as a relative percentage of the maximum score (100%). It is noticeable from Figure 5, that operational light-level defects range from 10% to 33%, and moderate-level defects range from 50% to 80% of the maximum deduct value by the respective protocols. Edmonton suggests higher deducts for most of the light-level defects while the NRC provides higher deducts for most of the moderate-level defects as shown in Figure 5. It is also noticeable that the values for functional defects follow relatively similar increments corresponding to the higher severity level.
0 20 40 60 80 100 R L igh t R M ode rate R S eve re DE Lig ht DE Mo dera te DE Se vere E L igh t E M ode rate E S eve re P L igh t P M ode rate P S eve re I Lig ht I M oder ate I S eve re WRc NRC Edmonto n
Figure 5. Comparison of Light, Moderate and Severe Operational Defects
Relative % of Ma
ximum Deduct Values
Relative % of Ma
4.3 Comparison of Condition Grades
Condition grades are normally a scale of numerical values derived from defect severity and impact on service life. Each protocol examined in this report calculates the condition grades based on the defect coding and deduct values. Typical condition grades for sewer pipes vary from 1 to 5: 0-1 for excellent, 2 for good, 3 for fair, 4 for poor, and 5 for collapsed or collapse imminent condition. A comparison for condition grading ranges is shown in Table 11.
Table 11. Condition Grading System
Protocols WRc NRC Edmonton Winnipeg
Condition Grading Range 1 - 5 0 - 6 1 - 5 1 - 5
The condition grade is the estimated condition based on the defect scores or deduct values. A comparison for total, mean, and peak score ranges for Edmonton and Winnipeg is shown in Table 12. An inconsistency was found in how the Edmonton peak score related to the pipe grade. The maximum deduct value under Edmonton protocol is 115; however, only a deduct value of 5 is required to categorize the pipe as the worst condition grade of 5. With all other protocols under comparison in this report, the condition grades are determined from a range of defect scores, depending on the severity of the defects and assigned deduct values. Comparisons of peak deduct value ranges for structural and operational defects for the WRc and NRC are shown in Table 13.
Table 12. Comparison of Peak, Mean and Total Scores
Condition Grade
Peak Score Mean Score Total Score
Winnipeg Edmonton Winnipeg Edmonton Winnipeg Edmonton
1 <10 <1.0 <0.3 <0.5 <20 <100
2 10 – 59 1.0 – 2.0 0.3 – 1.49 0.5 – 0.99 20 – 99 100 – 149
3 60 – 99 2.1 – 3.0 1.5 and > 1.0 – 1.49 100 and > 150 – 199
4 100 – 149 3.1 – 5.0 - 1.5 – 2.49 - 200 – 249
5 150 and > 5.0 and > - 2.5 and > - 250 and >
Table 13. Peak Deduct Values for Condition Grade
Peak Deduct Value Ranges
WRc NRC Condition
Grade
Structural Operational Structural Operational
0 - - 0 0
1 <10 <1 1 – 4 1 – 2
2 10 - 39 1 – 1.9 5 – 9 3 – 4
3 40 – 79 2 – 4.9 10 – 14 5 – 6
4 80 – 164 5 – 9.9 15 – 19 7 – 8
5 165 and > 10 and > 20 and > 9 – 10
The deduct values and related condition grades were studied in detail to examine the impact of different value ranges for the deduct values, and how the different ranges might affect the final condition grade for the same pipe inventory. Sewer pipe inventory data for the City of Edmonton were used to compare the deduct values calculated using the Edmonton and WRc protocols. The
deduct values for the Edmonton structural defects were mapped to the WRc deduct values and the resulting pipe condition grades were compared with the original Edmonton grades. As can be seen in Figure 6, Edmonton’s protocol assigns more pipes to condition 4 or 5 (i.e. poor) than the WRc protocol. In fact, 18% of the Edmonton inventory is at a "poor" condition using the
Edmonton defect categorization as opposed to only 3% when the WRc protocol is applied. The WRc protocol classifies 24% of the pipes at condition grade 3 or "fair" and 73% of the pipes at "good" with a condition grade of 1 or 2. In contrast, Edmonton’s protocol classifies only 2% of pipes as "fair" and 80% of pipes as "good".
0 1000 2000 3000 4000 5000 6000 7000 8000 9000 10000 1 2 3 4 5 Condition Grading WRc Edmonton Num ber of Pipes Good Edmonton 80% WRc 73% Fair Edmonton 2% WRc 24% Poor Edmonton 18% WRc 3% 0 1000 2000 3000 4000 5000 6000 7000 8000 9000 10000 1 2 3 4 5 Condition Grading WRc Edmonton Num ber of Pipes Good Edmonton 80% WRc 73% Fair Edmonton 2% WRc 24% Poor Edmonton 18% WRc 3%
Figure 6. Edmonton’s Condition Grades Mapped to WRc Protocol
4.4 Criticality of Sewers
As described earlier, sewer pipes can also be classified based on criticality issues. The difference between categories A, B, and C have been discussed earlier is this report. Factors affecting critically include sewer construction quality and material, size (diameter), age, location (busy streets, hospitals, and areas with access difficulties), soil condition and high ground water table. A comparison of how a critical sewer is identified in the WRc (2001), the American Society for Civil Engineers (ASCE 1994), and Winnipeg (2001) protocols based on repair cost factors is shown in Table 14. The WRc also identifies the characteristics of sewers that cause higher repair costs: above average depth, bad ground, high water table, brick or stone construction, person entry size and proximity to buildings and underground services (WRc 2001).
Table 14. Typical Critical Sewer Categories
Sewer Category ASCE WRc and Winnipeg
Category A Post-failure rehab cost is greater than 2
times planned renewal cost and 3 to 4 times the cost of rehabilitation
Post-failure rehab cost is greater than 6 times planned repair cost
Category B Less critical but preventive action will
be cost effective
Post-failure cost is between 3 and 6 times the planned repair cost
Category C Less critical and preemptive work will
not be cost effective
Post-failure cost less than 3 times planned repair cost
4.5 Maintenance Prioritization
Determination of the condition grade for any pipe segment or for the entire network is important for maintenance prioritization. A final pipe grade can be determined from the structural and operational deduct values combined with the failure impact factors for the sewer pipes, as proposed by NRC (Zhao et al. 2001). A prioritization system should consider the condition, the criticality of the sewer and the probability of catastrophic failure. For proactive maintenance, a relatively lower condition grade can be considered to initiate repair. Maintenance/rehabilitation prioritization and re-inspection frequencies based on condition grade and criticality are suggested by NRC (Zhao et al. 2001), WRc (2001) and Winnipeg (2001) and are summarized in Table 15.
Table 15. Re-inspection Frequencies and Rehabilitation Priority Selection
Condition Grades Criticality Re-inspection Frequencies Rehabilitation Priority
Category A Category B
5 High N/A N/A Immediate
4 High - 5 years High
3 Medium 3 years 15 years Medium
2 Low 5 years 20 years Low
0 - 1 Low 10 years 20 years Not required
5 Report Summary
Sewer infrastructure is important in our everyday life; however, it is only when failure occurs that this come to the forefront. The importance of a unified and consistent condition assessment protocol for sewer management has been discussed in this report. As noted, findings from the recent surveys conducted on infrastructure issues, especially for sewer infrastructure, focused on condition degradation and operational performance, ageing problems, lack of inventory data, shortage of budget and lack of standards for condition assessment.
The WRc protocol forms the basis for all other protocols in use in Canadian municipalities for sewer condition assessment. This report compares the protocols of the WRc, NRC, Edmonton, and Winnipeg, specifically, defect identification, deduct values for defects, condition grading, criticality issues, and maintenance/rehabilitation prioritization. Structural and operational (serviceability) defects have been considered. Deduct values in all these protocols are assigned according to severity and impact on the integrity of the pipe. These values for distress levels are identified as light, moderate, or severe, and follow in identical increments representing the severity level in each protocol.
The WRc suggests using peak deduct values for the worst defect in the pipe segment. Generally, values for operational defects are lower than structural defects. It is noted that in certain
instances deduct values for light or moderate structural defects are higher than some of the severe operational defects. For example, this might occur if a pipe is blocked with debris or roots that can be readily removed by cleaning; however, from a peak score perspective, this distress might not be considered for any inspection action. So, considering only the peak deduct value does not represent the exact condition and performance status of the pipe. Therefore, it is better to consider structural and operational defects separately and then combine the deduct values into an overall condition grade.
The NRC Guidelines provide a consistent system for condition grading classification and priority selection, but for large sewers only (>900 mm diameter). In the NRC Guidelines it is suggested to consider failure impact factors (for location, soil type, size, depth, zone and function), which is logical and the most appropriate way to prioritize sewer maintenance and rehabilitation.
Winnipeg’s protocol follows NAAPI guidelines, which are very similar to earlier versions of the WRc manual. Edmonton’s defect coding system, deduct values and grading system are similar to the WRc, except for maximum defect score values and deduct value ranges for condition grade determination.
Both NAAPI and NASSCO in North America are based on WRc and are working towards standardization of sewer system inspection and evaluation especially for CCTV methods.
A condition assessment protocol is vital for developing a cost-effective maintenance and renewal plan for sewer infrastructure. There is an urgent need for a generalized protocol as well as for the development of new tools for cost-effective, condition assessment techniques and procedures. Further research is recommended for the development of a unified condition assessment protocol for sewer management for Canadian municipalities and utilities.
6 Concluding Remarks
The different sewer condition assessment protocols and procedures from WRc, NRC, Edmonton, and Winnipeg have been identified and compared in this report. As can be seen, it is difficult for a municipality or utility to select amongst the available protocols.
WRc describes a thorough classification of defects with a great range of defect scoring and suggests the use of a peak deduct score to determine condition grade of a particular pipe section. WRc 4th edition provides an extensive description of operational defects and hydraulic problems associated with sewer pipes.
Considering condition assessment methodologies, NRC’s protocol has a methodical way for defining defects and defect coding; it assigns deduct values for severity level of the defects; it has a method to calculate condition rate, it introduces a failure impact rating and it outlines prioritization processes for maintenance and rehabilitation.
Edmonton’s protocol follows WRc for defect coding and for assigning deduct values; however it
differs with its assignment of deduct values. Winnipeg’s protocol follows the 2nd edition of WRc
very closely.
At this time, it is difficult to recommend one specific protocol over another. WRc is in wide usage in many municipalities across Canada, whereas the NRC Guidelines are relatively new. The procedures used in Edmonton and Winnipeg were adapted from different versions of the WRc protocol and appear to be similar. It is therefore difficult for a municipality or utility to choose the appropriate condition assessment protocol for its sewer infrastructure. It is highly recommended that municipalities or utilities adopt a condition assessment protocol for sewer inspection and rating as soon as possible. This should follow one of the aforementioned protocols.
However, in some instances the municipality must adopt the protocol suggested by their local supplier; in that case, it is recommended that the local supplier be certified (e.g. NAAPI,
NASSCO) and select a protocol that is currently used in the neighbouring municipalities or utilities and that meets their needs for sewer inspection.
The sewer condition assessment domain is in a state of change and the protocols are constantly improving. The WRc protocol would suffice for many municipalities or utilities but could be enhanced locally with the inclusion of NRC’s Failure Impact Rating and its defect coding.
7 Acknowledgements
The authors would like to thank the MIIP Consortium for its support of this research. More specifically, the authors would like to thank the cities of Calgary, Edmonton, Hamilton, Ottawa, and Prince George, the regional municipalities of Durham, Halton, and Niagara, and the
Department of National Defence.
8 References
Allouche, E.N. and P. Freure (2002) Management and Maintenance Practices of Storm and
Sanitary Sewers in Canadian Municipalities, ICLR Research, Paper Series No. 18.
<www.iclr.org/pdf/Management and Maintenance Practices Allouche.pdf> (28 December 2004). ASCE (1994) Existing Sewer Evaluation and Rehabilitation. WEF Manual of Practice FD-6, ASCE Manuals and Reports on Engineering Practice No. 62, American Society of Civil Engineers, New York, USA.
Edmonton (1996a) Standard Sewer Condition Rating System Report, Transportation Department, Drainage Engineering Section, City of Edmonton.
Edmonton (1996b) Sewer Physical Condition Classification Manual, Transportation Department, Drainage Engineering Section, City of Edmonton.
FCM (1996) Report on the State of Municipal Infrastructure in Canada, Available from Federation of Canadian Municipalities and McGill University.
Mirza, S. and M. Haider (2003) DRAFT, The State of Infrastructure in Canada: Implications for
Infrastructure Planning and Policies, McGill University, Montreal, QC, 56p, <www.regionomics.com/infra/Draft-July03.pdf> (16 December 2004).
NACUBO (1990) Managing the Facilities Portfolio, National Association of College and University Business Officers, Washington, DC, 100p.
NAAPI (2004) North American Association of Pipeline Inspectors <http://www.naapi.ca> (31
May 2004).
NASSCO (2004) National Association for Sewer Service Companies <http://www.nassco.org/>
(1 June 2004).
NGSMI (2004) Assessment and Evaluation of Storm and Wastewater Collection Systems, Best Practice Report, National Guide to Sustainable Municipal Infrastructure,
<http://www.infraguide.ca/bestPractices/PublishedBP_e.asp#sw> (20 November 2004). Ottawa (2003) Long-Term Strategy for Asset Management: Report, City of Ottawa, Ottawa, Canada.
Vanier D.J. and S. Rahman (2004) MIIP Client Report: Survey on Municipal Infrastructure
Assets, National Research Council of Canada, Ottawa, Internal Report # B-5123.2, 56p. <http://irc.nrc-cnrc.gc.ca/uir/miip/> (14 November 2004).
Winnipeg (2001) Sewer Management Study: Technical Memoranda for Sewer Condition
Assessment, Sewer Rehabilitation Design, and Sewer Maintenance Management for the City of Winnipeg, July 2001.
Wirahadikusumah, R., D. Abraham, and T. Iseley (2001) Challenging Issues in Modeling Deterioration of Combined Sewers, Journal of Infrastructure Systems, ASCE, Vol. 7, No. 2, pp. 77-84.
WRc (1986) Sewer Rehabilitation Manual, Second Edition, Water Research Centre, UK. WRc (1993) Manual of Sewer Condition Classification, Third Edition, Water Research Centre, UK.
WRc (1994) Sewer Rehabilitation Manual, Third Edition, Water Research Centre, UK. WRc (2001) Sewerage Rehabilitation Manual, Fourth Edition, Water Research Centre, UK. Zhao, J.Q. (1998) Trunk Sewers in Canada, Proceedings of the APWA International Public
Works Congress – Innovations in Urban Infrastructure, Las Vegas, pp. 75-89 <http://irc.nrc-cnrc.gc.ca/fulltext/nrcc42660.pdf> (7 November 2004).
Zhao, J.Q., S.E. McDonald, and Y. Kleiner (2001) Guidelines for Condition Assessment and
Rehabilitation of Large Sewers. Institute for Research in Construction, National Research Council of Canada, Ottawa.