Building Customization Capability by
Lucia T. Wu
B.S.E, Civil Engineering and Operations Research, Princeton University, 1998
Submitted to the Department of Civil and Environmental Engineering and to the Sloan School of Management in Partial Fulfillment of the Requirements for the Degrees of
Master of Science in Civil and Environmental Engineering and Master of Business Administration
in conjunction with the Leaders for Manufacturing Program at the Massachusetts Institute of Technology
June, 2004
©2004 Massachusetts Institute of Technology. All rights reserved.
Signature of Author
Department of Civil and Environmental Engineering Sloan School of Management May 7, 2004 Certified by
David Simchi-Levi, Thesis Supervisor Professor of Civil and Environmental Engineering
Certified by 2
Sara L. Beckman, Thesis Supervisor Senior Lecturer, Haas School of Business, University of California, Berkeley
Certified by ; -.
C eb Donald B. Rosenfield, Thesis Reader
/enior Lectrer, MIT Sloan School of Management Accepted by
I Heidi Nepf, hai an of Committee on Graduate Studies Department of Civil and Environmental Engineering
Accepted by
Margaret Andrews, Executive Director of Masters Program Sloan School of Management
BARKER
1
MASSACHUSETTS INSInTE
OF TECHNOLOGY
JUN
0
7
2004
MITLibraries
Document Services Room 14-0551 77 Massachusetts Avenue Cambridge, MA 02139 Ph: 617.253.2800 Email: [email protected] http://Iibraries.mit.edu/docsDISCLAIMER OF QUALITY
Due to the condition of the original material, there are unavoidable flaws in this reproduction. We have made every effort possible to provide you with the best copy available. If you are dissatisfied with this product and find it unusable, please contact Document Services as soon as possible.
Thank you.
The images contained in this document are of
the best quality available.
BUILDING CUSTOMIZATION CAPABILITY
by Lucia T. Wu
Submitted to the Department of Civil and Environmental Engineering and the Sloan School of Management on May 7, 2004 in partial fulfillment of the Requirements for the
Degrees of Master of Science in Civil and Environmental Engineering and Master of Business Administration
ABSTRACT
Many computer companies are seeking to grow their customization capability. As the market becomes increasingly commoditized, computer companies view customization as
a way to differentiate their products and offer customer value. However, the
implementation of customization programs has been difficult for many organizations. Sun Microsystems launched a customization program called Customer Ready Systems (CRS) through a grass-roots effort in manufacturing. CRS offered assemble-to-order, factory-integrated systems. Although CRS revenues had been growing, scalability was difficult and costs were increasing. CRS needed to evaluate its process and supply-chain from a strategic perspective to ensure alignment with the rest of the organization. To grow profitably, it also needed to reduce costs and increase scalability.
This thesis focuses first on the question of whether or not Sun should reconfigure its supply chain to perform more, if not all, of its customization work at external
manufacturers. It then turns to the question of whether or not the current internal customization process can be improved, and identifies two opportunities: pricing and process improvement in component removal for reconfiguration, and lead-time variability reduction. This thesis recommends organizational and tactical policies to improve the customization based on these analyses and implementation efforts.
The research for this thesis was conducted during a seven month internship with Sun Microsystems' Worldwide Operations group and was affiliated with the Massachusetts Institute of Technology's Leaders for Manufacturing program.
Thesis Supervisor: Sara L. Beckman
Title: Senior Lecturer, Haas School of Business, University of California, Berkeley Thesis Supervisor: David Simchi-Levi
Title: Professor, Civil and Environmental Engineering Thesis Reader: Donald B. Rosenfield
ACKNOWLEDGEMENTS
I would like to thank Sun Microsystems for sponsoring this project, and Systems
Integration for answering all my questions and helping me navigate the organization. In particular, I want to thank Teresa Lemak and John Jennings for their patience and
guidance, Steve Klosterman for making this internship happen, and everyone within CRS and Volume System Products for their time and support.
I would also like to acknowledge the Leaders for Manufacturing Program for providing
me with this experience. Thanks to my advisors, Sara Beckman and David Simchi-Levi, for their guidance and encouragement. Thanks also to my LFM Peer Group, who
supported, consoled, and encouraged me when I needed it.
Finally, I would like to thank my parents, jedge, and fiance Richard for always being a constant source of support, and my cousin Connie for lending me her car so that I could drive to my internship daily. I thank God for the blessing of having all of you in my life.
TABLE OF CONTENTS
ABSTRA CT ... 3
ACKN OW LED GEM EN TS ... 4
TABLE OF CON TENTS ... 5
1 INTRODUCTION ... 7
1.1 Custom ization in the Com puter Industry ... 7
1.2 Operations Strategy and Custom ization at Sun... 9
1.3 Sun's Custom er Ready System s Program ... 13
2 CHALLENGES FACED BY CRS... 16
2.1 CRS Supply Chain and Problem Statem ent ... 16
2.2 Existing CRS Challenges ... 18
2.3 Approach ... 19
3 EVALUATION OF CRS CUSTOMIZATION PROCESS ... 21
3.1 CRS Products and M anufacturing Process... 21
3.2 CRS D em and...23
3.3 Analytical Fram ework... 24
3.4 Quality Results ... 27 3.5 Lead-tim e Results... 30 3.6 Cost... 34 3.6.1 Labor Cost ... 34 3.6.2 Transportation Cost ... 35 3.6.3 Inventory Cost ... 36
3.6.4 Im plem entation Cost ... :...38
3.7 Summary, Other Considerations, and Recommendations...39
4 IMPROVING THE M ATERIALS DEPOPULATION PROCESS ... 42
4.1 M otivation for the Depopulation Study ... 42
4.2 Approach ... 42
4.3 Depopulation Pricing Study ... 43
4.4 The Existing Depopulation Process ... 47
4.5 Key Issues in the Existing Depop Process ... 49
4.6 Options for Im proving the Depop Process... 51
5 M EASURING LEAD-TIME VARIABILITY ... 53
5.1 Existing Lead-Tim e M etrics... 53
5.2 Lead-tim e Inconsistency ... 53
5.3 Lead-Tim e V ariability and Book-to-Ship Breakdown... 54
5.4 Lead-tim e Im pact from Cross-Docking ... 59
5.5 Recom m endations ... 61
6 IMPLEMENTATION CHALLENGES AND PILOT RESULTS ... 65
6.1 Custom ization versus Standardization Strategies ... 65
6.2 The IT Change Request Process and Implications... 67
6.3 Stakeholder M anagem ent... 69
7 CONCLUSIONS AND FUTURE RESEARCH ... 71
7.3 Conclusion...74
APPENDIX 1: STANDARD INVENTORY M IN-M AX M ODEL ... 75
APPENDIX 2: SIMULATION MODEL FOR FAILURE ANALYSIS... 76
1 INTRODUCTION
1.1 Customization in the Computer Industry
The evolution of the computer industry was arguably one of the most important developments of the twentieth century. Moore's law, which states that the number of transistors per square inch of integrated circuits will continue to double annually, implies that the pace of technology change makes fundamental shifts in the industry possible in the span of years versus decades in other industries. This was evident in the last twenty years, where the competitive landscape shifted from one dominated by few, vertically integrated players to one with numerous players competing horizontally building modular components and peripheral products.
Currently, the computer industry is characterized by intense competition, modular designs, and short product lifecycles. Small, focused technology companies have been able to carve out niche markets and compete effectively against large, vertically integrated companies. Efficiency in information transfer, reduction of transportation costs, and learning in developing countries have also resulted in the growth of many low
cost technology companies from developing countries.
The maturation of the computer industry has led to increased commoditization and lower prices. Many companies needed to adapt their operations strategies to reduce costs and
stay competitive. Large computer companies outsourced most component manufacturing to gain cost advantage. For example, the current industry leader Dell only conducts final
assembly in its factories. Dell used its tight operations and supply chain efficiency as sources of competitive advantage.
The success of Dell's direct sales, mass customization business model illustrated that cost leadership was possible even in a customization environment. Dell's model reduced inventory risk caused by short product lifecycles and uncertain demand by delaying final
assembly until after the customer ordered. Dell's direct sales could also be differentiated against the channel strategies followed by most of its competitors, and its success
encouraged many of its competitors to follow by offering customized products through their own direct sales channels.2
However, the transition for many companies to offer customized products through direct sales was not met with enormous success. First, many companies depended on their channel partners for relationships with end customers, and risked alienating their channel partners by increasing direct sales. For example, "Compaq and HP talked a lot about doing it Dell's way but couldn't bear the pain of burning their retail channel."3 Sun and
Cisco "depend too much on their reseller and consultant network to go fully direct - and innovate too much to abandon forecasting entirely."4
Second, execution of a customization strategy was made more difficult when
customization was not considered during the product development process. Configurable options are more easily added to modular products designed for quick assembly and customization compared to integral products not designed to change. This can also be extended to designing for integration; a server designed for optimal performance as a standalone unit may not be optimal when racked with several other servers and storage units.5 Customization and integration considerations should be made in the product design rather than after manufacturing.
Finally, outsourcing manufacturing to overseas companies f6r cost advantage led to higher transportation costs. Using lower cost transit modes and capturing transportation economies of scale became essential to maintaining low costs but also led to extended lead-times. These long lead-times, coupled with uncertain demand, led to high inventory
2 Ira Sager. "Don't Look for Dell's Secrets Here," Business Week, 8 March 1999, [e-journal]
<http://www.businessweek.com/1999/991 0/b3619033.htm>. Michael Schrage. "The Dell Curve," Wired, July 2002, [e-journal] <http://www.wired.com/wired/archive/10.07/dell.html>.
4 Ibid.
5 Karl T. Ulrich and Steven D. Eppinger, Chapter 9, "Product Architecture," Product Design and
and obsolescence costs when used with traditional inventory policies and build-to-stock models. Many companies responded by developing delayed differentiation or
postponement models.
Despite these challenges, many computer companies are seeking to grow customization capability. As the computer industry continues to mature, companies must seek new ways to differentiate their products. Six Sigma and other quality initiatives focus on "delighting the customer"; customization is seen as one way means that a company can add value to customers. An efficient customization program enables a company to delight customers by giving them what they want and to collect customer information that can be used to develop new products.
1.2 Operations Strategy and Customization at Sun
Sun Microsystems is a computer company focused on network computing products. The company vision, "everyone and everything connected to the network,"6 defines Sun's core mission: to provide an infrastructure of scalable and reliable systems required to support network computing. Sun's products include network storage systems and high volume computer systems such as servers,'UltraSPARC microprocessors, desktops, and workstations. Sun also offers enterprise infrastructure, development software, and professional and educational services. Figure 1.1 illustrates a high level overview of
Figure 1.1: Sun's Product Lines Sun Products Volume System Products Hardware Network Enter Storage Syst Software prise ems
Sun had approximately $11.4 billion in net revenues during fiscal year 2003, compared to $12.5 billion in 2002 and $18.3 billion in 2001. Revenue declines reflect the economic downturn. Sun is also being pressed by its competitors (IBM, HP, Dell), and lost 4% market share in servers between 2002 and 2003.
Sun is a matrixed organization; employees belong to central functional groups such as Operations, Sales, or Marketing, but work on specific vertical business units that support individual product lines (see Figure 1.2).
Figure 1.2: Sun Matrix Structure
Sun's competes on product differentiation through technology innovation in end-to-end network computing systems. In order to execute on its differentiation strategy, Sun
7 This chart has been generated for clarification purposes for this thesis only, and does not represent Sun's
actual product line categorization or organizational structure.
Services
--invests heavily in research and development. In 2003, Sun invested about 16%8 of its
revenue in R&D expenses, compared to 1-1.5% for Dell and 5% of HP, for example.9
Sun conducts a significant percentage of its business through value-added resellers, channel development providers, system integrators, and independent distributors. It sells directly only to large corporate customers. In the past few years, Sun sought to reduce costs by reducing the number of system configurations and increasing standardization to simplify manufacturing processes.10
In 2003, Sun had three manufacturing facilities in California, Oregon, and Scotland, and three distribution centers, in California, the Netherlands, and Japan. In 2004, Sun was
seeking to transform its fulfillment model from centralized distribution centers to a direct ship and cross-dock model. Sun also announced manufacturing consolidation and began to move its California manufacturing operations to Oregon and Scotland. These decisions were made to reduce cost and inventory risk, and supported Sun's overall strategy of focusing on product development while partnering with external manufacturers and channel partners for manufacturing and distribution.
All Sun volume servers and some network storage were externally manufactured and built-to-stock with push supply chains. Sun also sole sourced the manufacturing of integral components such as SPARC microprocessors. Generally, production
requirements for all products were set in advance based on forecasted supply plans. In some cases, Sun used min-max models to determine the optimal inventory levels in its distribution centers. However, many suppliers operated under Sun's demand
replenishment program that required short replenishment lead-times. These suppliers had product hubs located near Sun's distribution centers. Theoretically, no safety stock
existed for these products in Sun's distribution centers.
8 Sun suffered lower revenues in 2003; historically, it spends about 10% of net revenue on R&D.
9 Martha Toll-Reed. "Why Dell Eclipses Sun," Business Week, 10 September 2003, [e-joumal] <http://www.wired.com/wired/archive/10.07/dell.html>.
In order to limit the inventory risk of its push supply chain for volume products, Sun limited the number of configurations offered to three standard configurations: small, medium, or large. Options such as additional memory, PCI cards, and graphics cards that could be added to these configurations were sold separately. These options were
sometimes standardized across product lines, therefore enabling aggregation of options for supply planning. Despite these policies, inventory obsolescence continued to be a challenge requiring careful management, not only of Sun's internal inventory, but also in the inventory held by its downstream channel partners.
Sun's volume server group offered some customization among low-end servers through its external manufacturers in its external assemble-to-order (XATO) program. Customers could select the processor size, memory size, disk drives, and operating system from a list of available options rather than ordering a predetermined small, medium, or large
configuration. In general, these customized servers had higher prices and longer lead times than the standard configurations, and represented a small percentage of total sales.
Sun's enterprise servers are high-end servers with more than eight processors. These servers often contain racked storage units. Enterprise servers were all manufactured internally using an assemble-to-order, or pull, model. Sun pulled the customer-specified components out of kanban bins and performed final integration after receiving the
customer order. This supply chain was a push-pull system; building blocks were built-to-stock and stored in supplier hubs, at the Sun distribution center, or in the Sun factory, and pulled to customer order after the order booked. The point where the generic building blocks become part of a customer order, or the push-pull boundary, was located at Sun.
Sun's network storage products were manufactured either internally or by external manufacturers, depending on the product line. Historically, network storage products were all built-to-stock, like the volume servers. More recently, Network Storage
manufactured storage products.
Because product lines were organized vertically, customers could not order integrated Sun products (e.g., volume servers racked on a network storage unit) through Sun directly. Instead, they had to order the systems separately and integrate the systems on their own site using either Sun Professional services or a third-party system integrator. In
2002, Sun launched the Customer Ready Systems (CRS) program to provide systems integration capability across product lines and services. This program offered factory-integrated systems comprised of Sun and third party hardware and software directly to large corporate customers.
1.3 Sun's Customer Ready Systems Program
CRS began as a grass-roots effort within Sun's Enterprise and Network Storage units. Previously, large corporate customers who ordered Sun products spanning different product groups received hundreds of separate boxes and needed to allocate facility space, internal resources, and Sun services personnel to integrate these systems. Because this integration was performed on customer sites often without ESD protection, the
integration sometimes damaged the products. Further, many Sun products were developed independently, without high consideration placed on integration with other
Sun products. These design limitations caused difficulty during integration. As a result, customers desiring integrated systems of Sun products had the perception that Sun products were poor quality.
Members of Sun's Enterprise and Network Storage units realized that the customization being done at customer sites should be done at the Sun factory, with trained personnel
and the appropriate materials, safety, tools, and testing infrastructure. As a result, as a sort of pilot, or experiment, the operations program manager offered to perform factory integration for one key corporate customer. This offer was accepted, and the delivered solution dramatically exceeded the customer's expectations, thus setting the precedent for more factory-integrated systems and the launch of CRS.
CRS systems are assembled-to-order, tested in Sun factories, and shipped to customers in a minimal number of boxes ready to deploy without additional time-consuming and expensive customization and configuration. CRS revenues have been growing, and CRS has been identified as an area of development by Sun's executive management.
Figure 1.3 illustrates how CRS fits into the rest of Sun. Organizationally, CRS is shared by Sun's Enterprise and Services business units. However, CRS uses products from all of
Sun's hardware and software business units. A separate operations group exists for CRS responsible that is responsible for the manufacturing and fulfillment of CRS orders. Although Operations is a centralized functional group at Sun, people working within
Operations are allocated to support specific business units. Therefore, the Operations group for CRS operates relatively independently of the other operations groups.
Figure 1.3: CRS at Sun
Sun
HardaeSfae Services
Operations Volume Storage Enterprise
Volume CRS Operations Storage Operations Enterprise 0 Oe rat ionsI CRS Operations
This thesis is based on research conducted during a seven-month internship in the CRS Operations group. It evaluates Sun's implementation of customization through CRS and discusses the challenges involved in growing mass customization capability. Chapter 2 describes Sun's Customer Ready Systems program in more detail and the operations and
supply chain challenges faced by the CRS Operations group. Chapter 3 describes the results of an analysis conducted to determine where customization should begin in the supply chain for integrated products. Chapters 4 and 5 describe related analyses and improvement activities completed. Chapter 6 describes the challenges associated with implementing the process change. Chapter 7 concludes with thoughts to bear in mind when launching a customization strategy and offers suggestions for future projects.
2 CHALLENGES FACED BY CRS
2.1 CRS Supply Chain and Problem Statement
Figure 2.1 shows the CRS supply chain for 2003. (CRS is represented as the "Sun
Factory - Custom Systems.") CRS Suppliers include all existing Sun and some additional third party suppliers. Sun suppliers include commodities and options suppliers for
components such as memory, hard drives, and PCI cards; and the contract manufacturers of volume servers and storage. All Sun standard products (used as building blocks for the custom systems) are pulled from the distribution center, while unique third party parts are
shipped directly to the factory. Depending on the timing and order, CRS solutions are either shipped directly to the customer from the factory, or shipped back to the distribution center. Although historically in the US CRS customers have been large, corporate customers, CRS can also provide solutions to Resellers.
Figure 2.1: Sun's CRS Supply Chain (US)
Suppliers
Sun
Customers
Commodities Distribution
and Options Center > Resellers
(Parts) (Finished Goods)
Contract Sun Factory
End
(Standard Sysms) (Custom Systems) Customers
Third Party (Parts)
Sun is transforming its fulfillment network in the United States from one with centralized distribution center to a cross-docking model in 2004. Under the cross-dock model, no
finished goods inventory will be stored at the cross-dock; Sun suppliers will hold most finished goods inventory and, whenever possible, ship directly to Resellers or End
Customers. The cross-dock is a location for order aggregation when necessary rather than for warehousing; any product coming into the cross-dock is already allocated for a
customer order. The implication for CRS is that the inventory of standard systems from which it draws today will now be located at the suppliers of those systems.
The CRS supply chain is a push-pull system (see Figure 2.2). Sun standard components are built-to-stock, and demand forecasts are aggregated across all product lines. When a CRS order books, standard components are pulled from the distribution center into the Sun factory. The solution is then customized and integrated to order, tested, and shipped.
Figure 2.2: CRS Push-Pull Boundary Push - Pull
Boundary
Push Pull
Suppliers Customers
Standard systems are built Standard systems are pulled from to stock based on forecast stock and integrated to order
from Product Groups through CRS
Differentiation Point: Sun Factory
Most of the solutions built by CRS involve volume servers integrated with storage units. Many volume servers could also be individually customized with configurable options; that is, customers can add additional memory, hard drives, or PCI cards. CRS was considering using Sun's external manufacturers for some of the volume server
customization, thereby moving the push-pull boundary to the external manufacturer. Customized boxes would be pulled into the factory for final integration. The -implications of this change needed to be understood for both CRS and for Sun as a whole.
CRS wanted to determine the optimal process balance between customization done at Sun external manufacturers and that done at Sun. However, analyzing this question revealed other questions and improvement opportunities that could be analyzed to increase the customization capability. As a result, a more generic project goal was defined. This thesis seeks to evaluate the CRS customization process, identify areas for analysis and improvement, reflect on implementation efforts, and make some
recommendations for other organizations seeking to build customization capability.
2.2 Existing CRS Challenges
Existing CRS challenges were identified through interviews with CRS personnel and the Sun groups with which they interfaced. These challenges, like most supply chain pitfalls, arose from lack of information, operational problems, and strategic and design-related issues. I
First, inventory visibility was poor. CRS had little visibility into available inventory, and thus had difficulty predicting customer lead-times. Analogously, product groups had little visibility into CRS demand. At an aggregate level, CRS orders represented a small
percentage of the total product demand for any given product line, so CRS did not alter the aggregate product forecasts from a supply planning perspective. However, individual CRS orders were often for large quantities, and thus could theoretically trigger temporary inventory shortages.
CRS solutions were also highly complex; because of the high number of options,
configurations, and engineering rules, they could not be custom designed by the customer from a website (as Dell desktops can). CRS customer program managers and engineers were required to work with sales account teams and customers to ensure that all the requirements of the integrated solution were fully defined, and that the resulting solution
would be functional. The actual order-entry process was therefore time-consuming, required numerous resources, and limited the program's ability to scale.
"Hau L. Lee and Corey Billington. "Managing Supply Chain Inventory: Pitfalls and Opportunities." Sloan Management Review. Spring 1992, 65-73.
CRS also did not have direct relationships with its suppliers; it worked through other Sun product groups that owned the supplier relationships to obtain material. There were no formal processes in place for CRS to procure materials, which resulted in "discrimination against internal customers."'2 A system glitch treated materials transfers between CRS
and the product groups as internal transfers, which had a lower priority than other customer orders. CRS supply managers relied, instead, on informal processes to secure material to build CRS orders within reasonable lead-times.
Using finished goods from product groups also resulted in excessive waste. Finished goods were fully labeled in expensive packaging with manuals. CRS customers often ordered many servers on a rack, and did not need all the packaging and manuals for each individual server. The excess packaging and manuals needed to be returned or recycled at cost to Sun. Further, CRS orders comprising only box-level reconfigurations could have been customized by the original manufacturer of these servers, but instead were routed through the Sun factory. Many of these orders had relatively high volumes of the same customized configuration. In most cases, CRS had to remove components from the standard systems and add other components according to the customer need.
Finally, most of Sun's Volume Server products (the primary feeders to CRS) operated under a standard configuration strategy, providing only three configurations per product, and driving operations around low cost. CRS, on the other hand, provided high-quality, integrated solutions developed specifically for individual customers. This required scalability and customer satisfaction, but not necessarily a low-cost, efficient supply chain. This misalignment caused some product groups to be slow to invest in projects or to adopt processes that supported the CRS customization business, even when their support may have been more efficient to Sun overall.
2.3 Approach
outsourcing that considered all the variables and presented an analytical answer to the question of how much customization ought to be done where in the supply chain.
Previous attempts had been made to outsource some customization to suppliers for CRS, but had not been fully implemented because of the lack of data to support the business
case.
This research was divided into two sequential parts: Customization Analysis and
Implementation. The analysis portion sought to answer where customization should begin theoretically in the CRS supply chain. The existing process (no supplier customization) was evaluated against two alternatives both involving some level of supplier
customization on the basis of cost, quality, and lead-time using data from historical orders, forecasted supply plans, defect reports, and interviews with operations,
manufacturing, and supplier managers. This analysis was conducted for both the existing supply chain (with a local distribution center) and for the future state with the local distribution acting as a cross-dock rather than storage location. This analysis.also sought to uncover other sources of opportunity and improvement in the customization process and supply chain.
The implementation portion focused on recommendations made from the analysis phase. This included continuous improvement work on existing process, additional investigation of CRS lead-times, and pilot development for integrating customized products into larger
CRS solutions. In any implementation effort, alternatives need to be brainstormed and evaluated based on the impact to the existing business processes and systems. Any business and IT changes required were documented and approved through work with
business process analysts, IT personnel, and product line managers. Organization challenges were also documented and some suggestions were made for building customization capability in any organization.
3 EVALUATION OF CRS CUSTOMIZATION PROCESS
3.1 CRS Products and Manufacturing Process
CRS solutions fall into two product lines: standard products and specialized products. These two product categories require separate order entry systems, processes, and pricing.
Standard CRS solutions comprise of only Sun standard products. Factory integration involves adding custom options, racking, and cabling. Most of the solutions are
Integrated Solutions - Enterprise or Volume System Products (VSP) servers customized with hardware options and then integrated with Network Storage units. VSP servers are either low-end (two or fewer processors) or mid-range (four or eight processors). Integration for these Integrated Solutions often involves racking and cabling. Some
standard CRS solutions are simply customized mid-range VSP servers, with no further integration with other systems. Customization entailed adding, removing, or replacing hardware components on the servers. These are called Single Boxes.
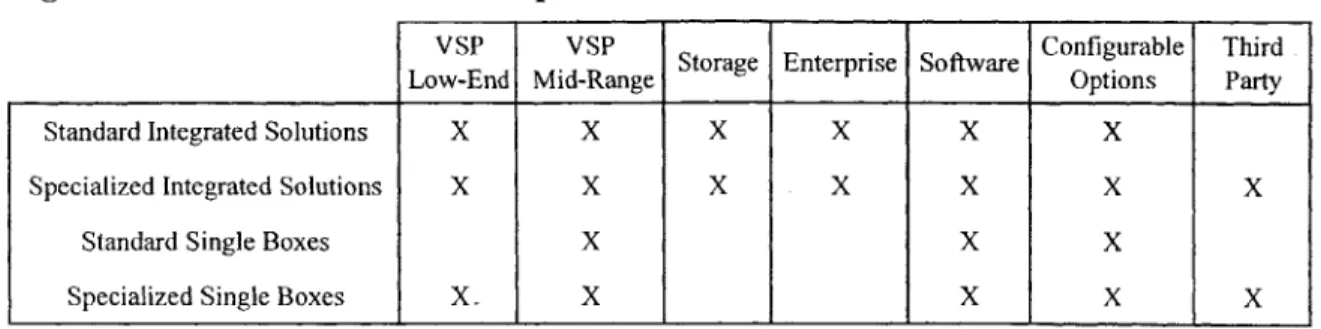
Specialized CRS solutions involve more specialized customization, such as third party hardware, custom software download, or hardware removal (e.g. removing memory from a Sun VSP server). Like the Standard CRS solutions, Specialized CRS solutions are mostly Integrated Solutions - customized VSP servers racked or cabled with Storage units. However, Specialized CRS solutions also have many often Single Box solutions. These include both low-end and mid-range VSP servers customized with some third party parts and/or requiring hardware removal. The table in Figure 3.1 shows the CRS product types with their potential components.
Figure 3.1: CRS Product Make-up VSP
Low-End
VSP S
Mid-Range Storage Enterprise |SoftwareI
Configurable Options I
Third Party
Standard Integrated Solutions X X X X X X
Specialized Integrated Solutions X X X X X X X
Standard Single Boxes X X X
Specialized Single Boxes X X X X X
* Integrated solutions involve integrating some server with some storage (e.g. VSP servers with Storage)
* Single boxes involve customizing one VSP server (e.g. adding software or a configurable option)
The two CRS product types are manufactured on separate lines using separate processes. However, at a high-level, the manufacturing process and supply-chain are the same (see Figure 3.2 for the standard process). Solution components are pulled from the distribution center into the factory; any customization at the box-level is completed, and then the customized servers are integrated with the other systems for the customer solution. After the cross-dock is implemented, it is expected that suppliers will ship CRS materials directly to the factory (rather than through the cross-dock).
Figure 3.2: Standard CRS Manufacturing Process Existing Distribution Center Process
Supplier DC Factory Customer
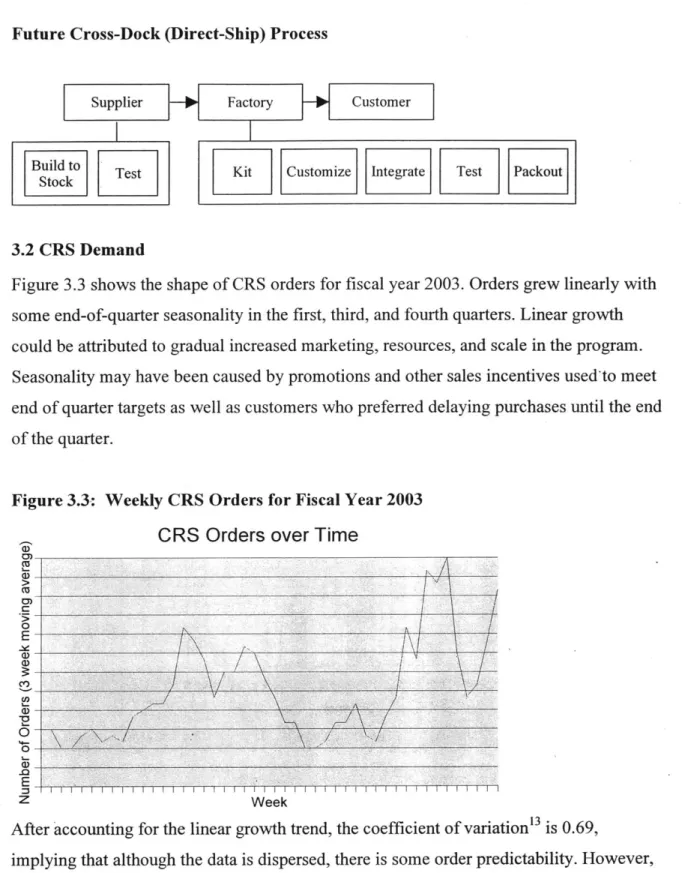
Future Cross-Dock (Direct-Ship) Process
Supplier Factory Customer
Build to Test Kt Customize Integrate Tet Packout
Stock.
3.2 CRS Demand
Figure 3.3 shows the shape of CRS orders for fiscal year 2003. Orders grew linearly with some end-of-quarter seasonality in the first, third, and fourth quarters. Linear growth could be attributed to gradual increased marketing, resources, and scale in the program. Seasonality may have been caused by promotions and other sales incentives used'to meet end of quarter targets as well as customers who preferred delaying purchases until the end of the quarter.
Figure 3.3: Weekly CRS Orders for Fiscal Year 2003
CRS Orders over Time
a) > CU C-0) CU) VV 0-_ Z Week
After accounting for the linear growth trend, the coefficient of variation" is 0.69,
implying that although the data is dispersed, there is some order predictability. However, CRS orders were comprised of over 20 different servers and hundreds of custom options.
Although the aggregate number of orders may be predictable, demand for individual orders are not. Figure 3.4 shows the percentage of total orders that included the top five servers ordered in 2003 by quarter. The relative popularity of these servers ordered through CRS in 2003 changed by quarter, sometimes significantly. For example, Product 2 represented only 5% of total orders in the first quarter, but over 35% in the fourth quarter. Large orders from individual customers could cause unpredictable shifts in demand for specific products. The high number of product offerings, the relatively low volume through the CRS program, and short product lifecycles
Figure 3.4: Quarterly CRS Product Mix for Top Five Product Lines Mix Per Quarter of Top 5 Products
60% 50% 40% -0 E3Q1 30% - *Q2 0Q3 a) Q Q4 20% -a) 10% -0%
Product I Product 2 Product 3 Product 4 Product 5
Product
3.3 Analytical Framework
All CRS customization work took place in the Sun factory and was done by CRS personnel. CRS, however, wanted to evaluate the option of using the assemble-to-order process (XATO) offered by VSP low-end external manufacturers, but needed to
understand the implications of making the change. The approach followed to frame the analysis was:
(2) Identify the relevant evaluation criteria through interviews with CRS personnel (3) Determine how to measure the relevant criteria
(4) Collect the data required for measurement
(5) Measure the results of each alternative
Three customization alternatives were evaluated (See Figure 3.5):
(1) Alternative 1 (Status Quo): Customize Internally -Standard servers are built to stock by the Supplier and then shipped (presently via the distribution center) to the Sun factory, where factory personnel customize and integrate the servers to customer order. This represents the existing strategy.
(2) Alternative 2: Reconfigure Externally - Suppliers build standard products to stock, but these standard products are then customized at the Supplier site to customer order. This implies that standard boxes would still need to be disassembled for reconfiguration. The Sun Factory conducts final integration of these customized servers for integrated systems, but single boxes would be shipped directly to the customer (presently via the distribution center).
(3) Alternative 3: ATO Externally - Suppliers assemble boxes to customer order at the Supplier site. This implies that any server requiring customization would be built as a custom system. Thus, no reconfiguration of already built systems would be needed. The Sun Factory conducts final integration of these customized servers.
Figure 3.5: Three Customization Alternatives Evaluated for CRS Supply Chain
Alternative 1: Customize Internally (Status Quo)
Supplier DC Factory Customer
Alternative 2: Reconfigure Externally
SStiock DC Factory Customer
I
9d o Tes Customize Ki ntegrjate E Faku
Alternative 3: ATO Externally
Supplier DC Factory Customer
Assemble Test Kit Integrate Test Packout
to OrderL
JLJJ
CRS was not seeking to outsource final integration to an external manufacturer;
therefore, all integrated solutions still had final assembly at the Sun factory. Single Box solutions could be shipped (presently through the DC) to CRS customers under
Alternatives 2 and 3 without needing to pass through the Sun factory.
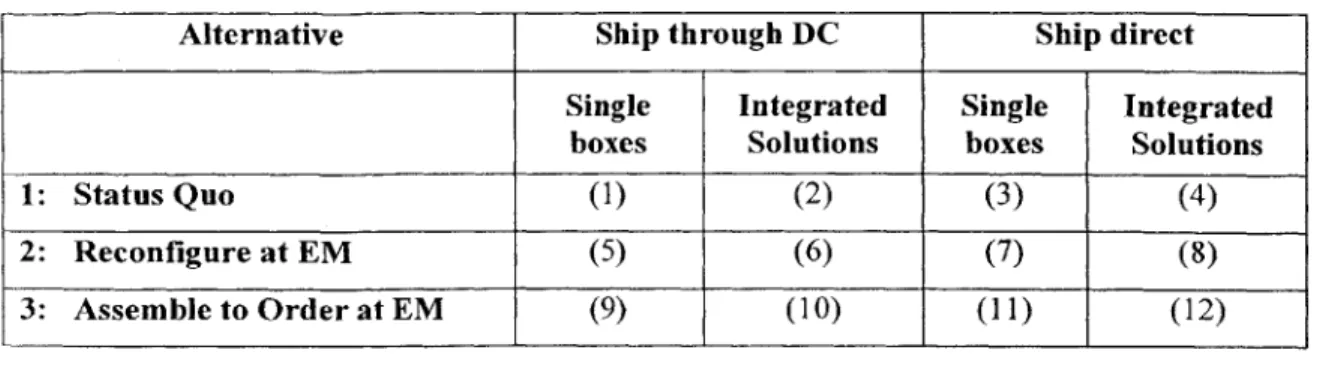
CRS personnel agreed that quality, lead-time, and cost were the critical factors that needed to be measured for each alternative. Each alternative was measured on Quality, Lead-Time, and Cost for both the existing supply chain (distribution center acts as a warehouse) and the future supply chain (cross-dock); and for Single Boxes and Integrated Solutions. Figure 3.6 summarizes the scenarios evaluated.
Figure 3.6: 12 Total Scenarios Evaluated
Alternative Ship through DC Ship direct
Single Integrated Single Integrated boxes Solutions boxes Solutions
1: Status Quo (1) (2) (3) (4)
2: Reconfigure at EM (5) (6) (7) (8)
3: Assemble to Order at EM (9) (10) (11) (12)
3.4 Quality Results
Customizing a server in the Sun factory involved opening the server chassis, adding/removing/changing the relevant parts, and closing the chassis. Most people believed that this customization increased the defect rate of solutions shipped to customers relative to that for systems that were not reconfigured after they were built. Further, they believed that if this rework could be eliminated, the defect rate should decrease. The hypothesis was that using a supplier's assemble-to-order process
(Alternative 3) would have the least amount of rework and would therefore result in the highest quality.
However, this effect was not actually measurable because testing conditions differed between CRS and the external suppliers. A VSP server might pass all the testing required by the Product Group at the supplier, but after sitting in stock at the supplier and Sun's warehouse for some time, the server might, upon arrival at the CRS factory, fail its "cold start." If a "cold start" of that server failed, CRS would label it as defective, return it to the VSP Product Group, and pull another server out of stock. Often, these "cold start" failures could not be replicated; the server would start successfully on subsequent attempts. In the field, however, a server that failed its "cold start," but then started successfully later might not be reported or returned by Sun services personnel or the customer.
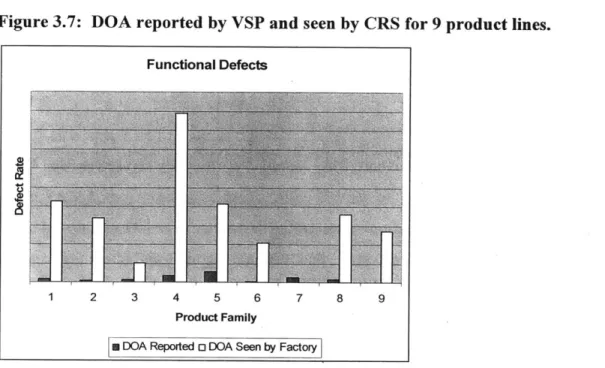
reported as "Dead on Arrival (DOA)" by the VSP Product Group and by CRS. As shown in the figure, DOA rates reported by Product Groups were orders of magnitude smaller than those reported by CRS.
Figure 3.7: DOA reported by VSP and seen by CRS for 9 product lines. Functional Defects
1 2 3 4 5 6 7 8 9 Product Family
* DOA Reported o DOA Seen by Factory
This discrepancy occurred because Product Groups were responsible for keeping their defect rates and costs low, but CRS had no incentive to accept quality risks for their customers, especially since they could immediately pull replacement parts from the Sun distribution center. CRS also had more .stringent pass criteria and longer test times on integrated solutions, so their customers had a statistically significant reduction in the number of "Early-Life Failure" issues relative to most other Sun customers. Although the CRS DOA rate was beginning to be used as the standard proxy for actual customer defect rate, there was still internal disagreement as to whether or not what CRS labeled as defective was truly defective.
CRS did not trust the quality of any system pulled from the distribution center; therefore, all CRS solutions underwent the same extensive testing process. Because testing should have been consistent (among the various alternatives considered), CRS customers should have seen the same defect rate regardless of the source of customization. As long as the
sources of defects from external factors, such as transportation, were consistent regardless of scenario, quality measured as customer defect rate should have been the
same across all the alternatives considered.
However, even though the customer defect rate should have been the same, by
outsourcing part of the customization, the expected number of defects introduced by CRS should have decreased, simply because CRS would be doing less work (thus transferring the risk of defects to its suppliers). Therefore, the cost of defects to Sun should have been lower. Alternatives 2 and 3 both used. Suppliers rather than CRS to reconfigure the servers; therefore, the expected decrease in defects introduced by CRS should have been approximately equal to the historic defect rate of CRS defects introduced during server reconfiguration.
To estimate this value, quality reports from 2003 were evaluated, and all defects
introduced by Sun during the server customization process were counted. No functional defects were introduced by Sun during box customization, and the rate of non-functional defects (e.g. a scratched box) was -also insignificant. Thus, we could assume that there would be no significant reduction in costs from defects from any alternative.
For the Single Box case, the supplier would have end-to-end control of the customization. However, as discussed above, the testing conditions would be different. Currently, CRS
tests servers as "cold starts." This would be difficult to replicate in an assemble-to-order process. CRS believed that the true quality metric, customer defect rate, would have been higher unless the external manufacturer could mimic the existing CRS testing exactly, which they could not do unless they followed the existing CRS process (pull a server from the Sun warehouse and reconfigure it).
As a result, quality was not a driving factor in this decision. CRS was only seeking to outsource box-level customization, retaining more complex cabling and racking
of introducing defects through box customization was small, especially among trained personnel. Further, even if these defect rates were high, outsourcing to decrease defect
rates may be a case of getting "rid of problem a company hasn't been able to solve itself,"14 and may not have been appropriate if Sun wanted to grow its customization capability. Finally, defects seemed to arise more from design flaws (narrow tolerances, excessive heat when racked on a storage unit, etc.) rather than from the final assembly of the boxes. CRS and Sun may have more success decreasing defects by designing
products with integration in mind.
3.5 Lead-time Results
Lead-time for this evaluation was defined as the "Book-to-Ship" time, or the time between the customer booking the order and that order shipping to the customer. Assumptions for this analysis were:
* Assembly and test time were the same for standard products and for customized products (ATOs) at the suppliers
* As long as the distribution center acted as a warehouse, CRS could pull a standard configuration out of stock; no shortages or stop ships were in effect
Currently, CRS pulls standard configurations from the local Distribution Center (DC) and then follows the existing factory process as shown before in Figure 3.3. The total lead-time is transportation lead-time from the DC + total factory cycle lead-time.
Alternative 2 more or less replicates Alternative 1 in terms of process steps, but the lead-time is longer. Although the actual customization of a server takes only minutes, if the supplier performs customization, the supplier will have to unpack and repack the servers (steps that will in effect be duplicated at the CRS factory) and may have to retest the units after customisation. The total lead-time for Alternative 2 is therefore the extra supplier overhead time for customization + transportation from the supplier to CRS + total factory cycle time.
14 Joan Magretta. "The power of virtual integration: an interview with Dell Computer's Michael Dell."
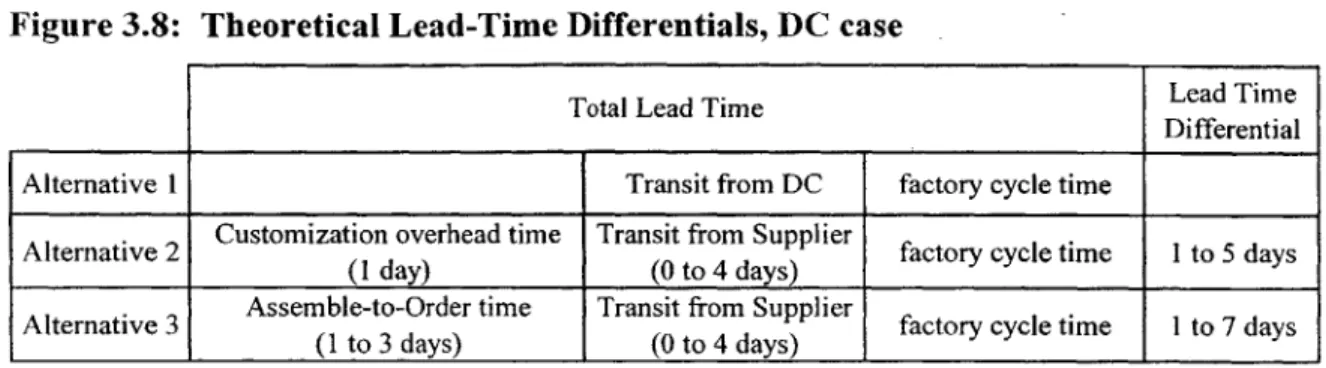
Alternative 3 involved assembling the system to order at the supplier. The total lead-time from a customer point of view would be the time to assemble the system + transportation from the supplier to CRS + total factory cycle time. Figure 3.8 summarizes the results for the distribution center case.
Figure 3.8: Theoretical Lead-Time Differentials, DC case
Total Lead Time Lead Time
Differential Alternative 1 Transit from DC factory cycle time
Alternative 2 Customization overhead time Transit from Supplier factory cycle time 1 to 5 days (1 day) (0 to 4 days)
Alternative 3 Assemble-to-Order time Transit from Supplier factory cycle time I to 7 days
I__ _ (1 to 3 days) (0 to 4 days) I
As shown in the Figure 3.8, the current case offers the shortest theoretical lead-time. Alternative 2 adds 1 - 5 days, depending on the supplier location. Alternative 3 adds 1 -7 days depending on the supplier location and the complexity in assembling the server. For example, mid-range servers are manufactured on the East Coast and take at least 3 days to assemble and test. Therefore, using an assemble-to-order process for mid-range servers would prolong theoretical lead-time by 7 days, unless alternate transportation modes are used. However, some low-end servers are manufactured a twenty-minute drive from the Sun factory, and take less than 1 day to assemble and test. Using an assemble-to-order process for these servers would only extend lead-time by 1 day.
Figure 3.9 shows the theoretical lead-time differentials for the future cross-dock scenario. In this scenario, the transportation advantage caused by the local distribution center from Alternative 1 disappears. Therefore, theoretical lead-time differentials shrink to just 1 day for Alternative 2 and 1-3 days for Alternative 3 (depending on the assembly and test time).
Figure 3.9: Theoretical Lead-Time Differentials, Cross-Dock Case
Total Lead Time Lead Time
Differential Alternative 1 Transit from Supplier factory cycle time
Alternative 2 Customization overhead time Transit from Supplier factory cycle time 1 day
___________ (1 day)__________ _________
Alternative 3 Assemble-to-Order time Transit from Supplier factory cycle time I to 3 days
________ I (1 to_3_days) ____________________ ______
For the Single Box case, servers could be customized and direct-shipped or built, tested, and direct shipped from the supplier to the end customer. Figure 3.10 summarizes the theoretical lead-times of the three alternatives. In this case, Alternative 1 would have the longest lead-time and Alternative 2 the shortest. However, the testing conditions under Alternatives 1 and 2 differ. As mentioned earlier, CRS tests all solutions that come through the factory, sometimes for 48 hours. If the supplier were also to perform an extensive retest after customizing, Alternative 1 would only be slower by 1 day (the transit time from DC to factory).
Figure 3.10: Theoretical Lead-Times, Single-Box Case (Direct-Ship to Customer)
Total Lead Time Lead Time
Transit from DC factory cycle time
Alternative _ (1 day) (1 to 3 days)
Alternative 2 Customization overhead time I day
(1 day)
Alternative 3 Alternative 3 Assemble-to-Order time (I to 3 days) I to 3 daysto3dy
The analysis illustrates the impact of assembly time, supplier locations, and
transportation time on customization strategy. Theoretically, the lead-time differential of integrated solutions depends on the time to build or customize the product and to ship it to the factory. Using the local suppliers for customization of low-end servers would not impact lead-time considerably, but using suppliers on the opposite coast for the mid-range servers would cause more significant increases, especially if these servers are
integrated solutions only depends on the time to build the product. Single boxes that can be direct-shipped to the customer from the supplier would have shorter lead-times.
This analysis also illustrates the need for an organization to be able to assess new supply chain configurations regularly as things change. When a company chooses to move or consolidate a facility for cost benefits or strategic reasons, it needs to consider how the supply chain will be impacted and assess whether a new supply chain configuration might be optimal. For example, in 2004, Sun intends to close of its California manufacturing facility and eliminate the California distribution center as a stocking location. A low-end server supplier customization strategy that may have made sense under the existing configuration would need to be reevaluated under the new
configuration. Any customization strategy should be flexible enough that it does not lock an organization into one specific supply chain configuration.
Lead-time analyses should also be conducted with customer value in mind. Currently, CRS dictates lead-times to customers. Although customer program managers believe that in some cases the lead-times are too long, they do not know the optimal lead-time to
satisfy customers or to grow revenue. Many believe that it is more important to maintain integrity between promised delivery date and actual ship date;'5 completed solutions that
are built ahead of schedule sometimes wait in the distribution center until the originally promised ship date. The impacts of shortening or lengthening lead-times are unknown, which leads to uncertainty on how relative differences in lead-time should impact
decision-making.
Finally, this lead-time analysis was conducted based on theoretical lead-time capability of suppliers and Sun. Some doubt existed as to whether solutions could be delivered against these theoretical best values. A later study, presented in Chapter 5, analyzed the actual CRS lead-times and discovered discrepancies between actual lead-times and these theoretical approximations.
3.6 Cost
The goal of the cost analysis was to compare the total cost to Sun of the three alternatives. Relevant costs included labor, transportation, inventory, and implementation.
3.6.1 Labor Cost
Indirect labor was assumed to be the same under all strategies. The total direct labor cost of the existing strategy could be broken down into the suppliers' direct labor costs and Sun's direct labor cost. Because Sun's direct labor force was fairly flexible, all
outsourced customization would decrease Sun's labor costs.
Alternative 2 involved moving customization from Sun to the supplier. In the worst case, this strategy requires the supplier to unpack and repack finished goods held in its own warehouse (denoted below as Customization Overhead). Therefore, the total labor cost savings for integrated systems would be:
[Average Time to Customize a Box + Customization Overhead] (Hours) * (Sun Hourly Loaded Labor Cost - Supplier Hourly Loaded Labor Cost) * Total Expected Boxes to be Customized.
Alternative 3 used the supplier's assemble-to-order process. Interviews with suppliers and operations program managers revealed that the direct labor time required to build a standard configuration was roughly the same as the time required to build a custom configuration. This was because adding configurable options while the server was being built did not take that much time. There would be no extra supplier labor costs in this
case, so the total labor cost savings for integrated systems would be:
Average Time to Customize a Box (Hours) * (Sun Hourly Loaded Labor Cost) *
Total Expected Boxes to be Reconfigured
Labor cost savings for Single Boxes would be much higher; because the Sun factory could be avoided entirely, labor time from kitting and packout could be avoided completely. Although the direct labor time to customize a server is on the order of
minutes, the direct labor time for the entire process (excluding test) is on the order of hours. Total labor cost savings would be:
[Average Time to Customize a Box (Hours) + Sun Factory Customization Overhead] * (Sun Hourly Loaded Labor Cost) * Total Expected Single Boxes
These calculations had some caveats. First, many supplier contracts did not have a labor rate or labor costs listed explicitly. Although the overall cost structure at the supplier
should have been lower than Sun's cost structure, if the labor rate was not broken out explicitly, calculating labor cost savings was imprecise. Further, for some of the low-end servers, the existing contract had a more expensive pricing structure for custom
configurations as opposed to standard configurations, even though the standard and custom configurations used the same parts and testing infrastructure. Although these costs were slated to be negotiated out of future contracts, they did exist in the current state.
Despite these caveats, this analysis concluded that labor cost savings from outsourcing increased linearly with volume, and was higher for Alternative 3 than for Alternative 2. At the existing volume, total annual labor cost savings for Alternative 3 (having the supplier perform all customization work) would have been less than half a million dollars. Alternative 2 would have been comparable to Alternative 1, the existing case.
The calculation for single boxes was the same, except that the labor cost of the Sun factory was avoided entirely. This amounted to under a hundred thousand dollars for the existing volume. Note that single boxes had lower volume overall relative to the program
size.
3.6.2 Transportation Cost
In the existing structure, many of Sun's suppliers did not make daily shipments to Sun's factory or distribution center. Therefore, for integrated systems, if the custom
shipping and lack of economies of scale. For mid-range servers, if the servers used overnight shipping at the current UPS rate, the transportation cost of the alternatives would have added less than 5% to the total product cost, and have been on the order of magnitude of ten thousand dollars total for the year. This is the case for both Alternatives 2 and 3.
For single boxes, no additional transportation costs are incurred because the boxes can be direct-shipped from the supplier. No transportation costs savings are incurred either, because factory shipments are currently consolidated at the distribution center.
In the future cross-dock scenario, no differences would arise from transportation costs of integrated systems because all products would be direct shipped from the suppliers. Transportation costs of Single Boxes would be less expensive under Alternatives 2 and 3, because shipping to the factory would be unnecessary. This savings was on the order of magnitude of thousands of dollars for the year.
3.6.3 Inventory Cost
Currently, low-end servers already had the XATO process in place, so integrating it with CRS would not have resulted in any increased inventory costs. However, because mid-range servers did not have XATO, operations managers believed that implementing it would require stocking configurable options at the supplier and increase inventory costs.
Determining the correct amount of inventory to hold at the external manufacturer of mid-range systems was difficult. Although the top 5 options (20%) represent nearly 80% of total demand for options (see Figure 3.11), the other options were still offered. Figure
3.12 shows how the weekly demand for these options was highly variable. Given this options proliferation and demand pattern, traditional min-max inventory models would have yielded unsatisfactory results. To illustrate this, a standard min-max model was
constructed from one year's worth of data to approximate the inventory levels needed for service levels between 90% - 99% (See Appendix 1 for Model Details)..
Figure 3.11: Options Proliferation among Configurable Options 100% 72 -0 CO -0 4-a 0 0 F- %4-0 tU0 -7- 80%-60% 50% 40% 30% 20% 10% 0% I 2 3 I I I I I I I I I I I I I I I I I I 1 2 3 4 5 6 7 8 9 10 11 12 13 14 15 16 17 18 19 20 21 22 23 Options
Figure 3.12: Weekly demand for top 90% of options for mid-range servers
Weekly Demand for Options (Top 90%)
->
Week
Product lifecycles were relatively short for the options (less than two years), so inventory also increased the risk for obsolescence. For this model, the maximum cost of
obsolescence was estimated to be the cost of the Maximum Inventory (the Inventory Cost --- - -I
IM
i ; I I I I I --factor. From interviews with operations programs managers, this risk factor should have been zero if the Product End of Life process was handled well. However, historically, some expensive oversights had been made in this area.
From the model, inventory costs were not high relative to other costs (thousands of dollars per year), but the largest cost driver was the risk factor selected for managing product end-of-life (zero to hundreds of thousands of dollars per year). This model was then tested against the actual demand of QI 2004. Despite the 95% service level targeted, there would have been stockouts for 20% of the orders in Q i 2004. Further, there would have been zero demand for 40% of the options for which inventory was kept. This
inventory policy was completely inappropriate for these products. Given the relatively light weight of these options, overnight shipping from the Sun distribution center or the supplier directly without increasing inventory held would have been much more
appropriate. By reducing lead-time and instituting a more flexible inventory policy, the costs and inventory risk could be reduced dramatically.
This analysis emphasized the importance of managing the product end-of-life process as well as selecting the correct inventory policy based on the demand pattern. For mid-range servers, a standard inventory policy for the options could not be used for an assemble-to-order process. The inventory cost of options could be significantly reduced by instituting more flexible options, such as air-shipping options from the supplier or the Sun
distribution center.
3.6.4 Implementation Cost
As mentioned previously, many low-end server product lines already had an External Assemble-to-Order (XATO) process in place at the supplier. Mid-range servers had
XATO processes for previous products, so the supplier already had the IT infrastructure to implement an Assemble-to-Order process. The cost of implementing Alternative 3
(ATO externally) would simply be the IT cost of integrating the existing XATO process with CRS. This required an IT change to the Sun ERP system to enable hierarchy in the Bill of Material (BOM) structure. IT personnel were consulted to estimate the cost of this
change, which was less than a hundred thousand dollars.
3.7 Summary, Other Considerations, and Recommendations
Figure 3.13 summarizes the order of magnitude of the costs. Although the business case was stronger for customizing Single Boxes at the supplier, there was no compelling reason to change the existing strategy. There would be no quality improvements, the lead-times would not decrease, and for the most part, costs would be higher. From an analytical point of view, there seemed to be no reason to deviate from the existing setup.
Figure 3.13: Results of Cost Analysis (Order of Magnitude)
Labor I Tranportation
[
Inventory ImplementationIntegrated
Systems Single Boxes IntegratedSystems Single Boxes
Integrated
.gBx Systems Single Boxes DC:
Alternative 1 0 0 0 0 0 0 0 0
+ thousands to + thousands to
- tens of + tens of + hundreds of same
Alternative 2 0 thousands thousands 0 hundreds of hundreds of thousands change
thousands thousands
v hundreds of -tens of + tens of + thousands to + thousands to + hundreds of same
Alternative t t housands thousands 0 hundreds of hundreds of thousands change
thousands thousands
Cross dock:
Alternative 1 0 0 0 + thousands 0 0 0 0
hundreds of
-tens of + thousands to + thousands to + hundreds of same
Alternative 2 0 thousands 0 0 hundreds of hundreds of thousands change
thousands thousands
-hundreds of -tens of + thousands to + thousands to + hundreds of same
Alternative 3 thuad huad' 0 0 hundreds of hundredsof thousands change
thousands thousands thousands thousands ___________
However, there were several caveats with this result. First, the existing supply chain had already been optimized for CRS and the existing products. However, other alternatives existed that could have been better for both CRS and the other products. These were not examined closely because it was assumed that those managing operations for the other
Integrated
Systems
Single Boxes