Publisher’s version / Version de l'éditeur:
Vous avez des questions? Nous pouvons vous aider. Pour communiquer directement avec un auteur, consultez la première page de la revue dans laquelle son article a été publié afin de trouver ses coordonnées. Si vous n’arrivez pas à les repérer, communiquez avec nous à PublicationsArchive-ArchivesPublications@nrc-cnrc.gc.ca.
Questions? Contact the NRC Publications Archive team at
PublicationsArchive-ArchivesPublications@nrc-cnrc.gc.ca. If you wish to email the authors directly, please see the first page of the publication for their contact information.
https://publications-cnrc.canada.ca/fra/droits
L’accès à ce site Web et l’utilisation de son contenu sont assujettis aux conditions présentées dans le site LISEZ CES CONDITIONS ATTENTIVEMENT AVANT D’UTILISER CE SITE WEB.
First International Conference on Fuel Cell Development and Deployment
[Proceedings], 2004
READ THESE TERMS AND CONDITIONS CAREFULLY BEFORE USING THIS WEBSITE. https://nrc-publications.canada.ca/eng/copyright
NRC Publications Archive Record / Notice des Archives des publications du CNRC :
https://nrc-publications.canada.ca/eng/view/object/?id=ed306ef0-c352-45c8-813a-3002acc4d758 https://publications-cnrc.canada.ca/fra/voir/objet/?id=ed306ef0-c352-45c8-813a-3002acc4d758
NRC Publications Archive
Archives des publications du CNRC
This publication could be one of several versions: author’s original, accepted manuscript or the publisher’s version. / La version de cette publication peut être l’une des suivantes : la version prépublication de l’auteur, la version acceptée du manuscrit ou la version de l’éditeur.
Access and use of this website and the material on it are subject to the Terms and Conditions set forth at
Numerical predictions of water transport in a single-cell PEM fuel cell
Y. Lin
S. B. Beale
National Research CouncilOttawa, ON K1A 0R6, CANADA
Numerical Predictions of Water Transport in
a Single-cell PEM Fuel Cell
Water transport plays a critical role in PEM fuel cell performance. Water generated by electrochemical reactions, osmotic drag and back-diffusion can cause water-saturation or flooding, preventing oxygen from entering the catalysis sites on the cathode side. On the anode side; dehydration may occur, resulting in lower proton conductivity. Balancing the water content distribution within the membrane involves judicious water and heat management strategies. Detailed three-dimensional numerical simulations are applied to predict water transport within a PEM fuel cell. Heat and mass transfer, electrochemistry and the electric field potential are all strongly coupled in PEM fuel cells. The dependence of water transport on all of these factors is taken into account in the numerical model. In addition to the constant phase transit between liquid water and water vapor within the porous electrodes, water transfer in the liquid state is generally driven by capillary pressure, while diffusion is the main transport mechanism for water vapor in the porous medium. The authors developed the model in user-defined-functions as part of a commercial computational fluid dynamics code. A structured rectilinear mesh, concentrated in near wall regions for fluid channels, is employed. Numerical results show a strong dependence on the rate of water removal on the temperature, current density, inlet mass flow humidification levels. It is also observed that the oxygen concentration variation along the air channels affects current density distribution.
Keywords: PEM, Fuel Cell, Water Transport
1 Introduction
High energy transfer, low pollutant emission and moderate operating temperature make the PEM fuel cell an attractive candidate for energy conversion devices. Potential applications of the PEM fuel cell are in the automotive industries, residential power supplies, and mobile communications, to name but a few. Commercial success of the PEM fuel cell depends on cost reduction, e.g. in catalyst materials, and also increasing the operational efficiency of the device.
A key element of the PEM fuel cell is the membrane, typically NafionTM, with a chemical structure consisting of a fluorocarbon backbone, side chain, and an ion cluster composed of sulfuric acid ions. The membrane is a good conductor of H+ protons; if and only if the membrane is hydrated, with mobile hydrogen
ions in the cluster, Springer et al [1]. Thermal and water management are two critical performance issues for PEM fuel cells [2]. Water transport plays a central role in PEM fuel cell design. Water generated by the electrochemical reaction, the osmotic drag and back-diffusion on the cathode side can cause over-saturation or even flooding, thus preventing oxygen from entering the catalysis sites. On the anode side dehydration may occur, resulting in lower protonic conductivity. Balancing the water content in the membrane involves judicious water and heat management strategies.
The performance of a PEM fuel cell is often characterized in the form of a polarization curve. This is governed by activation, Ohmic and concentration overpotentials. Much attention has been paid, in the past, to the cathode side of the PEM fuel cell, where the exchange current density is low, and the presence of over-hydration in the porous cathode and catalyst layers may result in activation and concentration losses.
Mathematical models and numerical analysis of PEM fuel cells play an important role in understanding the physicochemical phenomena and in improving or optimizing PEM fuel cell systems. Bernardi and Verbrugge [3] proposed a 1-D model for the ion-exchange membrane and gas-diffusion porous electrodes. Springer et al. [1] deployed experimental data for water diffusion coefficient, electro-osmotic drag coefficient, and membrane conductivity (as a function of water content) in the 1-D model which they developed. These models provide a fundamental framework for the multi-dimensional models that followed. Fuller and Newman [2] analyzed water and thermal management and fuel utilization in their pseudo 2-D model. Nguyen and White [4] demonstrated the importance of water and thermal management in maintaining high performance PEM fuel cells, with a pseudo 2-D model. Gurau et al. [5] considered transport phenomena in a 2-D PEM fuel cell model. Their calculations showed uneven species distributions in the air/fuel channels and in the porous diffusion layers. Recent efforts have been towards modeling two phase flow and transport on the cathode side, with emphasis on PEM fuel cell operation, at high current density.
The objective of this paper is to apply both a detailed 3-D model and a hybrid model to a PEM fuel cell design, in order to predict water transport and distribution within the fuel cell, and also the impact of over-saturation and dehydration on either side of the membrane, on the overall performance of the fuel cell. In addition, the two models are compared with a view to using simpler models to perform performance calculations, in place of more complex numerical procedures.
2. Mathematical Model
The traditional planar PEM fuel cell is composed of multi-layers of components. A layer of polymer electrolyte membrane is sandwiched by two catalyst layers and two porous gas diffusion electrodes. The membrane is typically made of NafionTM, and the catalyst layer consists of platinum catalyst, ionomer membrane electrolyte and void space. The membrane-electrode assembly (MEA) is sandwiched between two layers of bipolar plates, containing air and fuel micro-channels and possibly water cooling channels.
The physicochemical phenomena involved in PEM fuel cell centre around four aspects: mass transport, heat transfer, electrochemistry and
electric potential distribution. Two models were considered in the present study; (i) a 3-D model developed as described in [6] using the commercial computational fluid dynamics (CFD) code FluentTM , (ii) a hybrid model developed in-house by the present authors and coded as user-defined functions within the above CFD code
The hybrid model developed here is a combination of full 3-D fluid flow and heat and mass transfer model, with 1-D water and proton transport through the membrane. The way in which the electrochemistry and electric potential fields are treated in the two approaches is different: in the 3-D model two Poisson’s equations for the protonic and electronic electrical potentials are solved; in the hybrid model the overpotential is explicitly derived from a Butler-Volmer equation with transformed exchange current density value. The models are briefly outlined below.
2.1 Mass transport. Air and fuel are considered
to be multi-species mixtures. Transport of the gas mixtures through the micro-channels and porous media is governed by essentially the same sets of governing equations. In addition to bulk convection of the fluids, there is diffusion of the gaseous species, which is described by Stefan-Maxwell equations. Numerical experiments have shown that the simpler Fickean diffusion mechanism is an acceptable alternative for many engineering applications.
For steady flow, the governing equations for the mixture may be written as follows:
( )
ρu =Sdiv (1)
(
ρu;u)
=−grad +div(
µ gradu +Sdiv p eff
)
)
(2)(
c T)
(
keff T S p = + ρ div grad div u (3)(
y)
(
D yi)
S eff i i = + ρ div grad div u (4)where is velocity, is pressure, is a source term, is mass fraction of species i, is an effective dynamic viscosity, obtained from the formulation of Wilkes [7], D and are (effective) diffusion coefficient and thermal conductivity. u p S eff i i y eff µ eff k
For fluid flow in porous media (such as the electrodes and catalyst layers), the governing equations can be multiplied by the porosity, . Under these circumstances, the diffusion coefficient is frequently defined in terms of a tortuosity (and porosity) for the medium. It is assumed that the pore size is much larger than the molecular mean free path, so that Knudsen
diffusion is negligible. The effective diffusion coefficient is obtained using the so-called
Bruggmann correction [8], 2.2 Heat transfer. Heat transfer in the micro-channels and porous electrodes is given by equation (3) (assuming pressure work, and viscous dissipation to be negligible). In the solids, convection is absent, and the energy balance reduces to a simple Poisson equation. The solution to the conjugate heat transfer problem is obtained by the direct solution of equation (3) for the entire fuel cell. Latent heat is released by the condensation of water vapor into the liquid phase. Heat sources result from the electrochemical reactions on both sides of the membrane, and from activation, Joule and contact resistance heating. These should all be accounted for in an energy balance.
i
eff
i D
D =ε32 (5)
where is the diffusion coefficient of species
i, which is obtained from the Chapman-Enskog
equation [9].
k
D
Fluid flow in porous media may be written in terms of Darcy’s law,
kpgradp
µ − =
εu (6)
where is the absolute permeability. This is achieved by introduced a linearized source term,
p
k
µ εu =kp
S into the momentum equation, equation (2). Equation (6) may also be applied to both liquid and gas flows by introducing the concept of relative permeability [10] as a function of volume fraction.
Although heat is generated as a result of a variety of mechanisms, the origin of all heat sources/sinks of heat comes from the change in chemical potential of the reactants/products. The change in enthalpy of formation, ∆ , is equal to the sum of heat and electrical energy (assuming mechanical work to be negligible). Thus the total amount of heat generated could be written as,
H In the hybrid model the catalyst layers are
treated as a plane surfaces. Mass source terms for each species are given by:
a H H F i M S 2 2 2 =− (7) −∆ − ⋅ = V nF H i S (11) c O O F i M S 4 2 2 =− (8)
The reader will note the value of ∆ is dependent on the fraction of water in the liquid or vapor form. Equation (11) cannot however, be used to enumerate the various sources of thermal dissipation for the fuel cell; for these specific closure equations are required.
H c O H O H F i M S 2 2 2 = (9)
where F is Faraday’s constant (96487 C/mol), is the proton generation rate on the anode side, and the cathodic consumption rate (both positive by convention), M is molecular weight. For the 3-D model the catalyst layers have a finite thickness, so the units of the source equations (7)-(9) are kg/m
a
i
c
i
3⋅s and kg/m2⋅s for the 3-D, and hybrid models, respectively (and those of i are A/m3 and A/m2.)
2.3 Electrochemistry and potential field. For
the 3-D model, the electrochemical reactions at the membrane-electrode interfaces, may be written implicitly in terms of local current density in the form of a Butler-Volmer type equation [11, 12] as follows
It is presumed that water transport through the membrane is governed by electro-osmotic drag
and back diffusion [1, 4],
−α η − α η = γ RT F RT F C C i i a c ref k k ref k k k exp exp , 0 (11) dn dC D F i n
NH2O = d 2 − w H2O (10) where is the volumetric current density in the
catalyst layer, i is a volumetric reference exchange current density, which depends on such parameters as the electrochemical reaction;
k i ref k , 0 where is the molar flow rate of water
through the membrane, is the osmotic drag coefficient, is the water diffusion coefficient in the membrane, n the unit length vector perpendicular to the interface between the membrane and the electrodes. If the pressure across the membrane is significant, equation (10) may readily be modified by the addition of a Darcy term. O H N 2 D d n w Anode: H →2H++2e− (12) 2 Cathode: O 2H 2e H O 2 1 2 2+ ++ −→ (13)
and also temperature and catalyst loading, C is the reference concentration of hydrogen on the
ref k
anode side and oxygen on the cathode side, γ is a stoichiometric coefficient for species k in the cathodic and anodic reactions, α and are transfer coefficients, η is the overpotential value, which is positive on the anode side but negative on the cathode side. The numerical value of the exchange current is based on the experimental results of Parthasarathy et al [13]. The anode overpotential may expressed as follows,
k c α a
)
Ea m c E H H x x e Φ k RT F c α >> = 2 2 0 ln O ref O ref c c C C i i F RT α η (17)In the hybrid model, Φ and are not solved for as state variables. The potential losses in the membrane, diffusion layers and interconnectors are computed from Ohmic resistance terms. Relatively constant potential distributions were observed on both sides of the membrane interfaces.
e Φm
ηa=
(
Φe−Φm a− (14)A similar expression may be written for the cathode overpotential. Here Φ and Φ are the local electronic and protonic potentials. The Nernst potential, , is just the sum of two half-potentials . The half-values are not unique; The sum, however, may readily be written as, e E a+ E E =
3. Results and Discussion
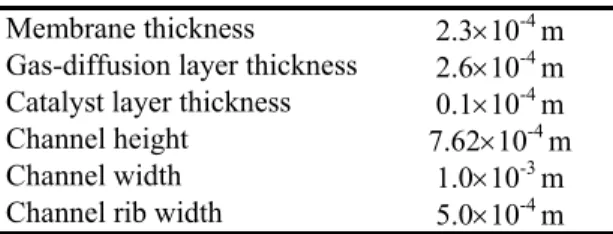
The PEM fuel cell prototype given in Ticianelli et al. [14] was used as the base case for a comparison of the detailed numerical simulation and the hybrid model. Physical parameters and properties are given in Tables 1 and 2, respectively. + ∆ = 2 2 2 2 2 1 ln O O O r p x nF RT nF G E (15)
Table 1. Parameters for Base Case
where is the change in Gibb’s free energy for the reaction, under reference conditions, and
is the partial pressure of oxygen.
G ∆ 2 O p Membrane thickness 2.3×10⁻⁴ m Gas-diffusion layer thickness 2.6×10⁻⁴ m Catalyst layer thickness 0.1×10⁻⁴ m Channel height 7.62×10⁻⁴ m Channel width 1.0×10⁻³ m Channel rib width 5.0×10⁻⁴ m The potential distributions of both and
satisfy Laplace’s equation, since there can be no net accumulation of electrical charge within the domain,
m
Φ
Table 2. Physical Properties at 80°C ∇⋅
(
im+ie)
=0 (16)Membrane permeability 1.58×10⁻¹⁸ m2 Porous electrode permeability 3.03×10⁻¹⁶ m2 Saturated water vapor
pressure 0.467×10
5 Pa Electrode volume fraction 0.5 Cathodic transfer coefficient 2 Anodic transfer coefficient 2 Proton reference concentration 1.2×10 3 mol/m3 Oxygen reference concentration 4.6 mol/m 3 Cathode exchange current
density 4×10
6A/m3 and and are the proton and electron
current density vectors, respectively.
m
i ie
In the hybrid model, a somewhat different approach is taken than given above: The cathode overpotential changes very little over the catalyst layer in a direction perpendicular to the membrane interface, but oxygen concentration changes dramatically over the thickness of the catalyst layer. Thus by integrating equation (13) over the catalyst layer one obtains essentially the same equation except that i now represents the reference surface current density, C is the concentration of the reactant k at the membrane interface, and i is the surface current density value. ref k , 0 k
3.1 Comparison of 3-D and hybrid models.
The same geometry was used to compare the full 3-D and hybrid methodologies. The feasibility of the hybrid approach depends on the vertical nature of the current throughout the whole domain. The hybrid model is valid when the electronic conductivity of the electrodes is constant and the diffusion velocity within the gas diffusion layers is relatively large compared to the rate-of-reaction; effective diffusion The absolute value of the overpotential on the
cathode side is much larger than that on the anode side, so that the overpotential on the anode side is usually neglected. If ηc ,
coefficients within the central layers are relatively high, so that the current is evenly distributed throughout the membrane interfaces. Figure 1 shows path lines of current within the fuel cell in a cross-sectional view. It can be seen that the path lines are reasonably evenly distributed and hence the hybrid approach would be appropriate in this case.
Average current denisty *10-4(A/m2)
C at h od ic ov er po te nt ia l( V ) O h mi c p ot en tial lo ss (V ) 0.2 0.4 0.6 0.8 0.05 0.1 0.15 0.2 0.1 0.2 0.3 0.4 0.5 0.6 3-D Model Hybrid Model η VOhm
The hybrid and 3-D methodologies were compared under the same average current density and temperature conditions. For mass transfer calculations, precisely the same source/sink terms of reactants/products are prescribed, based on equations (7) to (9). The electro-osmotic drag coefficient and diffusion coefficient are indirectly related to the water vapor mole fraction distribution at the interface between the electrodes and the membrane. As the local membrane current density distribution is presumed constant for the hybrid model, a higher water vapor mole fraction is predicted for this model at the anode interface.
Figure 2. Cathodic overpotential and Ohmic voltage loss
Figure 2 also shows the variation in Ohmic loss as a function of average current density. It can be seen that the hybrid method under predicts the voltage loss by about 10% when compared to the 3-D model. This is due to the fact that current is more evenly distributed across the membrane for the 1-D model; while the actual situation is such that the current density varies locally from the regions located near the air channel to those adjacent to the interconnector ribs, depending on the oxygen diffusion (i.e. mass fraction) which affects the gradient of the local potential field. For the case considered here; the local variations of current density are relatively small, and good agreement between the two methods is seen in Figure 2. Local current density variations depends not only on the mass-transfer conductivities (exchange coefficients), but also on geometric factors such as the thickness of the layers, and the ratio of channel width to that of the ribs.
Figure 1. Path lines of electric current in a PEM fuel cell.
The overpotential at the interface between the cathode and the membrane determines the reaction rate of the PEM fuel cell. The reader will note that the physical meaning of the exchange current densities in the two models are different in as much as the values are either per unit volume or per unit surface area. The latter is a function of catalyst loading, since the catalyst surface area for reaction is much larger than the interface area.
Figure 3 shows polarization curves obtained with both hybrid and 3-D methods. Agreement between the two models is quite reasonable, with the hybrid method over predicting cell voltage by a maximum of about 5%. This due to the flatter current density distribution for the hybrid method.
Heat generated within the fuel cell comes from a variety of sources; energy associated with the thermodynamics of electrochemical reaction, Joule (Ohmic) heating, energy of activation, as well as the heat from contact resistance. If both V and i are close for the two models, a similar net heat source term will arise.
The relationship between overpotential and local current density can be seen from the Butler-Volmer equation. A lower local current density for the 1-D results in a lower overpotential value. The difference between the two approaches is less than 10%.
Average current density * 10-4(A/m2) Cel lV o lta g e (V) 0 0.2 0.4 0.6 0.8 0 0.2 0.4 0.6 0.8 1 3-D Model Hybrid Model 80.37 80.32
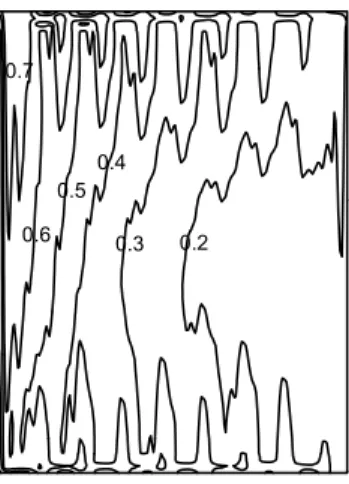
Figure 4. Temperature [ºC] distribution in the membrane.
Figure 3. Polarization curve.
The objective of the comparisons between the two models was to validate the hybrid model against the more detailed 3-D model; the former was then used to consider an industrial PEM fuel cell design in detail.
through the membrane. A fixed temperature is presumed at both the top and the bottom walls, corresponding to the idealized situation.
A typical membrane temperature distribution is shown in figure 4. The highest temperatures are located near the air exit zone. Because constant temperature values are prescibed at both the top and the bottom walls, and the bipolar plates are high conductors of heat; the temperature distribution within the PEM fuel cell varies little over the membrane. Both air and fuel enter and leave the fuel cell at the same side, both are heated along the path, thus higher temperature value at the exits are to be anticipated.
3.2 Water transport in an industrial PEM fuel cell. Numerical simulations of water transport
through the membrane were conducted for a commercial PEM fuel cell. Geometric details of the flow channel configuration are, by necessity, of a proprietary nature. Physical properties of the solid and fluid layers are given in Table 2. The thickness of the various layers together with the widths of the channels and ribs are given in Table 3.
4000 5000 6000 7000
Table 3 Physical parameters
Membrane thickness 1.0×10⁻⁴ m Gas-diffusion layer thickness 2.0×10⁻⁴ m Catalyst layer thickness 0.1×10⁻⁴ m Channel height 1.0×10⁻³ m Channel width 1.5 ×10⁻³ m Channel rib width 1.0×10⁻³ m Both 3-D and hybrid models were used to predict the performance of a single PEM fuel cell. Comparisons were made at constant temperature, without species source terms. Under the above pseudo 1-D condition, the cathodic overpotential and Ohmic voltage loss are compared so that the hybrid model could be used to perform further numerical calculations.
Water transport was examined by taking into consideration the temperature variation in the PEM fuel cell, together with the electro-osmotic drag, and the back diffusion of liquid water
Figure 5. Current density [A/m2] for i = 5000A/m2.
Figure 5 shows membrane current density distribution at the membrane interface. The highest current density is found to occur at the air/fuel inlet region. The reactant concentrations, and hence the Nernst potential, are both a maximum at the inlet region. The lowest current density is located near the air/fuel exit regions. The current density distribution is related to both the cathodic overpotential, and the membrane conductivity as shown in figures 6 and 7. It can be seen that the water-vapor mass fraction reaches a minimum near the exit region, thus resulting in lower protonic conductivity, and hence a decrease in local current density. The lower overpotential in the exit region is related to the low current density, and higher oxygen concentration at the membrane interface resulting from diffusion occurring here.
0.26 0.24 0.22 0.2 0.18
The water vapor distribution at the membrane-cathode interface is shown in figure 7. For the present case, little over-saturation of water is found; however it is noticed that a higher water vapor mass fraction distribution occurs near the air exit: Water is generated along the air channels. A fraction of this water diffuses back to the anode side; however it was observed that this mechanism is subordinate to forward transfer of water by electro-osmotic drag over a wide range of observed current densities. This is especially true at large current densities.
Figure 7. Water vapor mass fraction distribution at the cathode catalyst interface, i = 5000A/m2. Protonic conductivity is a function of both water content and temperature. It is critical that there be enough water on the anode side for the proper functioning of the membrane.
0.2 0.3 0.4 0.5 0.6 0.7 0.146 0.149 0.143 0.152
Figure 8. Water vapor mass fraction distribution at the anodic catalyst interface at i = 5000A/m2.
3. Conclusions
Figure 6. Cathodic overpotential [V] distribution
at i = 5000A/m2. Hybrid and fully 3-D models were applied to both a straight channel and an industrial PEM fuel cell design. Both global and local current density distributions were analyzed. The local current density may reach a maximum under the channels or under the ribs of the interconnectors. The main factors affecting this are the oxygen Figure 8 shows the water vapor distribution. It
can be seen that water is being depleted along the fuel flow path, as the electro-osmotic drag dominates water transport through the membrane.
diffusion rate and the protonic conductivity of the membrane. Since this local-scale phenomena can affect the overall results, future studies will address this matter.
Good agreement was obtained in terms of cell voltage, overpotential, species mass fraction distributions and Ohmic losses. Full-scale numerical simulations performed with both methods were used to perform calculations for temperature, current, overpotential, and water mass fraction distributions over the whole unit cell. The issue of water transport is important to maintain the proper functioning of the membrane.
Acknowledgement
The authors would like to thank Palcan Fuel Cells Ltd, for providing us with the geometry of an industrial scale fuel cell. Financial support of the NRC fuel cell program and the Institute of Chemical Process and Environmental Technology is appreciated.
References
[1] Springer, T.E., Zawodzinski, T.A., and Gottesfeld, S.,1991, “Polymer Electrolyte Fuel Cell Model”, J. Electrochem. Soc., 138 (8), pp. 2334-2342.
[2] Fuller, T.F., and Newman, J., 1993, “Water and Thermal management in Solid-Polymer-Electrolyte Fuel Cells”, J. Electrochem. Soc.,
140 (5), pp. 1218-1225.
[3] Bernardi, D., and Verbrugge, M., 1991, “Mathematical Model of a Gas Diffusion Electrode Bonded to a Polymer Electrolyte”, AIChE Journal, 37 (8), pp. 1151-1163. [4] Nguyen, T., and White, R.E., 1993, “A Water
and Heat Management Model for Proton-Exchange-Membrane Fuel Cells”, 140 (8), pp. 2178-2186.
[5] Gurau, V., Liu, H., and Kakac, S., 1998, “Two-Dimensional Model for Proton Exchange Membrane Fuel Cells”, AIChE Journal, 44 (11), pp. 2410-2422.
[6] Kulikovsky, A.A., Divisek,J., and Kornyshev, A.A., 2000, “Two-Dimensional Simulation of Direct Methanol Fuel Cell”, J. Electrochem. Soc., 147 (3), pp. 935-959.
[7] Wilke, C.R., 1950, Chemical Engineering Progress, 46, pp. 95-104.
[8] Bird, R., Stewart, W., and Lightfoot, E., 1960, Transport Phenomena, John Wiley and Sons, New York.
[9] Cussler, E.L., 1984, Diffusion: Mass transfer
in fluid systems, Cambridge University Press.
[10] Scheidegger, A.E., 1957, The physics of
flow through porous media, University of
Toronto Press.
[11] Newman, J.S., 1973, Electrochemical
Systems, Prentice-Hall Inc..
[12] Bard, A.J., and Faulkner, L.R., 1980,
Electrochemical Methods, Wiley, New York.
[13] Parthasarathy, A., Srinivasan, S., and Appleby, A.J., 1992, “Temperature Dependence of the Electrode Kinetics of Oxygen Reductioin at the Platinum/Nafion Interface—A Microelectrode Investigation”, J. Electrochem. Soc., 139(9), pp. 2530-2537. [14] Ticianelli, E.A., Derouin, C.R., and
Srinivasan, S., 1988, “Localization of platinum in low catalyst loading electrodes to attain high power densities in SPE fuel cells”, J. Electroanal. Chem., 251, pp. 275-295.

![Figure 4. Temperature [ºC] distribution in the membrane.](https://thumb-eu.123doks.com/thumbv2/123doknet/14191869.478227/7.918.150.427.132.388/figure-temperature-ºc-distribution-in-the-membrane.webp)