HAL Id: hal-00690880
https://hal.archives-ouvertes.fr/hal-00690880
Submitted on 24 Apr 2012
HAL is a multi-disciplinary open access
archive for the deposit and dissemination of
sci-entific research documents, whether they are
pub-lished or not. The documents may come from
teaching and research institutions in France or
abroad, or from public or private research centers.
L’archive ouverte pluridisciplinaire HAL, est
destinée au dépôt et à la diffusion de documents
scientifiques de niveau recherche, publiés ou non,
émanant des établissements d’enseignement et de
recherche français ou étrangers, des laboratoires
publics ou privés.
Mesoscale variability of water masses in the Arabian Sea
as revealed by ARGO floats
X. Carton, P. l’Hegaret, R. Baraille
To cite this version:
X. Carton, P. l’Hegaret, R. Baraille.
Mesoscale variability of water masses in the Arabian Sea
as revealed by ARGO floats. Ocean Science, European Geosciences Union, 2012, 8, pp.227-248.
�10.5194/os-8-227-2012�. �hal-00690880�
www.ocean-sci.net/8/227/2012/ doi:10.5194/os-8-227-2012
© Author(s) 2012. CC Attribution 3.0 License.
Ocean Science
Mesoscale variability of water masses in the Arabian Sea
as revealed by ARGO floats
X. Carton1, P. L’Hegaret1, and R. Baraille2
1LPO, UBO/UEB, Brest, France
2SHOM, Meteo-France, Toulouse, France
Correspondence to: X. Carton (xcarton@univ-brest.fr)
Received: 17 May 2011 – Published in Ocean Sci. Discuss.: 16 June 2011 Revised: 8 March 2012 – Accepted: 19 March 2012 – Published: 30 March 2012
Abstract. By analysing ARGO float data over the last four
years, a few aspects of the mesoscale variability of water masses in the Arabian Sea are described.
The Red Sea Outflow Water (RSOW) is concentrated in the Southwestern Gulf of Aden, in particular when a cyclonic gyre predominates in this region. Salinities of 36.5 and
tem-peratures of 16◦C are found in this area at depths between
600 and 1000 m. RSOW is more dilute in the eastern part of the Gulf, where intense and relatively barotropic gyres mix it with Indian ocean Central Water. RSOW is also de-tected along the northeastern coast of Socotra, and fragments of RSOW are found between one and three degrees of lati-tude north of this island. In the whole Gulf of Aden, the cor-relation between the deep motions of the floats and the sea-level anomaly measured by altimetry is strong, at regional scale. The finer scale details of the float trajectories are not sampled by altimetry and are often related to the anomalous water masses that the floats encounter.
The Persian Gulf Water (PGW) is found in the float pro-files near Ras ash Sharbatat (near 57◦E, 18◦N), again with
36.5 in salinity and about 18–19◦C in temperature. These
observations were achieved in winter when the southwest-ward monsoon currents can advect PGW along the South Arabian coast. Fragments of PGW were also observed in
the Arabian Sea between 18 and 20◦N and 63 and 65◦E in
summer, showing that this water mass can escape the Gulf of Oman southeastward, during that season.
Kinetic energy distributions of floats with respect to dis-tance or angle share common features between the two re-gions (Gulf of Aden and Arabian Sea), in particular peaks at 30, 50 and 150 km scales and along the axis of monsoon currents. Hydrological measurements by floats are also in-fluenced by the seasonal variations of PGW and RSOW in these regions.
1 Introduction
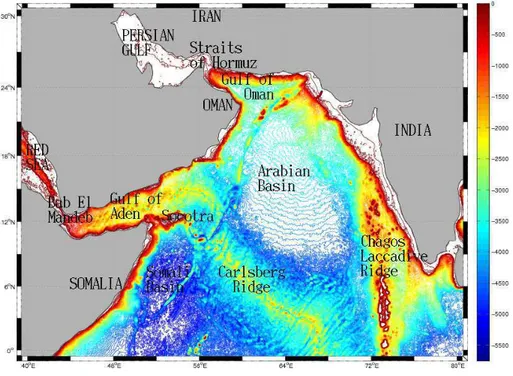
The Northwestern Indian Ocean is composed of the 3000– 5000 m deep Arabian Basin bounded east by the shallower Chagos-Laccadive ridge and the Indian continental shelf and west by the shallower Gulf of Aden. The Arabian Sea is bounded south by the Carlsberg Ridge (see Fig. 1). South-west of the Arabian Sea, the Somali Basin has the largest depths (deeper than 5000 m; Tomczak and Godfrey, 2003). This oceanic region is connected to two evaporation basins, the Persian Gulf (with depths shallower than 90 m and mean depth of 25 m), and the Red Sea (with maximum depths near 2740 m and mean depth of 490 m). These two basins produce salty waters which flow into the Arabian Sea (see below).
The circulation and water masses in the Arabian Sea are strongly influenced by the monsoon winds and by the in-tense air-sea heat fluxes (Johns et al., 2000). The winter monsoon winds blow to the Southwest from December to April. In the Arabian Sea, the surface oceanic currents form a cyclonic gyre in January, which weakens in March (Kindle and Arnone, 2001). During the winter monsoon, the mixed layer deepens strongly offshore, a priori due to convective overturning in mid-basin, while the dominant Ekman trans-port is shoreward (Lee et al., 2000). The summer monsoon winds blow to the Northeast from June to October. They are usually stronger than the winter monsoon winds and lead to faster currents. During the summer monsoon, a swift north-eastward current (the East Arabian Current) flows south of the Arabian Peninsula, and forms the northern part of the re-gional anticyclonic gyre.
During the summer monsoon, upwelling occurs on the Southern coast of Oman, near Ras al Madrakah-Ras ash Sharbatat (Shi et al., 2000). Moreover, between early May and end of October, a jet-front system forms at Ras al Hadd
(southeast of Oman), as cool upwelled waters of the South-ern Omani coast meet the warmer waters of the Gulf of Oman (B¨ohm et al., 1999). The associated southeastward jet is con-fined between two counter-rotating eddies (one cyclonic to the north and an anticyclonic one to the south).
During the same period, the northeastward Somali Cur-rent is also strongly intensified (Schott and Fisher, 2000). It is then accompanied offshore by a large anticyclonic eddy, the “Great Whirl”. During summer, the monsoon winds also generate upwelling along the Somali coast. The cold and fresh upwelled waters (with temperatures of 17–18◦C) are in strong contrast with the oceanic surface waters (temperatures
of 28–29◦C). Note that upwellings are also observed along
the southwestern coast of India during the summer monsoon. Furthermore, the Arabian Sea is a region of strong evap-oration (the E − P budget is on the order of 150 cm yr−1). Thus, surface salinity as high as 36 can be found in its north-ern part.
The circulation in the Gulf of Aden, and in the Gulf of Oman, is more complex, formed of local cyclonic and anti-cyclonic gyres (Bower et al., 2002; Fratantoni et al., 2006; Bower et al., 2000; Pous et al., 2004b). In the Gulf of Oman, one or two large cyclonic gyres have been identified by these authors. In November, due to winds blowing along the axis of the Persian Gulf, and which also affect the Gulf of Oman, upwelling can appear along the Iranian coast in the Gulf of Oman (and in the Persian Gulf, Pous et al., 2004a, b). In the Gulf of Aden, the Somali Current Ring and the Gulf of Aden Eddy appear at the end of the summer and winter monsoons respectively, and the Gulf of Aden eddy propagates westward into the Gulf while the Somali Current Ring remains rela-tively stationary at the entrance of the Gulf. Recently, Bower and Furey (2011) have shown the existence of two other ed-dies in the Gulf of Aden: the Lee Eddy and the Summer Eddy which form early during the summer monsoon due to strong winds blowing through the Socotra Passage.
The Northwestern Indian Ocean is noticeably influenced by the Persian Gulf and by the Red Sea. These two adja-cent seas produce warm and salty waters (the Persian Gulf Water, PGW and the Red Sea Outflow Water, RSOW) which penetrate into the Northwestern Indian Ocean via the Gulf of Oman, and the Gulf of Aden, where they equilibrate at depths of 200–300 m and 600–1000 m respectively (Bower et al., 2000; Pous et al., 2004b; Bower et al., 2005). The Red Sea Water enters the Gulf of Aden with a temperature close to 22◦C and a salinity close to 40. These values decrease to
16◦C and 36 once this water has mixed with surrounding
wa-ters (Indian ocean Central Water, ICW) and the RSOW set-tles at depths of 600 to 900 m in the Arabian Sea; from there, it follows the East African coast southward. Near 30◦S, the RSOW is found at depths of 1000 to 1100 m. The Persian Gulf Water has similar temperature and salinity values (22◦C and 40) in the northern part of the Straits of Hormuz. Strong mixing with Indian Ocean Surface Water (IOSW) decrease the thermohaline characteristics of the outflowing water to
about 20◦C and to 37.5 in the Gulf of Oman where the
equi-librium depth of PGW is about 200–250 m; the PGW charac-teristics decrease to 17◦C and 36.2 in the northern Arabian
Sea where its equilibrium depth is about 300 m (Prasad et al., 2001).
The other water masses in the region are the ICW, which originates from the Subtropical Convergence and lies in and above the thermocline (Tomczak and Godfrey, 2003). Its
temperature range is 17◦C to 5◦C from top to bottom, and
its salinity varies from 35.5 to 34.8. It also bounds the warm and salty outflow water masses of the Northern Arabian Sea on their Southeastern side.
Below the ICW, lies the Indian Deep Water (IDW, at depths between 1500/2000 m and 3800 m, with potential
temperature of 2.5◦C and salinity of 34.8) and finally the
Antarctic Bottom Water (AABW), below 3800 m depth, with potential temperature of 0.3◦C and salinity of 34.7.
In this paper, we will investigate the regional and mesoscale variability of the upper water masses (above 2000 m depth) with hydrological data gathered by ARGO floats. ARGO is an international program for the monitor-ing of the global ocean, which relies on hydrological data collection by about 3000 profiling floats.
These floats are released at the surface at different loca-tions, dive to their 1000 m “parking depth” and most often remain there for 10 days (a few floats for 5 days only). Then they dive to 2000 m depth and perform a vertical profile of temperature and salinity up to the surface. When the floats surface, they transmit their data to the ARGO centers via satellites. This cycle is then repeated for the lifetime of the float. Once processed, the hydrological data can be mapped along the float trajectories, providing Lagrangian sections of temperature and salinity.
The paper is organised as follows: the dataset is presented and the floats retained for analysis are classified regionally. The long and short-term displacements of the floats are re-lated to the variations of water masses and to the possible presence of mesoscale anomalies. Deep mesoscale displace-ments are studied in relation with surface motion provided by altimetric maps.
2 Data and methods
ARGO float data were obtained from the ARGO Regional Center for the Indian Ocean (INCOIS, Indian Government). In the database, 43 floats were identified with a mission be-ginning north of 12◦N (i.e. a surface release north of this
latitude). Among them, eight floats were discarded because of too short missions. Two floats were discarded because of erroneous hydrological data. Two floats evidenced position-ing or date problems (showposition-ing jumps). Finally, thirteen floats were not analysed since most or all of their trajectory lay east
of 65◦E, while this paper concentrates on the Arabian Sea
Fig. 1. Bathymetry of the Arabian Sea (from ETOPO1 database).
20 float trajectories and hydrological datasets were studied. Here, the analysis of 5 floats is presented. When a float per-formed a multi-year mission, its data were segmented into yearly bins starting at the date of float release. Temperature and salinity were plotted along the trajectories, as vertical sections.
To evidence correlations between the float trajectories and local bathymetric anomalies, ETOPO1 bathymetric maps were extracted from the NGDC database.
To establish relations between motions at 1000 m depth and surface motions, altimetric maps were obtained from the CNES/AVISO satellite data center. Delayed-time sea-level
anomalies (SLA, with 1/3 ×1/3◦ resolution on a Mercator
grid and with daily interpolation), computed with respect to a 7-year mean of the sea surface topography, are used here to determine the correlation with the float motion.
For each float, we shall show the vertical/alongpath sec-tion of temperature and salinity, and we shall try to relate the major thermohaline anomalies with the water masses de-scribed in the introduction. We shall also plot the trajecto-ries superimposed on the bathymetry or on SLA. To establish quantitative correlations between the float trajectories and the bathymetry, we shall compute the angle between the trajec-tory and the isobaths at each position, and plot this angle versus time.
For each float, we shall compute Lagrangian velocities from the distance and time-lag between two surfacings; these surfacings can be consecutive, or separated by two cycles or more. We shall plot the kinetic energy distribution thus ob-tained with respect to the distance covered by the float, or
with respect to the orientation of its trajectory. Note that the orientation is given between –90◦and +90◦, with the origin on the eastward axis. The direction of the flow (e.g. eastward or westward for a zero degree angle) is here less important. For instance, energy in both northeastward and southwest-ward directions reflects the influence of monsoon currents.
Also, our analysis of the floats energy assumes that the flow field has global homogeneity, isotropy and stationar-ity. These hypotheses will be tested by computing the energy distributions for several floats (thus having different starting points and different trajectories), and for different periods of the year.
3 Gulf of Aden 3.1 Float 1900432
Float 1900432 was released 8 April 2007 near 45◦52′E,
11◦58′N, and its mission ended on 17 October 2007 near
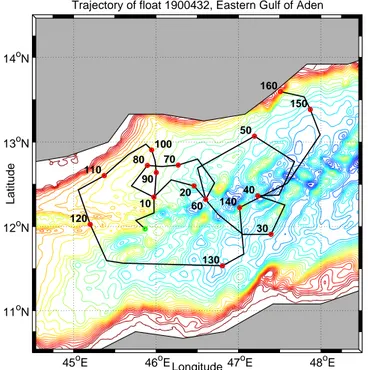
46◦40′E, 13◦24′N. We terminated the analysis of its data on the 23 September 2007 since the last hydrological measure-ments were not realistic. The 4-day cycle of the float allowed the observation of short-term loops.
Its motion, shown on figure 2 was mostly cyclonic. Firstly, the trajectory was northeastward from about 46◦N, 12◦E to 46◦30′E, 12◦30′N for 20 days. Then the float performed one large cyclonic loop with diameter of about 100 km, for 40 days, in the area spanning 46◦30′E to 47◦30′E and 11◦50′N to 13◦05′N; this large loop was followed by two small cy-clonic loops at 12◦30′N near 46◦40′E and 45◦50′E, between
45oE 46oE 47oE 48oE 11oN 12oN 13oN 14oN 10 20 30 40 50 70 80 110 120 130 140 150 160 60 90 100 Longitude Latitude
Trajectory of float 1900432, Eastern Gulf of Aden
Fig. 2. Trajectory of float 1900432 in the Gulf of Aden,
super-imposed on bathymetry; the green dot is the starting point of the trajectory; positions every 10 days are indicated by a red dot.
days 56 and 100 of the mission. Then a larger loop (with di-ameter of about 100 km) was performed cyclonically until
day 128 (in the area between 12◦N and 13◦N and between
46◦E and 45◦E). Finally, the float drifted northeastward to
48◦E, 13◦N and then northwestward to 47◦30′E, 13◦30′N.
Velocities ranged between 4 and 20 cm s−1.
The kinetic energy distribution with respect to horizon-tal displacement is shown in Fig. 3; this distribution shows four relative maxima (we consider that a wide peak in the curve, or two peaks very close to each other constitute a sin-gle maximum). The largest kinetic energy (K ≈ 0.03 m2s−2) is found at horizontal scales of 40 km, most likely, in relation with the two small loops with swift motion of the float; a second relative maximum is formed of two peaks, at 60 and 80 km horizontal scales; this can be related to the fast and small zonal motions of the float and to the cycloidal motion superimposed on the large loops in its trajectory; the third relative maximum occurs for 120 km horizontal scales, in re-lation with the large loops themselves. Finally, the peak at 170–190 km can be associated with the large zonal motion of the float. In the large loops, the float velocity was about 5 cm s−1. This value is in agreement with Bower and Furey’s findings (2011): the velocities in the RSOW are weaker in the western Gulf of Aden (5 cm s−1) than in the eastern gulf (15 cm s−1). Unfortunately, the time-life of the float was too short to test the invariance of this spectrum to the period of the year (this point will be addressed in more details in Sect. 5 of the paper). One can only state that the larger scale
0 50 100 150 200 250 300 0 0.005 0.01 0.015 0.02 0.025 0.03 0.035 Length (km) Kinetic energy (m 2/s 2)
Spatial energy distribution for 1900432
−80 −60 −40 −20 0 20 40 60 80 0 0.002 0.004 0.006 0.008 0.01 0.012 0.014 0.016 Kinetic Energy (m 2/s 2) Phi (degree) Angular distribution for 1900432
Fig. 3. Distribution of Lagrangian kinetic energy (in m2s2) with respect to horizontal displacement (top) and to the orientation of the displacement (bottom), for float 1900432.
motions occured at the end of the mission, that is, in late summer, early fall.
This figure also shows the energy distribution versus the angle of the flow. This distribution has two peaks at φ =
+25◦ and −15◦ corresponding to the along-gulf
displace-ments, and at φ = +65◦and −75◦corresponding to
across-gulf displacements. Obviously, energy is also found at other angles (e.g. at φ = −35◦) since several loops were present in the trajectory.
The float motion superimposed on the bathymetry is shown in Fig. 2. The angle between the trajectory and the isobaths was computed and plotted versus time (figure not shown). This angle was often larger than 45◦; it was smaller
than 20◦ only at days 80–90 and 110–120. This confirms
that the correlation between isobaths and float trajectories was weak except close to the continental slope.
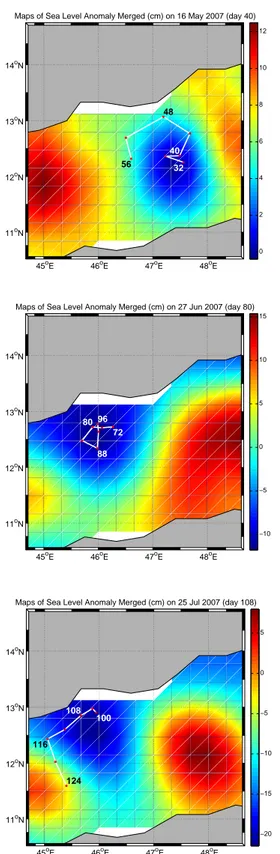
The float motion is now compared with the surface flow, given by the SLA. On day 40 of the mission (16 May),
45oE 46oE 47oE 48oE 11oN 12oN 13oN 14oN 32 40 48 56
Maps of Sea Level Anomaly Merged (cm) on 16 May 2007 (day 40)
0 2 4 6 8 10 12 45oE 46oE 47oE 48oE 11oN 12oN 13oN 14oN 72 80 88 96
Maps of Sea Level Anomaly Merged (cm) on 27 Jun 2007 (day 80)
−10 −5 0 5 10 15 45oE 46oE 47oE 48oE 11oN 12oN 13oN 14oN 100 108 116 124
Maps of Sea Level Anomaly Merged (cm) on 25 Jul 2007 (day 108)
−20 −15 −10 −5 0 5
Fig. 4. From top to bottom, sea-level anomaly (SLA) maps of 16
May, 27 June and 25 July 2007 (days 40, 80 and 108 of the mission). The trajectory of float 1900432 is superimposed on each map. Red dots correspond to the position of this float every 4 days; the number close to the dots is the mission day shown only every 8 days for clarity.
anticyclonic west of this longitude, were present in the SLA map (see Fig. 4). The float trajectory, superimposed on this SLA map, indicates that part of the large loop performed by the float from days 20 to 60, circled the cyclonic gyre. The small indentation in the trajectory between days 32 and 40 of the mission (8 May and 16 May) may be due to a positioning error, or to small scale flow not sampled by altimetry.
On 27 June (day 80 of the mission), the surface circula-tion was cyclonic west of 47◦E and anticyclonic east of that longitude. The float trajectory nearly circled the core of the cyclonic gyre. One month later (25 July or day 108 of the mission), the anticyclonic gyre had retreated to the southeast and the flow was cyclonic over most of the region; again the float circled anticlockwise around the cyclonic region and then followed the southwestward flow between the cyclone and the anticyclone.
Thus, the float motion was consistent with the surface cir-culation indicated by the SLA. Indeed, gyres in the Gulf of Aden have a noticeable barotropic component (Bower et al., 2002; Bower and Furey, 2011).
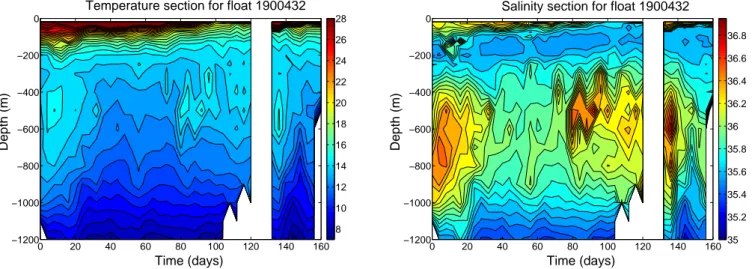
The water masses sampled by the float during its vertical profiles are now identified on the vertical sections of tem-perature and of salinity along the trajectory of float 1900432 (see Fig. 5).
From day 0 to 24 of the mission, the float encountered a warm and salty water mass, at depths between 400 m and
1000 m, with temperature ranging between 12◦C and 16◦C
and salinity between 35.8 and 36.5. The maximum temper-ature was slightly shallower than the maximum salinity (at 400–600 m versus 500–700 m). This water mass was clearly Red Sea Outflow Water. Very warm and salty waters were again found with peaks between days 80 and 100, and then at days 130–140. Thus RSOW was mostly confined west of
47◦E. Deep data were missing at days 108–116 and no
hy-drological data were returned at days 120 to 128, hence the gap observed in the temperature and salinity sections.
On the contrary, east of 47◦E, cooler and fresher water
was found in the 300–800 m depth range, with temperature
lying in the 9–13◦C interval and salinity between 35.5 and
35.8. This water was more likely ICW, mixed with RSOW, to account for the slightly larger salinity than that of pure ICW. This water was contained in the large cyclone which lay around 47◦E, 12◦30′N at day 40 of the mission. This confirms the conclusion drawn by Bower and Furey (2011) that westward drifting eddies can transport ICW into the Gulf of Aden and mix it with RSOW there.
Finally, the thermocline waters became thinner during the 6 months of the record, either because of wind-induced ver-tical mixing, or of lateral turbulent mixing, or because of the presence of cooler water close to the northern coast.
3.2 Float 2900392
Float 2900392 was released 30 September 2005 near 46◦13′E, 11◦44′N. In February 2010, when this study was
Time (days)
Depth (m)
Temperature section for float 1900432
0 20 40 60 80 100 120 140 160 −1200 −1000 −800 −600 −400 −200 0 8 10 12 14 16 18 20 22 24 26 28 Time (days) Depth (m)
Salinity section for float 1900432
0 20 40 60 80 100 120 140 160 −1200 −1000 −800 −600 −400 −200 0 35 35.2 35.4 35.6 35.8 36 36.2 36.4 36.6 36.8
Fig. 5. (Left) Vertical section of temperature (in◦C) along the trajectory of float 1900432 in the Gulf of Aden; (right) vertical section of salinity. 46oE 47oE 48oE 49oE 50oE 51oE 11oN 12oN 13oN 14oN 15oN 20 80 200 220 240 260 340 360
Trajectory of float 2900392, year 1, Gulf of Aden
Longitude Latitude 40 60 100 120 140 160 180 280 300 320
Fig. 6. Trajectory of float 2900392 in the Gulf of Aden,
superim-posed on bathymetry, year 1; the green dot is the starting point of the trajectory; positions every 20 days are indicated by a red dot.
initiated, this float was still active. Only the first two years of its mission are presented here (in two segments of one year each). This float had a 5-day cycle.
During year 1, the float drifted eastward for a month from 46◦13′E to 48◦15′E along 11◦40′N (see Fig. 6). Then, it
fol-lowed three loops, one anticyclonic, one cyclonic and then
a large anticyclonic one at 49–50◦E, and later it moved up
to 51◦E, 14◦40′N. Finally it came back swiftly southwest-ward along the coast of Yemen (again with a cyclonic loop). Clearly, the float trajectory was a combination of motion around gyres and of fast along-gulf displacement near the northern shore (during the fall intermonsoon).
Only a weak correlation of the float trajectory with the iso-baths was found, except in the last stage of the float evolution (between days 330 and 350 when the angle between the tra-jectory and the isobaths was smaller than 10◦).
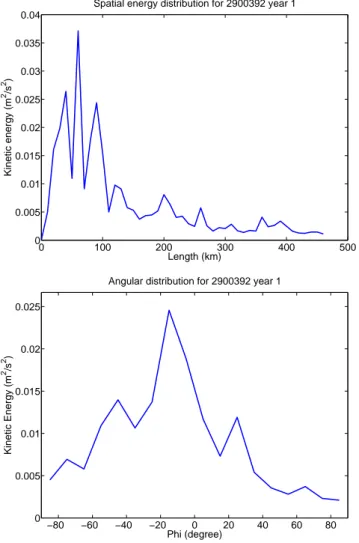
In the energy distribution (see Fig. 7), a wide peak at 30– 40 km horizontal scale corresponds to the small scale loops in the float trajectory, two peaks at 60 and 90 km can be related to the meanders in the trajectory, and we associate smaller peaks at 200 and 260 km with the large excursions of the float along the gulf axis. In the angular distribution of the energy, two peaks are found at –15◦and +25◦(as for float 1900432); this corresponds to displacements mostly along the Gulf axis. A peak at a –45◦angle can be related to the swift float motion at days 120–135, 160–200 and 300–340.
Altimetric data were used to determine the surface circu-lation (see Fig. 8). On day 115 of the mission (25 January 2006), a strong cyclonic gyre was present near 48◦30′E and 12◦30′N; this gyre had a tail on its southeastern side. The float trajectory was anticlockwise and followed this tail. On day 160 of the mission (8 March 2006), the circulation near 49◦30′E and 13◦N was strongly anticyclonic; the float
tra-jectory was clockwise and then followed the southeastward flow between this anticyclonic gyre and the cyclonic one on its eastern flank. Finally, on day 325 of the mission (23 Au-gust 2006), the regional gyre circulation was again cyclonic over the central part of the Gulf of Aden. The float trajectory was clearly anticlockwise around this gyre. This confirms the deep influence of the regional gyres observed in the al-timetry.
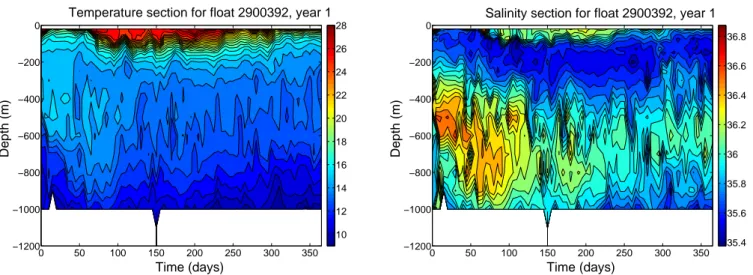
The thermohaline section along the float trajectory is dis-played in Fig. 9. During the first 100 days, the float sampled warm and salty RSOW. Again, the temperature and salinity
maxima were about 16◦C and 36.5, located respectively at
depths between 400 and 500 m and between 500 and 600 m. This thermohaline anomaly diminished as the float moved
0 100 200 300 400 500 0 0.005 0.01 0.015 0.02 0.025 0.03 0.035 0.04 Length (km) Kinetic energy (m 2/s 2)
Spatial energy distribution for 2900392 year 1
−80 −60 −40 −20 0 20 40 60 80 0 0.005 0.01 0.015 0.02 0.025 Kinetic Energy (m 2/s 2) Phi (degree)
Angular distribution for 2900392 year 1
Fig. 7. Distribution of Lagrangian kinetic energy (in m2s−2) with respect to horizontal displacement (top) and to the orientation of the flow (bottom), for float 2900392.
eastward, in particular after day 120 when the trajectory ex-hibited the large anticyclonic loop. Clearly, RSOW lay in the southwestern part of the Gulf of Aden at that time. Then, the temperature and salinity measured by the float at 600 m
depth were on the order of 12◦C and 35.8. Again, these
values were slightly above ICW characteristics, indicating mixing with RSOW. The surface layer became cooler and fresher in summer and warmer and saltier in winter when the winds were weaker (an observation similar to that of float 1900432).
During year 2, the float followed a series of cyclonic and anticyclonic meanders, with a large cyclonic loop around 48◦E, 12◦30′N for about 30 days (see Fig. 10). Then, the float moved rapidly northeastward for 20 days and performed a cyclonic loop between 51◦E and 52◦E, and 12◦30′N and
13◦30′N, for about 40 days. Then the float drifted back
southwestward, nearly to its starting point in less than 4 months. From there, it followed three meanders,
46oE 47oE 48oE 49oE 50oE 51oE 11oN 12oN 13oN 14oN 15oN 95 105 115 125
Maps of Sea Level Anomaly Merged (cm) on 25 Jan 2006 (day 115)
−5 0 5 10 15 20 25 46oE 47oE 48oE 49oE 50oE 51oE 11oN 12oN 13oN 14oN 15oN 140 150 160 170 Maps of Sea Level Anomaly Merged (cm) on 8 Mar 2006 (day 160)
−5 0 5 10 15 20 46oE 47oE 48oE 49oE 50oE 51oE 11oN 12oN 13oN 14oN 15oN 305 315 325 335
Maps of Sea Level Anomaly Merged (cm) on 23 Aug 2006 (day 325)
−20 −15 −10 −5 0 5
Salinity section for float 2900392, year 1
Fig. 8. From top to bottom, sea-level anomaly (SLA) maps of 25
January, 8 March and 23 August 2006 (days 115, 160 and 325 of the mission). The trajectory of float 2900392 is superimposed. Dots indicate the position of the float every 5 days. Mission days are indicated next to the dots.
Time (days)
Depth (m)
Temperature section for float 2900392, year 1
0 50 100 150 200 250 300 350 −1200 −1000 −800 −600 −400 −200 0 10 12 14 16 18 20 22 24 26 28 Time (days) Depth (m)
Salinity section for float 2900392, year 1
0 50 100 150 200 250 300 350 −1200 −1000 −800 −600 −400 −200 0 35.4 35.6 35.8 36 36.2 36.4 36.6 36.8
Fig. 9. Vertical sections of temperature (in◦C, left) and of salinity (right) along float 2900392 trajectory for year 1.
46oE 48oE 50oE 52oE 11oN 12oN 13oN 14oN 15oN 550 590 610
Trajectory of float 2900392, year 2
Longitude Latitude 390 410 430 450 470 490 510 530 570 630 650 670 690 710
Fig. 10. Trajectory of float 2900392 in the Gulf of Aden,
superim-posed on bathymetry, year 2; the green dot is the starting point of the trajectory; positions every 20 days are indicated by a red dot.
tively cyclonic, anticyclonic and cyclonic, up to 50◦E, 14◦N and finally drifted back southwestward again. This trajec-tory illustrates the combination of fast along-gulf currents, especially near its northern coast (with a reversal of direc-tion between winter monsoon and spring intermonsoon), and of large cyclonic and anticyclonic gyres at the center of this gulf.
Correlation of the float motion with the isobaths orienta-tion was again weak, except close to days 450 and 550 when the float moved along the northern coast.
The kinetic energy distribution (not shown) has peaks at 40, 80, 140 and 400 km, corresponding respectively to the small and medium size gyres or meanders, for the first three, and to the fast along gulf motion at days 500–600, for the latter. The energy distribution versus the angle has maxima at +20◦and –80◦, which are the along-gulf and across-gulf orientations.
The altimetric maps agree with this circulation (see Fig. 11): in November 2006, the surface gyre was cyclonic above the first cyclonic loop of the float. In January 2007, the float first moved clockwise around the anticyclone at 50◦E, 13◦30′N; then the float performed a cyclonic loop
at 1000 m depth under a cyclonic surface gyre, located near 52◦E, 14◦N. Finally, a clear correlation can also be
estab-lished between the anticyclonic loop of the float near 48– 50◦E and 13–13◦30′N, and an anticyclonic surface gyre in July 2007.
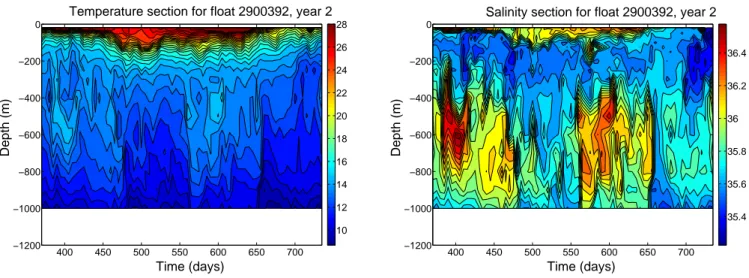
Again (see Fig. 12), thermohaline sections along the float trajectory show that warm and salty water lay in the west-ern part of the Gulf around cyclonic gyres a depths close to 600 m. This water had the same thermohaline maxima as
in year 1 (about 16.5◦C and 36.5 at respectively 500–600 m
depth and 600–700 m depth), and thus was a priori RSOW.
Colder and freshed water (with temperature of 10–12◦C and
salinity of 35.5–35.8) was sampled by the float at days 500– 550 and 650–700, in the northeastern part of the gulf. Again this water was ICW mixed with RSOW by the large gyres.
4 Arabian Sea 4.1 Float 2900104
Float 2900104 was released on 14 March 2006 at 54◦02′E,
11◦42 N. Its last data were collected 25 August 2009 at
60◦45′E, 17◦10′N. Here, we present the first two years of
its evolution. Its cycle period is 10 days.
During the first year, the float drifted northeastward to
56◦E, 13◦N and then northwestward to 54◦30′E, 14◦N
within about 100 days (see Fig. 13). It remained stationary near this position for about two months, then it performed
a cyclonic loop between this position and 56◦E and 15◦N.
After day 250, it followed a large anticyclonic loop (with strong zonal predominance) up to 58◦E and to 17◦30′N for
46oE 47oE 48oE 49oE 50oE 51oE 52oE 11oN 12oN 13oN 14oN 15oN 400 410 420 430
Maps of Sea Level Anomaly Merged (cm) on 22 Nov 2006 (day 420)
−20 −15 −10 −5 0 5 10 15 20 25 46oE 47oE 48oE 49oE 50oE 51oE 52oE 11oN 12oN 13oN 14oN 15oN 455 465 475 485
Maps of Sea Level Anomaly Merged (cm) on 17 Jan 2007 (day 475)
−15 −10 −5 0 5 10 15 20 25 46oE 47oE 48oE 49oE 50oE 51oE 52oE 11oN 12oN 13oN 14oN 15oN 620 630 640 650
Maps of Sea Level Anomaly Merged (cm) on 4 Jul 2007 (day 640)
−15 −10 −5 0 5 10 15
Fig. 11. From top to bottom, sea-level anomaly (SLA) maps of 22
November 2006, 17 January 2007 and 4 July 2007 (days 420, 475 and 640 of the mission). The trajectory of float 2900392 for year 2 is superimposed. Dots indicate the position of the float every 5 days. Mission days are indicated next to the dots.
the last three months of its first year. The three main peaks of the kinetic energy distribution (not shown) are at 50, 90 and 160 km. Another peak lies at 220 km. The smaller scales correspond to the motion of the float from day 50 to 250; the larger scale motions occur at days 0 to 50 and 250 to 350.
The angular distribution has maxima at +25◦and +45◦and
at –55◦. This can be simply correlated with the trajectory, the former two for the drift at days 0–50 and 250–350 and for the orientation of the loop at days 150–200, and the latter for the segments of trajectory at days 250–260 and 300–310. The temperature and salinity sections along the trajectory show evidence of a cooling and of a freshening of the surface layer in August and September 2006 (days 140 to 200 of the mission), a priori in relation with strong summer monsoon winds (see Fig. 14).
At depths between 300 and 800 m, a core of cold and fresh water was sampled by the float between days 0 to 20, 180
to 210 and 260 to 270. With temperatures of 8 to 12◦C and
salinities of 35.1 to 35.4, this was likely ICW.
At depths between 400 and 900 m, two cores of warm and salty Red Sea Outflow Water were present from day 30 to 60, and from day 140 to 160. The first warm core was lo-cated east of Socotra, near the continental slope; this core of RSOW flowed around the island. The salinity and
tem-perature at 700 m depth were about 35.9 and 12◦C. Similar
maxima were found again near day 160, at the same depth, as the float was much farther north (near 55◦30′E, 14◦10′N). At that time, the float performed a cyclonic loop, and a cold core was sampled on the northern part of this loop. We inter-pret these two events as the advection of a detached fragment of RSOW by a cyclonic gyre.
Finally, in January–February 2007, a weak signature of
Persian Gulf Water (T ∼ 18◦C, S ∼ 35.9 at depths near 200–
300 m) was sampled by the float, as it came near Ras al Madrakah (near 57◦50′E, 19◦N).
In the altimetric map, a cyclonic surface signature was present between days 180 and 210 when the float followed a cyclonic trajectory near 55◦30′E, 14◦20′N (see Fig. 15). Early January 2007, the anticyclonic loop of the float near
57◦E, 16◦N was also related to an anticyclonic sea level
anomaly. Though the correspondence between float trajec-tory and SLA was not as strong as in the Gulf of Aden, the deep motion of the float could still be correlated with the sur-face motion at horizontal scales of 100 to 200 km, in this region.
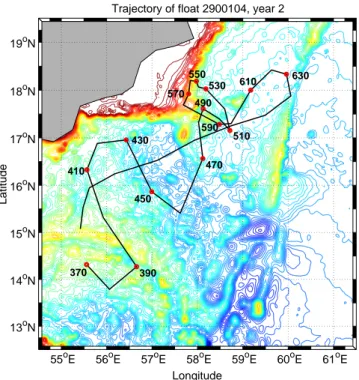
During year 2, float 2900104 performed successively a cy-clonic, an anticyclonic and a cyclonic loop, for about 40 days each, in a general northeastward direction (towards Ras ash Sharbatat (near 57◦E, 18◦N; see Fig. 16)). After about 150 days, the float followed a cyclonic loop northwestward to-wards this cape (for about 3 months), and then an anticy-clonic loop northeastward for about two months. The end of its trajectory (for year 2) was southwestward.
Time (days)
Depth (m)
Temperature section for float 2900392, year 2
400 450 500 550 600 650 700 −1200 −1000 −800 −600 −400 −200 0 10 12 14 16 18 20 22 24 26 28 Time (days) Depth (m)
Salinity section for float 2900392, year 2
400 450 500 550 600 650 700 −1200 −1000 −800 −600 −400 −200 0 35.4 35.6 35.8 36 36.2 36.4
Fig. 12. Vertical sections of temperature (in◦C, left) and of salinity (right) along float 2900392 trajectory for year 2.
54
oE 55
oE 56
oE 57
oE 58
oE
12
oN
14
oN
16
oN
18
oN
340Trajectory of float 2900104, year 1
Longitude
Latitude
20 40 60 80 100 120 140 160 180 200 220 240 260 280 300 320Fig. 13. Trajectory of float 2900104 in the Arabian Sea,
superim-posed on bathymetry, year 1; the black dot is the starting point of the trajectory; positions every 20 days are indicated by a red dot.
The energy peaks (not shown) are located at 50, 80, 120, 160 km horizontal scales, and with a smaller amplitude, at 220, 270, 320 and 410 km. The former four peaks corre-spond to the float motion between days 500 and 650 while the latter four correspond to the larger scale displacements near the beginning and end of this second year of mission (days 365–500 and 650–730). The energy distribution with respect to the orientation (not shown) peaks by far at a 25◦ angle, corresponding to the large scale ENE-WSW displace-ments of the float with the monsoon currents.
Only a weak correlation was found between this float tra-jectory and bathymetry, except at days 400–450 and 600– 650, but mostly over the abyssal plain. In fact, the corre-lation over the abyssal plain may be due to regional gyres (at 100 km scale), which remain east and west of Ras al Madrakah for long periods of time. When a float is trapped in these gyres, it remains over the abyssal plain and does not cross isobaths.
For this float, surface-depth correlations of motions were found at horizontal scales of 200 km, but those at 50 km scale were not always clear. At larger horizontal scales, (400– 500 km), the float trajectory reflected the monsoon currents.
The temperature and salinity data collected by this float during year 2 show evidence mostly of Persian Gulf out-flow Water, especially near days 500, 600 and 680 (about end of July, early November 2007 and mid January 2008; see Fig. 17). This water mass was thus found east of Ras ash Sharbatat and south of Ras al Madrakah, for the first two periods, and south of Ras ash Sharbatat for the latter. The stronger salinities for PGW were found in November and in January.
This indicates that (a) PGW can flow southwestward downstream of Ras ash Sharbatat, though most likely as frag-ments, (b) this flow intensifies during the transition from summer to winter monsoon, and during winter monsoon, as the large-scale, wind-induced circulation is southwestward.
Time (days)
Depth (m)
Temperature section for float 2900104, year 1
0 50 100 150 200 250 300 350 −1200 −1000 −800 −600 −400 −200 0 6 8 10 12 14 16 18 20 22 24 26 28 Time (days) Depth (m)
Salinity section for float 2900104, year 1
0 50 100 150 200 250 300 350 −1200 −1000 −800 −600 −400 −200 0 35 35.5 36 36.5
Fig. 14. Vertical sections of temperature (in◦C, left) and of salinity (right) along float 2900104 trajectory for year 1.
Colder and fresher waters were also identified at 200 depth around day 550 (early September 2007) and day 620 (mid November 2007). Indeed, in September, upwellings can develop near Ras ash Sharbatat and bring colder and fresher waters upward.
On the contrary, in November, isotherms rose above 300 m depth, but dived below 600 m depth. This structure of the isotherms, the values of temperature and salinity at depths between 300 and 600 m, and the anticyclonic loop in the float trajectory, point towards the existence of a deep anticyclone of ICW at that time and location. This anticyclone may have been generated earlier by the instability of the northeastward current along the southern coast of Oman (see also Lee et al., 2000).
4.2 Float 1900438
Float 1900438 was launched 18 November 2008 at 56◦20′E,
16◦04′N with a 4-day cycle, and its validated data ended
14 March 2009, at 54◦26′E, 16◦02′N. After that date, a 5 month long data gap occurs corresponding to a shift in posi-tion by 7 degrees east.
Its initial trajectory was mostly southwestward, in accor-dance with the monsoon current direction (see Fig. 18). On this global drift, two cyclonic loops were superimposed, one between days 35 and 50 and near 55◦E, 14◦N, the other one
between days 80 and 100 and near 52◦30′E, 14◦N. After 100 days, the float drifted back to the Northeast along the coast of Oman, perhaps in relation with an early reversal of the monsoon current.
The energy distribution with distances (not shown) has peaks at 30, 100 and 150 km horizontal scales, in agreement with the small and large loops and with the ENE-WSW dis-placements. In the angular distribution, the energy maxima lie at +30◦, –35◦, +65◦ and –75◦. The first orientation is
clearly related to the large-scale motion with the monsoon currents.
The angle between the trajectory and the isobaths (see Fig. 19) was most often small because the float crossed few topographic anomalies or flows along the continental slope. Nevertheless, the bottom topography did not seem to steer the float motion, but the currents with surface expression, or the anomalous water masses, did (see below).
The temperature and salinity sections of this float show the presence of PGW at 200 m depth during the first 20 days of the mission, south of Ras ash Sharbatat (near 57◦E, 18◦N); this was most likely a fragment detached from the PGW out-flow (see Fig. 20). Between days 32 and 50 (during the first loop in the trajectory), no deep thermohaline maximum ap-peared. But a noticeable RSOW signature was visible during the second loop and once the float drifted eastward, along the continental slope, towards 54◦40′E, 16◦N.
Again, there was a good correlation of the float trajec-tory with the SLA (see Fig. 21). Both cyclonic loops circled around surface depressions (days 36 and 72 of the mission) and the final clockwise motion of the float wrapped around a surface elevation (days 92 of the mission).
4.3 Float 2900394
This float was released on 27 June 2005 at 62◦33′E, 20◦50′N but a positioning problem occured for the first 10 days. Then, the trajectory was correct, but a major drift occured in tem-perature data for 40 days. Therefore the data were analysed only from day 50 onward. This float had a 5-day cycle.
Float 2900394 performed a series of anticyclonic loops between 63◦30′E and 64◦30′E and 19◦30′N and 21◦N for about 240 days starting from day 50 (see Fig. 22). The abrupt shift to the south between days 175 and 185 may be a positioning problem. Then, to the end of year 1, the
54oE 55oE 56oE 57oE 58oE 13oN 14oN 15oN 16oN 17oN 169 189 209
Maps of Sea Level Anomaly Merged (cm) on 20 Sep 2006 (day 189)
−35 −30 −25 −20 −15 −10 −5 0 5 54oE 55oE 56oE 57oE 58oE 13oN 14oN 15oN 16oN 17oN 284 304 324
Maps of Sea Level Anomaly Merged (cm) on 10 Jan 2007 (day 304)
−25 −20 −15 −10 −5 0 5 10 15
Fig. 15. Altimetric maps of 6 September 2006 (day 189 of the
mis-sion) and of 7 January 2007 (day 304 of the mismis-sion), with the tra-jectory of float 2900104 superimposed. Dots indicate the position of the float every 10 days.
float followed an anticyclonic trajectory from 64◦E, 20◦N to 65◦30′E, 19◦N and back to 63◦30′E, 18◦30′N.
The angle between the trajectory and the bathymetry var-ied rapidly with time, and did not indicate a durable correla-tion. The energy distribution with distance indicates a peak at 25 km, related to the small loops performed by the float (not shown). Its distribution with respect to the angle has peaks at
55oE 56oE 57oE 58oE 59oE 60oE 61oE 13oN 14oN 15oN 16oN 17oN 18oN 19oN 390 470
Trajectory of float 2900104, year 2
Longitude Latitude 370 410 430 450 490 510 530 550 570 590 610 630
Fig. 16. Trajectory of float 2900104 in the Arabian Sea,
superim-posed on bathymetry, year 2. A red dot indicates the position of the float every 20 days.
±85◦, related to the meridional motion. Other peaks at ±20◦
and ±40◦have smaller amplitudes.
The thermohaline anomalies identified during this period were located between 150 and 350 m depths (see Fig. 23).
Warm and salty water (17–18◦C, 36.2–36.4) was observed at
days 50–100, 150–240 and 270–320. This was clearly PGW and it was concentrated near 20–21◦N, 63◦30′E–64◦30′E. Considering the float motion, this may have been an eddy of PGW. On the contrary, a cold and fresh anomaly was sampled around day 340. This water may have originated from the Ras al Madrakah upwelling which was active then.
The altimetric maps during the September 2005–April 2006 period, in the 63–65◦E, 18–21◦N region, did not show durable correlations with the float trajectory, except during the last two months. This suggests that the anticyclonic mo-tions of the float during its first eight months were more re-lated to the deep, warm and salty water masses, that it en-countered.
During the second year, the trajectory of float 2900394 was mostly southeastward, with one small anticyclonic loop near 64◦30′E, 18◦N, and two cyclonic loops near 64◦30′E,
17◦N and 65◦E, 17◦30′N (see Fig. 24). This repeated
south-eastward drift of float 2900394 indicates the presence of a current in this direction, in summer, from the mouth of the Gulf of Oman. This current is a priori the Ras al Hadd jet. The correlation with altimetry was more durable for the large cyclonic motions. The vertical sections of temperature and of salinity showed again three blobs of PGW at days 420– 510, 550–600, 650–680 (see Fig. 25). During the first time
Time (days)
Depth (m)
Temperature section for float 2900104, year 2
400 450 500 550 600 650 700 −1200 −1000 −800 −600 −400 −200 0 6 8 10 12 14 16 18 20 22 24 26 28 Time (days) Depth (m)
Salinity section for float 2900104, year 2
400 450 500 550 600 650 700 −1200 −1000 −800 −600 −400 −200 0 35 35.5 36 36.5
Fig. 17. Vertical sections of temperature (in◦C, left) and of salinity (right) along float 2900104 trajectory for year 2.
52oE 53oE 54oE 55oE 56oE 57oE 13oN 14oN 15oN 16oN 17oN 20 40 80 100 120 Trajectory of float 1900438 Longitude Latitude 60
Fig. 18. Trajectory of float 1900438 in the Arabian Sea,
superim-posed on bathymetry. A green dot indicates the initial position of the float; red dots mark the position of the float every 20 days.
interval, a small anticyclonic loop was achieved by the float; two cyclonic loops were performed during the two other pe-riods.
5 Discussion
Here, we discuss two points which concern all floats: the dependence of the spatial distribution of kinetic energy with respect to location or time, and the correlation of temperature and salinity measurements by the floats with the regional cli-matology. 0 20 40 60 80 100 −80 −60 −40 −20 0 20 40 60 80 Time (days) Angle (degree)
Angle between isobaths and trajectory for float 1900438. Correlation =9.6652 degree
Salinity section for float 1900438
Fig. 19. Angle between the isobaths and the trajectory of float
1900438 with respect to time.
Firstly, we study the homogeneity, isotropy and stationar-ity of the kinetic energy distributions.
In the Gulf of Aden, these distributions for the two floats concerned, for each year, and even for each season, showed the following: The distribution with respect to the distance had three peaks, at 30, 60 and 160 km, this latter being slightly less marked during the summer. The annual distri-butions with respect to the angle had peaks at ±20◦, +60◦, –40◦, and –80◦, while the seasonal distribution had peaks at +20◦, +60◦in summer and at –20◦and –80◦in winter.
From this we can conclude that the same scales of motion were present in both seasons and at different locations in the Gulf, mostly due to the gyres which occupied it. Though our database is limited, so that conclusions are difficult to draw for the orientation of the trajectories with respect to seasons, we observed twice a westward-southwestward cur-rent (angle of +20◦) along the coast of Yemen at the end of
Time (days)
Depth (m)
Temperature section for float 1900438
0 20 40 60 80 100 120 −1200 −1000 −800 −600 −400 −200 0 8 10 12 14 16 18 20 22 24 26 Time (days) Depth (m)
Salinity section for float 1900438
0 20 40 60 80 100 120 −1200 −1000 −800 −600 −400 −200 0 35 35.2 35.4 35.6 35.8 36
Fig. 20. Vertical sections of temperature (in◦C, left) and of salinity (right) along float 1900438 trajectory.
the winter monsoon. This can be related with the presence of cyclones at this location, already described by Bower and Furey (2011).
In the Arabian Sea, the peaks in the distribution of kinetic energy with respect to distance were found at 30, 60, 100 and 150 km, except for float 2900394 for which the energy was concentrated by far at the 20–25 km scale. The peaks at scales of 60 and 100 km were related to gyre motion.
Concerning the orientation of motion, the energy peaks
at +20◦ to +40◦were present for all floats. This peak was
usually related to large scale displacements on seasonal time scales (related to monsoon currents). Other peaks were re-lated to gyre motions or to local currents such as the Ras al Hadd jet.
Therefore, there was similarity in the dominant scales of motion between floats in the Arabian Sea, but also between the Arabian Sea and the Gulf of Aden.
Secondly, we compare the vertical sections of temperature and salinity obtained by the floats to the climatological tem-perature and salinity maps at 300 and 600 m depth (the depth of PGW and RSOW or ICW). These maps are given in ap-pendix (see Figs. A1 and A2).
In the Gulf of Aden, the climatological maps show a zonal gradient of temperature and salinity, which intensifies in May. This gradient is shifted eastward and is weaker in November. During the 160 days of its mission, float 1900432
measured a maximum thermohaline gradient near 46◦30′E
as in the climatology. Float 2900392 evolved mostly east of this longitude and was thus located in a region of weaker salinity anomaly. From January to May, the climatology indi-cates that the warm and salty water at 600 m depth and east of 46◦30′E, extends eastward along the coast of Yemen. Later in the year, this eastward extension occurs rather along the coast of Somali. For years 1 and 2, float 2900392 resided more often in the northern part of the Gulf of Aden. Thus it showed stronger salinity anomalies from September to
March than later in the year. During year 2, float 2900392 showed salinity maxima at days 400 and 600 at its western-most position in the Gulf (near 47◦E).
In the Arabian Sea, a positive salinity anomaly is observed in the climatology north of Socotra, at 600 m depth; this anomaly is most marked in July. Float 2900104 also indi-cated a salinity anomaly near 14◦N, 54–56◦E at this depth and in May-September (year 1). The same float measured a PGW anomaly near Ras al Madrakah in mid January (year 1); the climatological salinity map at 300 m also shows a wide extent of the PGW plume at this location in January (see Fig. A). Float 2900104 showed again strong salinity anoma-lies at 300 m depth in early August, mid November and in January (year 2). Climatology indicates that this is the pe-riod of maximum extent of PGW along the southern coast of Oman. PGW was also measured by float 1900438 off Ras ash Sharbatat in November; this corresponds to the large ex-tent of PGW in the climatology at that time. The same float
sampled RSOW near 53◦E and 14–15◦N in January, again at
a time of wide extent of RSOW along the coast of Yemen, in the climatology. Finally, float 2900394 sampled PGW near
64◦E, both during year 1 (near 20–21◦N) and during year
2 (near 16–17◦N), except in March–May. Climatology
in-dicates that PGW extends south of 20◦N at 64◦E except in
March–May.
6 Conclusions
The data from five profiling floats in the Gulf of Aden and in the Arabian Sea have been analysed. Their trajectories and thermohaline anomalies at depth have been compared with surface motions, with bathymetry and with climatolog-ical water masses.
52oE 53oE 54oE 55oE 56oE 57oE 13oN 14oN 15oN 16oN 17oN 24 32 40 48
Maps of Sea Level Anomaly Merged (cm) on 24 Dec 2008 (day 36)
−20 −10 0 10 20 30 52oE 53oE 54oE 55oE 56oE 57oE 13oN 14oN 15oN 16oN 17oN 60 68 76 84
Maps of Sea Level Anomaly Merged (cm) on 28 Jan 2009 (day 72)
−20 −15 −10 −5 0 5 10 15 20 25 30 52oE 53oE 54oE 55oE 56oE 57oE 13oN 14oN 15oN 16oN 17oN 80 88 96 104
Maps of Sea Level Anomaly Merged (cm) on 18 Feb 2009 (day 92)
−15 −10 −5 0 5 10 15 20 25
Fig. 21. From top to bottom, sea-level anomaly (SLA) maps of
24 December 2008, 28 January and 19 February 2009 (days 36, 72 and 92 of the mission) with the trajectory of float 1900438 super-imposed. Dots correspond to the position of this float every 4 days. Mission days are indicated next to the dots.
63oE 64oE 65oE 66oE 18oN 19oN 20oN 21oN 22oN 200 250 300 350 400
Trajectory of float 2900394, year 1 from day 50
Longitude
Latitude
100 150
Fig. 22. Trajectory of float 2900394, for year 1 from day 50,
super-imposed on bathymetry. A green dot indicates the initial position of the float; red dots mark the position of the float every 50 days.
Clearly, if a strong correlation between surface and deeper motions could often be established at 100–200 km scale, loops with 30–40 km diameter, performed by the floats were not sampled by altimetry, due to its resolution. Some of these small loops could be correlated with thermohaline anomalies at the same scale and at the depth of PGW or of RSOW. The float trajectories also reflected the large-scale wind-induced circulation.
Time (days)
Depth (m)
Temperature section for float 2900394, year 1 from day 50
50 100 150 200 250 300 350 −1200 −1000 −800 −600 −400 −200 0 10 12 14 16 18 20 22 24 26 28 Time (days) Depth (m)
Salinity section for float 2900394, year 1 from day 50
50 100 150 200 250 300 350 −1200 −1000 −800 −600 −400 −200 0 35.2 35.4 35.6 35.8 36 36.2 36.4 36.6 36.8
Fig. 23. Vertical sections of temperature (in◦C, left) and of salinity (right) along float 2900394 trajectory for year 1 from day 50.
63oE 64oE 65oE 66oE 16oN 17oN 18oN 19oN 450 500 650 700 550 600
Trajectory of float 2900394, year 2
Longitude
Latitude
400
Fig. 24. Trajectory of float 2900394, for year 2, superimposed on
bathymetry. A green dot indicates the initial position of the float; red dots mark the position of the float every 50 days.
In summary, the circulation in the Gulf of Aden is clearly composed of cyclonic and anticyclonic gyres at regional scale, observed in SLA, as mentioned in the literature, and with a barotropic character. The circulation in the Arabian Sea is also influenced by mesoscale gyres near the coast of Oman, which are well observed in altimetric data. More south, the circulation is complex and the float trajectories are less well correlated with SLA.
The scale and angular distribution of kinetic energy repre-sents quite faithfully the different elements of the float tra-jectories. This distribution has common features from float to float or from year to year in a given region.
The correlation of the float trajectories with bathymetry was poor, except in one case; but this event may have been related to a quasi-stationary gyre located in a region of weak bathymetric anomalies.
Concerning the evolution of water masses, the surface temperature and salinity are strongly influenced by the sea-sonal variations of the wind, or by its sudden intensification. The only deeper-reaching influence of the wind observed by the floats was the appearance of colder and fresher water masses at 200 m depths, a priori related to upwelling events. Deeper cold and fresh water masses (e.g. between 500 and 800 m depths) were observed under the form of deep eddies or fragments of ICW.
Time (days)
Depth (m)
Temperature section for float 2900394, year 2
400 450 500 550 600 650 700 −1200 −1000 −800 −600 −400 −200 0 10 12 14 16 18 20 22 24 26 28 Time (days) Depth (m)
Salinity section for float 2900394, year 2
400 450 500 550 600 650 700 −1200 −1000 −800 −600 −400 −200 0 35.2 35.4 35.6 35.8 36 36.2 36.4 36.6
Fig. 25. Vertical sections of temperature (in◦C, left) and of salinity (right) along float 2900394 trajectory for year 2.
Intense thermohaline anomalies were measured at the depths of PGW or of RSOW.
In the Gulf of Aden, temperature and salinity peaks of
16◦C and 36.5 were observed in the RSOW. The RSOW
signal measured by floats intensified notably when the float circulated cyclonically in the western Gulf of Aden. This was well related to climatology also. The float recordings al-lowed us to identify the outflow of RSOW from the Gulf of Aden on the continental slope near 55◦E and 13◦N. It also showed evidence of detached fragments of RSOW north of that location (near 14◦30′N).
In the Arabian Sea, temperature and salinity peaks of
19◦C and 36.5 were observed in the PGW at 300 m depth.
The PGW signal was observed near Ras al Hadd and Ras al Madrakah/Ras ash Sharbatat. This indicates that, under favorable conditions of monsoonal currents (in winter), the PGW outflow can veer around Ras al Hadd and extend south-west along the southern coast of Oman. Our observations also showed little PGW west of Ras ash Sharbatat. On the contrary, during summer, the PGW was exported southeast-ward from the Gulf of Oman; the Ras al Hadd jet was likely to focus this export in this direction.
Again, the seasonal variations of RSOW and PGW extent were observed in the float measurements in the Arabian Sea. Further work should investigate this water mass distribu-tion with more floats.
Appendix A
Climatological maps of temperature and salinity at 300 and 600 m depth
Acknowledgements. The authors are grateful to one referee
whose fine remarks and suggestions considerably improved the presentation and contents of this paper. The authors thank the ARGO program (ARGO Regional Center for the Indian Ocean, INCOIS, Indian Government) for providing the hydrological data of the profiling floats, to the CNES/AVISO center (France) for the altimetric maps, and to the NGDC/MGG (USA) for the ETOPO2 bathymetry. Thanks are due to Amy Bower for fruitful discussions
and suggestions. This work was supported by DGA under the
“COMINO” and “SYNBIOS” projects. Edited by: J. A. Johnson
48oE 54oE 60oE 66oE 72oE 8oN 12oN 16oN 20oN 24oN
Climatological temperature map at 300 m depth in January
12 13 14 15 16 17 18 19 48oE 54oE 60oE 66oE 72oE 8oN 12oN 16oN 20oN 24oN
Climatological salinity map at 300 m depth in January
35.2 35.4 35.6 35.8 36 36.2 36.4 36.6 36.8 37 48oE 54oE 60oE 66oE 72oE 8oN 12oN 16oN 20oN 24oN
Climatological temperature map at 300 m depth in March
12 13 14 15 16 17 18 19 20 48oE 54oE 60oE 66oE 72oE 8oN 12oN 16oN 20oN 24oN
Climatological salinity map at 300 m depth in March
35.5 36 36.5 37 48oE 54oE 60oE 66oE 72oE 8oN 12oN 16oN 20oN 24oN
Climatological temperature map at 300 m depth in May
12 13 14 15 16 17 18 19 48oE 54oE 60oE 66oE 72oE 8oN 12oN 16oN 20oN 24oN
Climatological salinity map at 300 m depth in May
35.2 35.4 35.6 35.8 36 36.2 36.4 36.6 36.8 37 37.2
Fig. A1. (Continued from previous page) Horizontal maps of temperature (in◦C, left) and salinity (right) at 300 m depth for January, March, May, July, September, November (from top to bottom), from the climatology.
48oE 54oE 60oE 66oE 72oE 8oN 12oN 16oN 20oN 24oN
Climatological temperature map at 300 m depth in July
12 13 14 15 16 17 48oE 54oE 60oE 66oE 72oE 8oN 12oN 16oN 20oN 24oN
Climatological salinity map at 300 m depth in July
35.2 35.4 35.6 35.8 36 36.2 36.4 36.6 36.8 48oE 54oE 60oE 66oE 72oE 8oN 12oN 16oN 20oN 24oN
Climatological temperature map at 300 m depth in September
12 13 14 15 16 17 48oE 54oE 60oE 66oE 72oE 8oN 12oN 16oN 20oN 24oN
Climatological salinity map at 300 m depth in September
35.2 35.4 35.6 35.8 36 36.2 36.4 36.6 48oE 54oE 60oE 66oE 72oE 8oN 12oN 16oN 20oN 24oN
Climatological temperature map at 300 m depth in November
12 13 14 15 16 17 18 48oE 54oE 60oE 66oE 72oE 8oN 12oN 16oN 20oN 24oN
Climatological salinity map at 300 m depth in November
35.2 35.4 35.6 35.8 36 36.2 36.4 36.6
48oE 54oE 60oE 66oE 72oE 8oN 12oN 16oN 20oN 24oN
Climatological temperature map at 600 m depth in January
10 11 12 13 14 15 16 17 48oE 54oE 60oE 66oE 72oE 8oN 12oN 16oN 20oN 24oN
Climatological salinity map at 600 m depth in January
35.2 35.4 35.6 35.8 36 36.2 36.4 36.6 36.8 37 48oE 54oE 60oE 66oE 72oE 8oN 12oN 16oN 20oN 24oN
Climatological temperature map at 600 m depth in March
10 11 12 13 14 15 16 17 18 19 48oE 54oE 60oE 66oE 72oE 8oN 12oN 16oN 20oN 24oN
Climatological salinity map at 600 m depth in March
35.2 35.4 35.6 35.8 36 36.2 36.4 36.6 36.8 37 37.2 48oE 54oE 60oE 66oE 72oE 8oN 12oN 16oN 20oN 24oN
Climatological temperature map at 600 m depth in May
10 11 12 13 14 15 16 17 48oE 54oE 60oE 66oE 72oE 8oN 12oN 16oN 20oN 24oN
Climatological salinity map at 600 m depth in May
35.2 35.4 35.6 35.8 36 36.2 36.4 36.6 36.8 37
Fig. A2. (Continued from previous page) Horizontal maps of temperature (in◦C, left) and salinity (right) at 600 m depth for January, March, May, July, September, November (from top to bottom), from the climatology.
48oE 54oE 60oE 66oE 72oE 8oN 12oN 16oN 20oN 24oN
Climatological temperature map at 600 m depth in July
10 11 12 13 14 15 16 17 18 48oE 54oE 60oE 66oE 72oE 8oN 12oN 16oN 20oN 24oN
Climatological salinity map at 600 m depth in July
35.2 35.4 35.6 35.8 36 36.2 36.4 36.6 36.8 37 48oE 54oE 60oE 66oE 72oE 8oN 12oN 16oN 20oN 24oN
Climatological temperature map at 600 m depth in September
10 11 12 13 14 15 16 17 18 48oE 54oE 60oE 66oE 72oE 8oN 12oN 16oN 20oN 24oN
Climatological salinity map at 600 m depth in September
35.2 35.4 35.6 35.8 36 36.2 36.4 36.6 36.8 37 48oE 54oE 60oE 66oE 72oE 8oN 12oN 16oN 20oN 24oN
Climatological temperature map at 600 m depth in November
10 11 12 13 14 15 16 17 18 48oE 54oE 60oE 66oE 72oE 8oN 12oN 16oN 20oN 24oN
Climatological salinity map at 600 m depth in November
35.2 35.4 35.6 35.8 36 36.2 36.4 36.6 36.8 37 37.2
References
B¨ohm, E., Morrison, J. M., Manghnani, V., Kim, H. S., and Flagg, C. N.: The Ras al Hadd jet: Remotely sensed and acoustic Doppler current profiler observations in 1994–1995, Deep-Sea Res. Pt. II, 46, 1531–1549, 1999.
Bower, A. S., Fratantoni, D. M., Johns, W. E., and Peters, H.: Gulf of Aden eddies and their impact on Red Sea Water, Geophys. Res. Lett., 29, 2025, doi:10.1029/2002GL015342, 2002. Bower, A. S. and Furey, H. H.: Mesoscale Eddies in he Gulf of
Aden and their Impact on the Spreading of Red Sea Outflow Water, Prog. Oceanogr., 96, doi:10.1016/j.pocean.2011.09.003, 2011.
Bower, A. S., Hunt, H. S., Price, J. F.: Character and dynamics of the Red Sea and Persian Gulf outflows, J. Geophys. Res., 105, 6387–6414, 2000.
Bower, A. S., Johns, W. E., Fratantoni, D. M., and Peters, H.: Equi-libration and circulation of Red Sea Outflow Water in the West-ern Gulf of Aden, J. Phys. Oceanogr., 35, 1963–1985, 2005. Fratantoni, D. M., Bower, A. S., Johns, W. E., and Peters, H.:
So-mali Current rings in the eastern Gulf of Aden, J. Geophys. Res., 111, C09039, doi:10.1029/2005JC003338, 2006.
Johns, W. E., Jacobs, G. E., Kindle, J. C., Murray, S. P., and Car-ron, M.: Arabian Marginal Seas and Gulfs, University of Miami Technical Report 2000-01, 2000 (available from RSMAS, U. Mi-ami, 4600 Rickenbacker Causeway, Miami Fl 33149, USA).
Kindle, J. C. and Arnone, R. A.: A review of the surface circu-lation of the Northern Arabian Sea, in: Proc. 1st International Conference on Fisheries, Aquaculture and Environment in the NW Indian Ocean, edited by: Claereboudt, M., Goddard, S., Al-Oufi, H., and MacIlwain, J., Sultan Qaboos University, Muscat, Sultanate of Oman, 113–122, 2001.
Lee, C. M., Jones, B. H., Brink, K. H., and Fisher, A. S.: The upper-ocean respecton to monsoonal forcing in the Arabian Sea: seasonal and spatial variability, Deep-Sea Res. Pt. II, 47, 1177– 1226, 2000.
Pous, S. P., Carton, X., and Lazure, P.: Hydrology and circulation in the Strait of Hormuz and the Gulf of Oman - Results from the GOGP99 experiment, 1. Strait of Hormuz, J. Geophys. Res., 109, C12037, doi:10.1029/2003JC002145, 2004a.
Pous, S. P., Carton, X., and Lazure, P.: Hydrology and circulation in the Strait of Hormuz and the Gulf of Oman – Results from the GOGP99 experiment, 2. Gulf of Oman, J. Geophys. Res., 109, C12038, doi:10.1029/2003JC002146, 2004b.
Prasad, T. G., Ikeda, M., and Prasanna Kumar, S.: Seasonal spread-ing of the Persian Gulf Water mass in the Arabian Sea, J. Geo-phys. Res., 106, 17059–17071, 2001.
Schott, F. A. and Fisher, J.: Winter Monsoon circulation of the Northern Arabian Sea and Somali Current, J. Geophys. Res., 105, 6359–6376, 2000.
Shi, W., Morrison, J. M., B¨ohm, E., and Manghnani, V.: The Oman upwelling zone during 1993, 1994 and 1995, Deep-Sea Res. Pt. II, 47, 1227–1247, 2000.
Tomczak, M. and Godfrey, J. S.: Regional Oceanography, Perga-mon Press, 2002, 391 pp., 2003.