HAL Id: hal-02073964
https://hal-enpc.archives-ouvertes.fr/hal-02073964v2
Submitted on 7 Mar 2021HAL is a multi-disciplinary open access
archive for the deposit and dissemination of sci-entific research documents, whether they are pub-lished or not. The documents may come from teaching and research institutions in France or abroad, or from public or private research centers.
L’archive ouverte pluridisciplinaire HAL, est destinée au dépôt et à la diffusion de documents scientifiques de niveau recherche, publiés ou non, émanant des établissements d’enseignement et de recherche français ou étrangers, des laboratoires publics ou privés.
Lump-sum vs. energy-efficiency subsidy recycling of
carbon tax revenue in the residential sector: A French
assessment
Cyril Bourgeois, Louis-Gaëtan Giraudet, Philippe Quirion
To cite this version:
Cyril Bourgeois, Louis-Gaëtan Giraudet, Philippe Quirion. Lump-sum vs. energy-efficiency subsidy recycling of carbon tax revenue in the residential sector: A French assessment. Ecological Economics, Elsevier, 2021, �10.1016/j.ecolecon.2021.107006�. �hal-02073964v2�
1
Lump-sum vs. energy-efficiency subsidy recycling of carbon tax
revenue in the residential sector: A French assessment
Cyril Bourgeois, Louis-Gaëtan Giraudet, Philippe Quirion
Preprint for Ecological Economics*
Abstract
Empirical evidence suggests that carbon taxes are best accepted when their revenue is used to finance abatement measures. This revenue recycling option has however received little attention in modelling assessments. With the aim of filling this gap, we assess the impact of the French carbon tax on energy use for residential heating and compare the cost-effectiveness and distributional impacts of two revenue recycling options: lump-sum payment and subsidies for home energy retrofits. We do so using Res-IRF, an energy-economy model that provides a highly detailed description of housing features (single vs. multi-family, energy efficiency, heating fuel) and key household characteristics (tenancy status, income). We find that the two recycling options offset the regressive impacts of the tax in comparable ways. Lump-sum recycling is particularly effective in reducing inequalities between owner-occupiers and tenants. In turn, subsidy recycling saves energy and increases comfort more cost-effectively. In the discussion, we further point to some advantages of subsidy recycling from both a political and administrative perspective.
Keywords: carbon tax, revenue-recycling, building sector, fuel poverty, energy efficiency subsidies JEL codes: D63, H23, Q47
Corresponding author: giraudet@centre-cired.fr. Affiliations. Bourgeois, Giraudet: Ecole des Ponts ParisTech, CIRED. Quirion : CNRS, CIRED. Acknowledgments. We gratefully acknowledge funding from Agence de
l’environnement et de la maîtrise de l’énergie (Ademe), Commissariat général au développement durable (CGDD), TOTAL and Association Technique Energie Environnement (ATEE). We thank Audrey Berry, Emmanuel Combet, Stefano Carattini and Thomas Douenne for useful comments on an earlier draft. We thank seminar participants at NMBU in Ås, Paris School of Economics, Paris X Nanterre and Grenoble EM for useful feedback.
* Received 26 March 2020; Received in revised form 14 December 2020; Accepted 22 February 2021; Corrected proofs submitted 5 March 2021.
2
1 Introduction
After two failed attempts in 2000 and 2009 (Deroubaix and Lévêque, 2006; Laurent, 2010), the French government implemented a carbon tax on fossil fuels in 2014. The tax was set to grow from €7/tCO2-eq
in 2014 to €56 in 2020 and €100 in 2030, with its proceeds allocated to the general budget, without further specification of revenue recycling. The tax schedule was revised upwards in 2017 with a new target of €65.40 in 2020. The upcoming ramp-up however sparked what came to be known as the “Gilet jaune” protest movement, to which the government responded by freezing the tax rate at €44.60. Among the 27 carbon tax programmes tallied by the World Bank (2020), France now has that with the broadest coverage and the fifth highest rate. Still, the enduring consequences of the Gilet Jaune crisis make any hike unlikely in the near future. While the carbon tax cannot be held sole responsible for igniting the movement – concomitant factors included a high gasoline price, tighter speed limits principally applying to rural areas, and tax cuts favoring the wealthiest –, this moment serves as a sobering reminder of the equity issues inherent in environmental policy (Nature, 2018).
Carbon pricing is the textbook economic solution to internalizing the global-warming externality. Yet as the less well-off tend to spend a higher share of their income on energy than do the more well-off, they tend to be more negatively affected by carbon prices. Experience is increasingly teaching us that, unless such social distortion is carefully addressed, carbon pricing is unlikely to succeed (Postic et al., 2019). With the pressing need to curb greenhouse gas emissions and new carbon tax programmes considered for implementation (e.g., in Germany), it is important to think of tax designs that reconcile
cost-effectiveness, fairness and political acceptability imperatives.
The concern that carbon taxation can have regressive impacts among households of differing socio-economic characteristics was first raised in the 1990s (see Speck, 1999, for a review). It has since been substantiated in a number of micro-simulation works, including Callan et al. (2009) and Farrell (2017) for Ireland, Rausch et al. (2011) and Fremstad and Paul (2017) for the United States, Liang and Wei (2012) for China, Beck et al. (2015) for the Canadian province of British Columbia, and Berry (2019) and
Douenne (2020) for France. These studies typically examine tax incidence on energy expenditure across and within income groups.1 They consistently find that low-income households suffer most from the implementation of a carbon tax – an effect commonly referred to as vertical inequalities. Impacts are found to be even more heterogeneous within income categories. Commonly referred to as horizontal inequalities, this effect chiefly arises from differences in settlement (urban versus rural) and tenancy status (owner-occupiers versus tenants). A consensual result is that returning tax proceeds as a uniform lump-sum payment corrects vertical inequalities (Boyce, 2018): because rich households tend to spend more on energy in absolute terms, rebating the same amount to all benefits most the poorest. In contrast, no recycling option has yet been found to robustly address horizontal inequalities.
The fact that solutions exist to devise a fair carbon tax is no guarantee for its effective implementation, though. Besides successfully passing cost-effectiveness and equity tests, candidate designs must be
1
Evidence from the United States suggests that the carbon tax burden can appear progressive once expressed as a fraction of consumption, considered to be a good proxy of living standards (Cronin et al., 2019; Pizer and Sexton, 2019).
3 politically acceptable (Klenert et al., 2018). Though lacking proper metrics, this condition has been indirectly assessed in empirical studies eliciting household preferences regarding carbon tax designs, including: surveys based on choice experiments in Norway (Saelen and Kallbekken, 2011), Turkey (Gevrek and Uyduranoglu, 2015), the United States (Kotchen et al., 2017), France (Douenne and Fabre, 2020) and in multiple countries with a comparative approach (Carattini et al., 2019); a laboratory experiment in Austria (Kallbekken et al., 2011); and a survey of voters after ballot in Switzerland (Carattini et al., 2017). Thanks to their varying designs, these studies together produce robust conclusions (see Carattini et al., 2018, for a review). First, carbon taxes are best accepted if carbon revenues are earmarked in a transparent manner. Specifically, respondents favor recycling revenues on the same basis as that on which they are collected – which implies returning part of the money to households. Second, respondents prefer financing greenhouse gas emission reductions to making lump-sum payments to households (perhaps targeted to low-income households). In France, for instance, three mitigation measures – non-polluting transport, renewable energy and thermal renovation of buildings – rank among the four preferred recycling options – the second among these four being VAT cuts (Douenne and Fabre, 2020). Kallbekken et al. (2011) even show that it is the very mitigation-recycling component that enables respondents to perceive the carbon tax as an environmental policy; most otherwise miss the Pigouvian rationale.
This overview of the literature points to a paradox: environmental earmarking has been less
systematically assessed than lump-sum payments, despite the stronger support it receives among the population. Our goal in this paper is to contribute to filling this gap by comparing the merits of the two options in the residential sector. In particular, we are interested in their comparative ability to reduce an important, yet little-studied, source of horizontal inequalities, namely that between owner-occupiers and tenants.
Our assessment builds on Res-IRF, an energy-economy model of energy demand for space heating in the French residential sector. Developed with the goal of improving behavioural realism in energy-economy modelling (Giraudet et al., 2012), Res-IRF has been subjected to extensive robustness checks – including global sensitivity analysis (Branger et al., 2015) and a hindcast experiment (Glotin et al., 2019) – that have established its fitness for purpose. It has been used to show that a carbon tax has a much milder effect on retrofit investment than do energy efficiency subsidies, but also induces significant comfort restrictions (Giraudet et al., 2011). In the present paper, we extend this work by assessing the added value of linking the two instruments. To do so, we use an updated version of the model disaggregated by income levels. This new framework allows us to study policy incidence in depth by looking at a broad range of indicators – including fuel poverty, vertical inequalities and horizontal inequalities (related to housing type, tenancy status and heating fuel) – which we assess through different metrics – heating expenditure and a proxy of heating comfort. Against these benefits, we confine our attention to energy use for space heating, which contributes a third of the broader residential energy use (including
transportation) that is the focus of related papers (e.g., Berry, 2019; Douenne, 2020). In so trading depth for breadth, we stress the important inequalities that arise between owner-occupiers and tenants. The few existing studies we are aware of on environmental earmarking have modelled it either as carbon offsets (Carattini et al., 2017) or subsidies to renewable energy (Carattini et al., 2019). We take a
4 different approach and model a hybrid tax-subsidy system in which carbon tax revenues are recycled as subsidies for home energy retrofits offered to property owners – owner-occupiers, private landlords and social housing providers. This system resembles the white certificate programme in effect in France (Giraudet and Quirion, 2008).2 We compare its cost-effectiveness and distributional impacts to that of a lump-sum payment to all households; we also consider a low-income targeted variant for each recycling option. We thus take an unconventional economic approach: instead of seeking the most cost-effective and fairest carbon tax design and discussing implementation issues in closing, we take acceptability constraints as a starting point and compare the fairness and cost-effectiveness of different policy designs.3 By doing so, we hope to deliver a more practical policy message.
We find the two recycling options to be roughly equally effective in reducing vertical inequalities. Specifically, lump-sum recycling is particularly effective in reducing inequalities in income expenditure while energy efficiency subsidy is particularly effective in reducing inequalities in heating comfort. Lump-sum recycling is however more effective in reducing horizontal inequalities between owner-occupiers and tenants than is subsidy recycling. In turn, by combining two incentives, subsidy recycling saves energy in a much more cost-effective manner than does lump-sum recycling. Our study sheds light on an important methodological issue: whether lump-sum payments are subtracted from energy expenditure or added to income has very contrasted implications for assessing the benefits associated with this policy option.
Overall, both options are found to have merits within the scope of our modelling framework. From a broader perspective, however, we think that subsidy recycling has a political edge. As discussed above, it receives stronger support from the public. Furthermore, building on Giraudet and Quirion (2008), it gives policy-makers the ability to reach the same environmental goal with a lower tax rate. This can be
instrumental in addressing the carbon neutrality imperative without raising too much opposition. In practice, we think that linking the actual carbon tax programme with the numerous pre-existing energy efficiency subsidy programmes is unlikely to raise significant administrative costs. A cautionary note is in order, though. Subsidy recycling will not succeed if attention remains focused on property owners, thus leaving some tenants into poverty traps. Accordingly, we see new subsidy regimes tying subsidy rates to the tenant’s, rather than the landlord’s, income as an important area for further research.
The remaining of this paper is organized as follows. Section 2 provides an overview of Res-IRF 3.0, emphasizing its latest developments; an extensive description is provided in the online appendix. Section 3 specifies the carbon tax and associated revenue recycling options. Section 4 defines evaluation criteria,
2
The hybrid instrument studied here combines a tax on pollution with a subsidy on pollution abatement capital. It is thus different from a more studied type of hybrid instrument combining a tax on polluting inputs with a subsidy on clean inputs. Sometimes referred to as feebates, such instruments have for instance been studied in the context of industrial production (Galinato and Yoder, 2010) and vehicle purchase (Durrmeyer and Samano, 2017).
3
There are two possible approaches to the tax rate. The efficiency approach takes a global perspective and seeks the Pigovian price that internalizes the marginal damage of carbon dioxide emissions. This approach is fraught with deep uncertainty, such that available global estimates range from $10 to $1,000 per tCO2-eq (Ricke et al., 2018).
The cost-effectiveness approach seeks to minimize the cost of attaining a given emission reduction target. This is the approach taken in France and therefore the one we focus on. The value needed to achieve net zero emissions by 2050 has been estimated to be €250/tCO2-eq in 2030 (Quinet et al., 2019).
5 with an emphasis on fuel poverty, which is central to French policy and relies on several indicators. Section 5 presents our simulation results. Section 6 discusses their generalizability to other contexts and issues with implementation. Section 7 concludes.
2 Modelling framework
Res-IRF is a model of residential demand for space heating in France. Developed with the goal of
improving behavioural realism in integrated models of energy demand (Mundaca et al., 2010; McCollum et al., 2017), it incorporates a number of barriers at the source of the so-called ‘energy-efficiency gap’ – the discrepancy between actual energy efficiency levels and those predicted by engineering studies (Jaffe and Stavins, 1994; Sorrell, 2004; Gillingham et al., 2009). These include a landlord’s inability to pass through the full cost of renovation onto rents, barriers to collective decision-making within homeowner associations, credit constraints and hidden attributes of renovations (e.g., inconvenience caused by insulation works).
2.1 Housing stock
The housing stock is parameterized with data from the Phébus survey, which uniquely interacts the socio-economic characteristics of French households with the physical characteristics of their dwelling.4
2.1.1 Segmentation
The dwelling stock is segmented into 1,080 categories that are the product of:
Nine categories of energy performance, corresponding to: labels A to G of the French energy performance certificate (EPC) in dwellings built before 2012; labels ‘low energy’ and ‘net zero energy’ in dwellings built after 2012. These categories summarize the technical characteristics of the envelope and the heating system of the dwelling.5
Four fuels used as the primary energy source for space heating: electricity, natural gas, fuel oil and fuel wood, altogether covering 91% of energy demand for space heating.
Two categories of housing: single- and multi-family units, respectively weighing 61% and 39%.
Three categories of property owners: owner-occupiers, private landlords and social-housing providers, respectively weighing 61%, 24% and 15% of dwellings.
Five levels of income for both owners and occupants, closely aligned with the income quintiles of the French population given by INSEE, the national statistical office (Table 1).
Figure 1 decomposes the links between energy performance, tenancy status and household income across dwellings. Figure 1 (top) displays how the distribution of EPC labels across dwellings varies with their ownership. The distribution is skewed towards low-efficiency labels in rental housing and rather
4
Performance de l’Habitat, Équipements, Besoins et USages de l’énergie, available at http://www.statistiques.developpement-durable.gouv.fr/sources-methodes/enquete-nomenclature/1541/0/enquete-performance-lhabitat-equipements-besoins-usages.html
5
Based on the Phébus survey, we consider the following primary energy consumption for each EPC label (in kWh/m²/yr): G=507; F=321; E=216; D=141; C=90; B=59; A=45; Low-energy=20; net-zero=16. See online appendix for further information.
6 even in owner-occupied and social housing. Figure 1 (middle) displays the interaction between tenancy status and household income. Figure 1 (middle) shows that income is lower among tenants than among private owners; among the latter, landlords tend to be richer than owner-occupiers.
Table 1: Income categories
Category Income range, based on INSEE quintile boundaries
Share of total households in Res-IRF
C1 €0 – €16,830 17%
C2 €16,831 – €24,470 19%
C3 €24,471 – €34,210 23%
C4 €34,211 – €48,680 22%
C5 > €48,681 19%
Lastly, Figure 1 (bottom) indicates a clear correlation between occupants’ income and the energy efficiency performance of their dwelling.6
Figure 1: Joint distributions of income categories, energy efficiency (G to A) and tenancy status across dwellings
6 Income distribution for EPC labels B and A is based on a limited number of observations in Phébus, hence the
7
2.1.2 Growth
The model focuses on the stock of principal residences in metropolitan France, which contains 23.9 million dwellings. The housing stock grows annually so as to meet a housing demand determined by exogenous projections of population and household income. Part of the resulting demand is met by the initial stock of dwellings, net of the cumulative sum of annual demolitions. The remaining housing needs are met by new constructions. The distribution of tenancy statuses and single- vs. multi-family dwellings is held constant in new constructions.
2.2 Household behaviour
The annual energy consumption of a dwelling results from a multi-stage decision involving different actors. In a first stage, property owners – owner-occupiers, private landlords and social housing providers – make renovation decisions along two margins – intensive and extensive. In a second stage, occupants – owner-occupiers and tenants in both privately rented and social housing – adjust the intensity with which they heat their dwelling.
2.2.1 Renovation decision, intensive margin
The decision made on the intensive margin is about the magnitude of energy efficiency improvements. Owners of a dwelling labelled 𝑖 before retrofit select a post-retrofit label 𝑓 among labels {𝑖 + 1, … , 𝐴}. The market share of each post-retrofit label results from a discrete choice based on the life-cycle cost of each option, including investment costs (detailed in Appendix A), lifetime discounted operating costs and calibrated intangible costs. We specify these variables so as to mimic key barriers to renovation: under-capitalization of energy savings in rental housing is captured by a short investment horizon of three years – the typical duration of a lease contract – as opposed to 30 years in owner-occupied dwellings and social housing; frictions inherent in decision-making within homeowner associations are captured by higher discount rates in multi-family units than in single-family units (cf. Table 2); heterogeneous credit constraints are captured by a negative relationship between discount rates and income, following a pattern first elicited by Hausman (1979); hidden attributes of renovations (e.g., the inconvenience caused by insulation works) are captured by a matrix of calibration residuals that forms intangible costs. In the absence of datasets linking investment patterns with decision-makers’ income, the discount rates displayed in Table 2 are parameterized in an ad hoc manner. Sensitivity analysis nevertheless suggests that their influence on key model outputs is modest (see online appendix, section 3.3.3).
2.2.2 Renovation decision, extensive margin
The decision made on the extensive margin is about whether or not to upgrade a dwelling. It depends on the net present value of an average renovation project, measured as the difference in life-cycle costs between the status quo and the average of upgrading options weighted by their market share. The correspondence between the net present value and the number of renovations follows a logistic relationship capturing heterogeneity in heating preference and habits. It is calibrated, for each segment of the building stock, against the renovation rates listed in Table 3. The heterogeneity we find in the data pertaining to renovation flows across households of differing status mirrors the one pertaining to the energy performance across the dwelling stock (cf. Figure 1, top), which in turn results from past renovation flows. A plausible explanation for both facts is the landlord-tenant dilemma, according to which landlords, unable to increase rents to recoup upfront costs, are reluctant to invest in retrofits (for
8 a review, see Giraudet, 2020, section 4.1.2). This process is embodied in the model through the
investment horizons assumed above. It contributes to amplifying differences across tenancy statuses in model projections of the dwelling stock and renovation flows.
Table 2: Discount rates, by income category
Income category Single-family housing Multi-family housing Social housing
C1 15% 37% 4% C2 10% 25% 4% C3 7% 15% 4% C4 5% 7% 4% C5 4% 5% 4% Weighted average 8% 17% 4%
Table 3: Renovation rates by housing type and occupancy status. Source: Ademe (2016) and USH (2017).
Type of decision-maker Type of dwelling Renovation rate
Owner-occupier Single-family 4.7%
Multi-family 3.6%
Private landlord Single-family 2.0%
Multi-family 1.8%
Social housing provider Single-family 1.5%
Multi-family 2.0%
2.2.3 Heating intensity
The model produces two measures of energy consumption for each bundle of dwelling and occupant: the one predicted by the EPC label of the dwelling, which relies on engineering predictions; and the one that is actually reported on the occupant’s energy bill. The two metrics are connected in the model through an endogenous variable determined as follows:
𝐻𝑒𝑎𝑡𝑖𝑛𝑔 𝐼𝑛𝑡𝑒𝑛𝑠𝑖𝑡𝑦 = −0,191 ∗ log(𝐼𝑛𝑐𝑜𝑚𝑒 𝑆ℎ𝑎𝑟𝑒 ) + 0,1105 (1)
where 𝐻𝑒𝑎𝑡𝑖𝑛𝑔 𝐼𝑛𝑡𝑒𝑛𝑠𝑖𝑡𝑦 is the ratio between predicted and actual energy use and 𝐼𝑛𝑐𝑜𝑚𝑒 𝑆ℎ𝑎𝑟𝑒 is the share of household income dedicated to heating expenditure. On the left-hand side,
𝐻𝑒𝑎𝑡𝑖𝑛𝑔 𝐼𝑛𝑡𝑒𝑛𝑠𝑖𝑡𝑦 can be seen as a proxy of the comfort occupants derive from using their heating system.7 It is practically influenced by the three variables that determine 𝐼𝑛𝑐𝑜𝑚𝑒 𝑆ℎ𝑎𝑟𝑒 on the right-hand side: positively associated with the price of energy, positively associated with the energy
inefficiency of the dwelling (as measured by its EPC label) and negatively associated with the income of the occupying household. In this context, we interpret increases in the heating intensity in response to
7
Besides the rebound effect, the gap between predicted and actual energy consumption stems from a broader variety of factors, including the so-called pre-bound effect, according to which engineering models typically over-estimate pre-retrofit energy consumption (Sunikka-Blank and Galvin, 2012), and quality defects due to information asymmetries between homeowners and retrofit contractors (Giraudet et al., 2018).
9 energy efficiency improvements as a direct rebound effect (Sorrell et al., 2009). Equation 1 is
parameterized with coefficients estimated by Cayla and Osso (2013).8
2.3 Overall influence of energy prices
Energy prices have been found to be the model’s most influential input in prior sensitivity analysis (Branger et al., 2015). This trait is important to consider when assessing carbon tax impacts. In the model, energy prices influence both renovation decisions – by changing the discounted sum of operating costs, hence the relative life-cycle cost of renovation options, and ultimately the number of renovations and their intensity – and heating behaviour – by changing the share of income dedicated to heating in Equation 1. The resulting price elasticity of energy demand – -0.24 in the short term and -0.35 in the long term in Res-IRF 3.0 (see online appendix, Section 3.1) – is in line with estimates found in the literature (Gillingham et al., 2009; Labandeira et al., 2017).
3 Policy scenarios
We consider six scenarios: one without a tax; one where tax proceeds are not recycled; two recycling options; and two variants where each recycling option is targeted to low-income households.
3.1 Exogenous inputs
The model is fed with three exogenous inputs: population, total income, and energy prices. In the analysis presented here, population grows at 0.3% p.a. and household income grows uniformly at 1.2% p.a.. Energy prices grow (in real terms) according to a scenario borrowed from French authorities at 1.4% p.a. for natural gas, 2.2% for fuel oil, 1.1% for electricity and 1.2% for fuel wood. 9 This is equivalent to an energy price index growing at 1.5% p.a. in the reference scenario.
3.2 Carbon tax
We consider the carbon tax that was implemented in 2014 with the rate schedule detailed in Table 4. The rate schedule was revised upwards in 2017 and then frozen at its 2018 level in the wake of the Gilet Jaune crisis. We ignore these political hazards and stick to the 2014 schedule in an attempt to assess the benefits the instrument was initially meant to produce in the medium to long term. Within the scope of Res-IRF, the tax only applies to fuel oil and natural gas, with respective carbon contents of 271 and 206 gCO2/kWh. We assume that the latter value decreases from 2020 onwards at 1% p.a. to take into
account the target set by the government of incorporating 10% biomass into natural gas supply by 2030. Lastly, we subject the carbon tax to the 20% value-added tax. Altogether, we find that the tax proceeds originating from residential heating amount to €1.3 billion in 2017 – a fifth of the €6.4 billion total carbon tax proceeds effectively collected that year (Rogissart et al., 2018).
8
Similar relationships have been estimated in the Netherlands (Aydin et al., 2017) and Switzerland (Cozza et al., 2020).
9 Source: https://ec.europa.eu/energy/sites/ener/files/documents/france_draftnecp.pdf. Sensitivity analysis is
10
Table 4: Time profile of the carbon tax (per ton of CO2, in real terms)
2014 2015 2016 2017 2018 2019 2020 2020-30 2030-50
€7.0 €14.5 €22.0 €30.5 €39.0 €47.5 €56.0 +6% p.a., 100€ in 2030 +4% p.a.
In the model, households are assumed to form myopic expectations and make long-term investment decisions based on the contemporaneous price of energy, following well-documented stylized facts (e.g., Anderson et al., 2013). In the exercise conducted here, we extend this specification to the tax and assume that households make investment decisions based on the contemporaneous tax rate rather than the full schedule reported in Table 4. Such a specification is at odds with the government’s goal of sending a long-term price signal intended to change investment patterns. We nevertheless see it as a reasonable assumption here, for two reasons. First, while recognizing that myopic expectations lead us to underestimate the impact of the tax on renovation decisions, we note that evidence is lacking to support any alternative, more forward-looking assumption.10 In this context, we prefer a conservative yet clear benchmark to a middle-of-the-road yet equally speculative one. Second, our assumption does not affect actual energy expenditure after investment, which is the main metric of interest when comparing recycling options.
3.3 Lump-sum recycling of tax proceeds
The first recycling option consists of a lump-sum payment made to the occupants of the dwelling. We calculate individual allowances each year by dividing the total revenue generated by the model on the previous year by the number of households. Depending on the output studied (see Sections 4.1 and 4.2), we then either add payments to income (without changing the income category the household belongs to), or subtract payments from heating expenditure. These allocation options have no impact on renovation decisions and only increase heating intensity – an effect which is stronger with the latter option. Lump-sum payments are capped so as not to exceed heating expenditure.
3.4 Subsidy recycling of tax proceeds
The second recycling option consists of subsidies proportional to energy efficiency improvements. This performance-based specification is motivated by both positive and normative arguments. Though less common than ad valorem subsidies – e.g., tax credits (Nauleau, 2014) – performance-based subsidies are also prevalent in France. In particular, they are the main approach taken by energy suppliers to comply with energy saving obligations, also known as white certificates (Giraudet and Quirion, 2008). Theoretical works moreover suggest that, in industries like energy efficiency characterized by a low degree of
competition, performance-based subsidies cause less distortion than do ad valorem ones (Nauleau et al., 2015).11 In addition, we assume by default that subsidy recipients are property owners –
owner-occupiers, private landlords and social housing managers. Specifically, subsidies are proportional to the
10
In a related paper, Giraudet et al. (2021a) consider two polar cases, namely myopic and perfect expectation of the tax rate. They find significantly higher uptake of energy efficiency investment in the former case. They however argue that none accurately reflects actual behaviours and that reality is likely to be somewhere in between.
11
Additional simulations not reproduced here suggest that an ad valorem regime generates very similar outcomes. This conclusion however rests on the exogenous representation of energy efficiency supply that prevails in our model and the ensuing impossibility of generating distortion from imperfect competition.
11 lifetime discounted kilowatt-hours savings predicted for a given upgrade, assuming a lifetime of 15 years and a 4% discount rate (hence a discount factor of 11.5) as is the case with white certificates.
We model subsidies as a reduction in renovation costs. This affects both the number of participants in the programme and the amount they invest, to a varying degree depending on their ownership status. We seek each year the subsidy rate (in Euros per kilowatt-hour saved) that matches subsidy spending and the previous year’s carbon tax revenues in the government’s budget. In addition to changing
investment patterns, subsidies change consumption patterns by changing the share of income dedicated to heating after retrofit, and hence the heating intensity determined by Equation 1.
3.5 Targeting
In an alternative specification, we consider that the government restricts payments to low-income beneficiaries, defined as the bottom two categories of the income distribution. Specifically, we restrict lump-sum payments to low-income occupants and subsidy payments to low-income homeowners (owner-occupiers and private landlords) in private housing and to those dwellings that are occupied by low-income households in social housing. The targeted lump-sum payment resembles the chèque
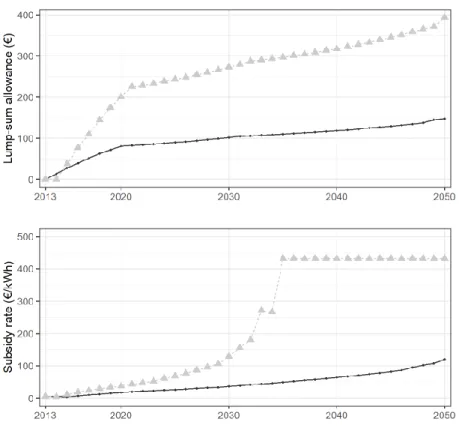
énergie, a voucher programme providing poor households support to pay their energy bill.12 The targeted subsidies resemble the white certificate programme, which includes a bonus for targeting low-income households. Compared to the default option, this targeted specification implies higher individual payments, as carbon tax revenues are to be redistributed on smaller bases (Figure 2). Lump-sum
allowances grow from €35 per household in 2015 to €80 in 2020 and €150 in 2050; they grow roughly twice as fast when targeted, up to €400 in 2050. Subsidies similarly grow with the carbon tax from €0 to €20 per lifetime discounted kWh savings between 2015 and 2020 and roughly twice as fast when targeted. In the targeted variant, they then sharply rise up to the point of being so generous as to be claimed by all eligible participants in 2035. The endogenous subsidy rate ceases to increase and tax proceeds start exceeding subsidy spending thereafter.
12 The chèque énergie superseded in 2018 a similar programme called tarifs sociaux implemented in 2005 for
electricity and in 2008 for natural gas. As of 2020, the programme grants energy vouchers of €48 to €227 to households whose taxable annual income falls below €10,700 per consumption unit. In 2019, it benefited 5.8 million households. Sources: https://www.onpe.org/sites/default/files/17-tarifs-sociaux-energie.pdf; https://www.service-public.fr/particuliers/vosdroits/F33667; https://chequeenergie.gouv.fr/.
12
Figure 2: Endogenous parameters of recycling options
4 Policy evaluation criteria
4.1 Fuel poverty
The rich description Res-IRF offers of household behaviour is fit for exploring different dimensions of fuel poverty, a much-discussed, yet hard-to-define, notion. The French Observatoire national de la précarité
énergétique (ONPE, 2016) proposes three indicators for identifying fuel-poor households: the
energy-to-income ratio; the low-energy-to-income, high cost, index; and stated heating comfort. While the first two are commonly used in other countries (Charlier and Legendre, 2019), the third is to our knowledge unique to France. We detail below how each is approximated in Res-IRF.
4.1.1 Energy-to-income ratio (EIR)
The most common indicator of fuel poverty, the EIR counts those households that allocate more than 10% of their income to energy expenditure. An alternative definition of the indicator restricts the count to the first three deciles of the income distribution. The restriction is meant to exclude wealthy
households that, for reasons unrelated to poverty, spend much on energy. Following the approach taken by the ONPE, we apply the 10% ratio to heating expenditure, which typically contribute a third of the total energy bill (including transportation) of a French household. While this indicator specification may
13 understate the broader prevalence of fuel poverty, it does not affect the qualitative effect of recycling options.
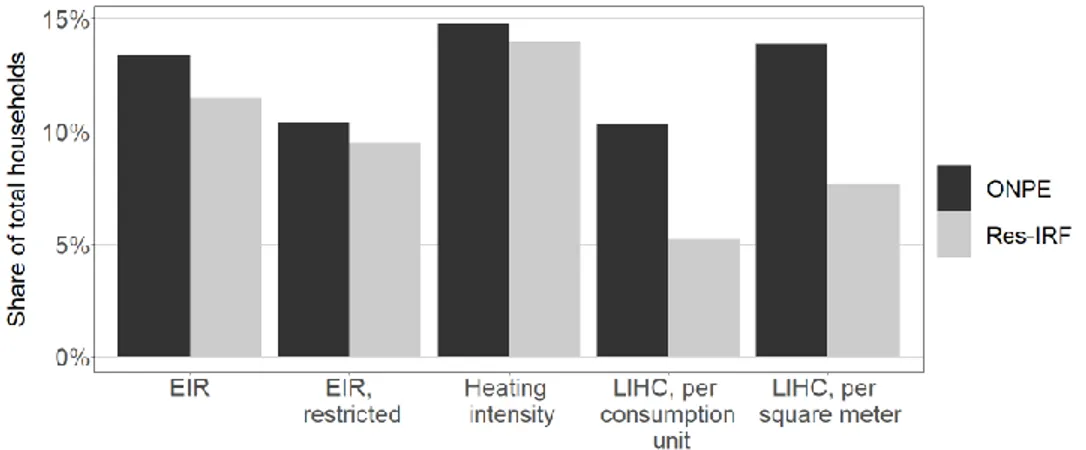
We approximate the EIR on a conventional, rather than actual, energy consumption basis in order not to miss fuel-poor households that forgo comfort to reduce their energy bill. We also have to adjust the restricted variant to the quintile-based structure of our model and thus compute it for the first two quintiles of the income distribution. Figure 3 shows that, in both cases, we approximate fairly well the counts given by the ONPE when applying the 10% ratio to heating expenditure.
4.1.2 Low-income, high cost index (LIHC)
The LIHC has been more recently proposed by Hills (2012) to overcome a commonly mentioned
limitation of the EIR that it may include some wealthy households in times of high energy prices and miss truly fuel-poor ones in times of low energy prices. The LIHC is now the official indicator used in the United Kingdom (Robinson et al., 2018). It typically collects those households whose (i) income, net of energy expenditure, falls below 60% of the median net income and (ii) heating expenditure exceeds the median. The indicator can be specified per consumption unit or per surface area. We approximate it in our quintile structure by considering the second quintile of the income and expenditure distributions instead of the median. As illustrated in Figure 3, this adjustment leads us to significantly underestimate the count given by ONPE, regardless of how the indicator is specified.
4.1.3 Heating intensity (HI)
The ONPE uses stated thermal comfort as an additional measure of fuel poverty. The indicator is elicited in surveys by counting those respondents who declare at least one of the following: a poor heating system; poor insulation; voluntary restrictions on usage; denied access to the energy distribution network. We approximate this indicator with the heating intensity variable defined in Equation 1. We then calibrate an HI threshold such that the number of households that fall below it matches the ONPE’s count adjusted to our slightly smaller scope (Figure 3).
14
4.1.4 Interim assessment of fuel poverty indicators
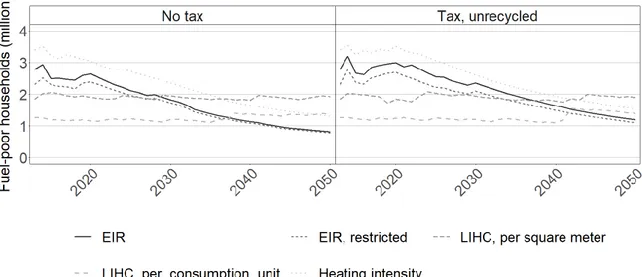
In a preliminary step, we compare the evolution of the different indicators over time with and without a carbon tax, ignoring for now revenue recycling. The results are displayed in Figure 4. Absent the tax, the count of fuel-poor households identified with either the EIR or HI indicators consistently shrinks. This trend is driven by both energy price-induced and autonomous energy efficiency improvements. Introducing the tax shifts the EIR and HI trends upward, indicating that, at least without revenue-recycling, the carbon tax increases the prevalence of fuel poverty.
In contrast to the EIR and HI indicators, the count of fuel-poor households identified with LIHC indicators remains stable, both with and without the tax. These contrasted trends illustrate an important difference between the two sets of indicators. On the one hand, the EIR and HI indicators are determined by fixed, absolute thresholds. The simulated decrease in associated counts is driven by energy efficiency
improvements that reduce heating expenditure over time.13 On the other hand, the LIHC is based on distribution thresholds that are moving when expressed in equivalent EIR or comfort terms. Unless certain categories of households are disproportionately impacted by energy efficiency improvements or the carbon tax, the associated count is therefore less likely to vary over time. In other words, while the EIR and HI indicators provide an absolute measure of fuel poverty, the LIHC rather provides a measure of inequalities across households.
The fact the LIHC indicator is little sensitive to the scenario variants considered here, added to the fact that our model does not allow us to accurately approximate it, leads us to disregard this indicator in subsequent analysis. Furthermore, we confine our attention to the restricted variant of the EIR indicator. In closing this preliminary assessment of fuel poverty indicators, note that, due to data limitation, we use income as the sole measure of wealth. We thereby ignore other relevant sources of wealth, such as the higher property value homeowners generally derive from energy retrofits (for a review, see Giraudet, 2020, section 4.1.1). If anything, our approach thus overestimates the number of fuel-poor households. The bias is however likely to be small. Indeed, only 10% of the population of homeowners belongs to the low-income categories that are considered in the EIR indicator (cf. Figure 1). The households likely to enjoy extra-benefits are therefore unlikely to be fuel-poor.
13
These improvements are strong enough to outpace a 0.6% structural increase in the EIR count implied by a basic decomposition of the growth rates of energy prices, income and population embodied in the reference scenario: 1.5%-1.2%+0.3%=0.6%.
15
Figure 4: Trends in fuel poverty, by indicator
4.2 Inequalities
The social aspects of household energy consumption are not fully captured by fuel poverty indicators. As energy efficiency improvements tend to be undertaken by wealthy households (cf. Table 3), inequalities in housing performance may typically widen even though fuel poverty recedes at the same time. To investigate trends in inequalities, we compare heating expenditure (net of lump-sum payments) and heating intensity across two household categories: the highest- vs. lowest-income category of occupants to assess vertical inequalities; owner-occupiers vs. tenants to assess horizontal inequalities.
4.3 Economic and environmental performance
From an economic perspective, consumer benefits are ideally assessed through variations in utility, which in our context is heating comfort. We therefore approximate utility through heating intensity. Equation 1 can indeed be seen as an indirect utility function resulting from standard utility maximization under budget constraint. We also assess economic benefits through heating expenditure, as expenditure is generally thought to accurately approximate living standards (Pizer and Sexton, 2019).
From a regulatory perspective, governments are concerned with maximizing policy outcomes per unit of public spending. To assess this, we compute leverage and cost-effectiveness indicators. Leverage
measures extra-investment induced per euro returned to households in either lump-sum payment or subsidy. Similarly, cost-effectiveness measures actual lifetime discounted energy savings induced per euro recycled, assuming a lifetime of 26 years and a discount rate of 4% (hence a discount factor of 16.6). We compute both extra-investment and energy savings by comparing outcomes in the policy scenario considered to those achieved in a counterfactual scenario without it. The leverage indicator
16 generates insights into the fluidity of monetary flows within the economic system. The cost-effectiveness indicator provides a standardized measure of environmental performance.14
An important caveat here is that we consider a partial equilibrium framework and ignore the opportunity cost of public funds. We therefore likely overestimate the amounts returned to households and thus the benefits of the carbon tax. Since, however, we consider a closed recycling system in which tax proceeds are returned within the very scope they are levied on, we expect general equilibrium effects to be minimal and hence the bias to be small.
5 Policy impacts
5.1 Incidence
5.1.1 Fuel poverty
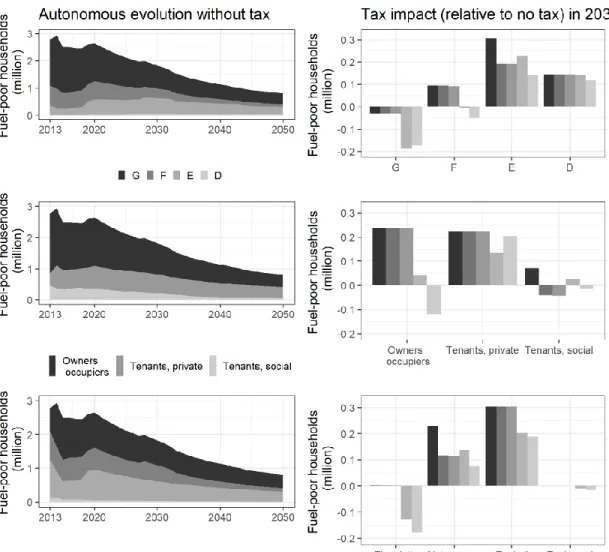
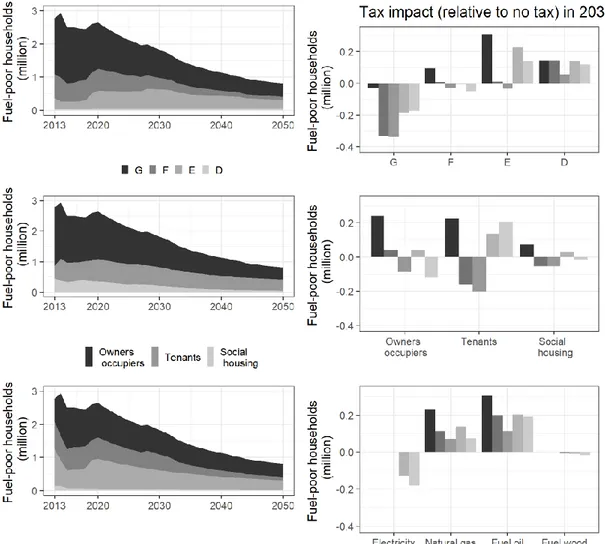
To fully understand how tax options affect fuel poverty, it is important to examine how it is initially distributed across dwelling types, tenancy status and fuel types and how this distribution evolves in the absence of the carbon tax. Figure 5 shows that, at the beginning of the period, fuel poverty is mostly prevalent in dwellings labelled G, F and E (top left panel), among homeowners (middle left) and in dwellings heated with fossil fuels (bottom left). The autonomous energy efficiency improvements that are the main driving force in this scenario significantly alleviate fuel poverty. This trend, however, is not uniform and primarily benefits owner-occupiers and G (and, to a lesser extent, F) labels. In addition, an autonomous substitution of electricity for fossil fuels implies that the share of electricity as the principal heating source increases over time among fuel-poor households. Two important policy lessons follow: on the one hand, rental housing is a ’poverty trap;’ on the other, fuel poverty ceases to be an issue when dwellings are upgraded to labels D or more efficient.
14
As a demand-side model, Res-IRF does not produce endogenous values of the local pollutant and carbon dioxide content of kilowatt-hours. The interested reader can apply standardized contents to our kilowatt-hour outputs to assess broader environmental impacts of the policies considered.
17
Figure 5: Decomposition of fuel poverty, without tax over the period (left) and with tax in 2030 (right)
The right panels of Figure 5 show how these distributions evolve under different tax scenarios. To ease comparison across policies, we focus on a single year – 2030, a medium-term horizon which we think is most relevant for assessing tax incidence. The full-period simulations, not reproduced here, nevertheless indicate that results are qualitatively stable over time. The figure shows that the unrecycled tax increases the count of fuel-poor households, except in label G. Indeed, by 2030, the tax has stimulated renovations away from label G and, to a lesser extent, F; meanwhile, the main effect of the tax in higher-efficiency
18 labels is to increase energy expenditure. In general, lump-sum recycling does no better than the
unrecycled tax, except in dwellings labelled E and in dwellings heated with natural gas. In contrast, subsidy-recycling systematically attenuates the detrimental effect of the tax on fuel poverty. In
particular, it strongly reduces fuel poverty in G and F, owner-occupied, electricity-heated and oil-heated dwellings. These effects are driven by the additional retrofits that the subsidies induce. Targeting subsidies strengthens this impact, except for tenants. The same qualitative outcomes are obtained with the HI indicator, as exposed in Appendix B.
19 The small overall impact of lump-sum recycling is partly determined by our assumption that lump-sum payments increase income but do not change heating expenditure in the EIR formula. In Figure 6, we make the alternative assumption that lump-sum payments are subtracted from heating expenditure. This results in a much stronger effect of lump-sum payments. We nevertheless think that such a specification imposes too much structure on household spending and tend to prefer the income alternative.
5.1.2 Inequalities
As stated earlier, fuel poverty is an absolute measure of social outcomes. It is however silent about inequalities in access to heating services. To better assess vertical and horizontal inequalities, we compare energy expenditure and heating intensity across household categories.
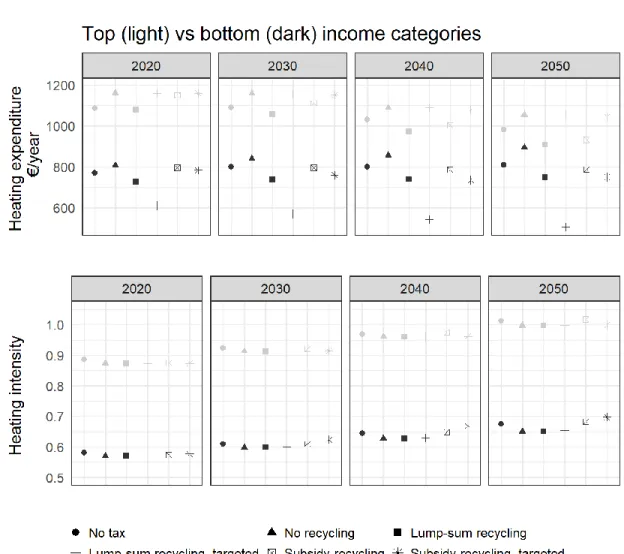
Figure 7: Vertical inequalities
We assess vertical inequalities by comparing outcomes between the bottom and top categories of the income distribution (C1 vs. C5 in Table 1), at different times. Absent the tax, heating expenditure (net of lump-sum payments) slightly increases among low-income households and more markedly decreases among high-income ones (Figure 7). The resulting convergence can be interpreted as an increase in inequalities. The phenomenon is accelerated with the carbon tax, though less so when the tax is
20 recycled, especially when recycling is targeted. Heating intensity, on the other hand (lower panel), increases more rapidly among high-income occupants than among low-income ones. This is another side of the same coin – growing inequalities, in that low-income households enjoy relatively less heating comfort while incurring a disproportionate increase in expenditure. Lump-sum payments more effectively reduce low-income households’ energy expenditure (especially when targeted) than do energy efficiency subsidies; yet the latter more effectively increase heating intensity (especially when targeted) than do the former.
Figure 8: Horizontal inequalities
We assess horizontal inequalities by comparing outcomes between owner-occupiers and tenants. We observe the same patterns as between income categories – namely a convergence of heating
expenditure and a divergence of heating intensity – only more pronounced, to the point that
expenditure paths cross around 2040 (Figure 8). An important finding is that targeting subsidies offsets their ability to reduce horizontal inequalities, unlike they do with vertical inequalities. This is due to the
21 fact that, by design, subsidies are granted to homeowners; since low-income homeowners are strongly under-represented among landlords (cf. Figure 1, middle panel), very few tenants benefit from subsidy-induced investment by their landlord. In Appendix C, we find qualitatively similar policy impacts were the landlord-tenant overcome.
5.2 Economic and environmental performance
5.2.1 Effectiveness
In the absence of the tax, autonomous energy efficiency improvements reduce energy use by 10% by 2020 and 35% by 2050, as compared to its 2012 value (Figure 9, top). The carbon tax adds 2 percentage points to these savings by 2020 and 7 percentage points by 2050. The effect of lump-sum recycling, whether targeted or not, is indistinguishable from that of the unrecycled tax. In contrast,
subsidy-recycling multiplies the additional effect of the tax by 1.5 when targeted and by 2 otherwise. In that most aggressive scenario, energy savings amount to 30% in 2030 and 50% in 2050.
The tax also incentivizes home retrofits, which results in a significant increase in renovation expenditure (Figure 9, bottom). Unlike lump-sum recycling options, subsidy-recycling options provide an additional incentive for renovation, which results in still higher expenditure. With targeted subsidies, renovation expenditure sharply declines from 2035 onwards as the number of dwellings to renovate whose owner is eligible for subsidies is depleting.
22
Figure 9: Environmental effectiveness 5.2.2 Cost-effectiveness and leverage
We now balance these achievements with total payments to households, either lump-sum or through subsidies. We practically match in Figure 10 the achievements displayed in Figure 9 with the payments displayed in Figure 2. The public cost considered for the unrecycled tax is tax proceeds.
23
Figure 10: Cost-effectiveness and leverage
Recall that leverage and cost-effectiveness respectively measure the extra investment and energy savings – both additional to the no-policy scenario – that are induced by one euro returned to households (cf. section 4.3). The two are connected by the cost structure embedded in the model (cf. matrices in Appendix A). As such, they provide two faces of the same coin: a high leverage and a low cost per kWh saved both indicate a high economic performance. In that regard, a clear insight from Figure 10 is that the carbon tax is two to three times as cost-effective when tax proceeds are returned as subsidies than as lump-sum payments. This is due to the extra-investment generated by subsidies. Targeting subsidy-recycling further increases leverage in the short term, but decreases it in the longer term. The short-term effect can be explained by the correlation embedded in the model between household income and housing performance (cf. Figure 1), by virtue of which targeting low-income households implies targeting the least efficient dwellings (labels G an F in particular) that are also the most cost-effective to upgrade (cf. Appendix A). In the longer term, this effect vanishes as the number of candidates for targeted subsidies shrinks. In contrast, the cost-effectiveness and leverage of the unrecycled tax are unaffected by lump-sum recycling, whether targeted or not.
24
6 Discussion
Our simulations generate three main insights. First, returning revenue to households can greatly
mitigate, and even offset, the increase in fuel poverty and inequalities induced by the carbon tax. In that regard, lump-sum recycling is particularly effective in reducing inequalities in energy expenditure while subsidy-recycling is particularly effective in reducing inequalities in heating intensity, a proxy of comfort. Second, horizontal inequalities between owner-occupiers and tenants are better addressed by lump-sum recycling. Third, subsidy-recycling reduces energy use much more cost-effectively than does lump-sum recycling. Let us now discuss the internal and external validity of these insights and their policy
implications. Table 5 summarizes the findings and the discussion.
Table 5: Summary of the findings
Lump-sum recycling Energy efficiency subsidies
Origin of the claim Effect on vertical
inequalities
Particularly effective in reducing the poors’ heating expenditure
Particularly effective in increasing the poors’ heating comfort Fig.5 and 7 Effect on horizontal inequalities Particularly effective in reducing tenants’ heating expenditure Little effective in reducing tenant’s expenditure and
comfort, especially when targeted to low-income owners
Fig. 5, 6 and 8
Cost-effectiveness and leverage
Low High Fig. 10
Modelling caveats Subtracting lump-sum payments from energy expenditure
overestimates benefits. In contrast, adding them to income
underestimates them
Not considering the increased property value of more energy efficient homes underestimates benefits
Comparison of fig. 5 and 6; Section 6.1
Support from households Decent Strong Empirical studies reviewed in the Introduction Section Administrative costs Low if coupled with the
pre-existing chèque
énergie programme
Low if coupled with pre-existing energy efficiency subsidy programmes
Section 6.3
Political benefits Permits reaching the
same environmental goal with a lower tax rate
Giraudet and Quirion (2008)
6.1 Internal robustness
The fact that we obtain more clear-cut results when comparing the cost-effectiveness of recycling options than their distributional impacts illustrates the many dimensions of tax incidence and the
25 methodological challenges in assessing them. The main difficulty is that no indicator is fit for capturing the full impact of each recycling option. This is particularly the case with the EIR indicator. In it, lump-sum payments can either be added to income at the denominator (cf. fig. 5) or subtracted from heating expenditure at the numerator (cf. fig. 6). The two approaches reflect different spending behaviours and produce dramatically different values of the indicator. In particular, the effect of lump-sum recycling appears stronger when payments are subtracted from energy expenditure, which we consider a strong assumption. In contrast, subsidy payments are not directly factored in the indicator, although empirical evidence suggests that the extra renovations they induce produce extra value that should be taken into account – yet here again, it is not clear whether that should change the numerator or denominator. Notwithstanding, we think that including heating intensity in the portfolio of fuel poverty and inequality indicators improves our understanding of distributional impacts.
6.2 Relevance to other contexts
Our integrated energy-economy assessment qualitatively reproduces results established in more stylized micro-economic models. In particular, our finding that the carbon tax saves more energy when its proceeds are rebated as energy efficiency subsidies echoes Giraudet and Quirion (2008)’s insight that a hybrid instrument combining a tax on pollution and a subsidy for pollution abatement allows the regulator to meet the same environmental target with a lower tax rate. From a broader economic perspective, such a policy approach creates opportunities for reducing tax-induced general equilibrium effects.
In more practical terms, an important question is the extent to which our results carry over to other jurisdictions. Our analysis primarily relies on specific patterns regarding the joint distribution of renovation costs and household income. Specifically, we observe a trend of private landlords being wealthier than owner-occupiers, who in turn are wealthier than tenants, and a trend of higher-income households being over-represented in more energy-efficient households. We suspect that similar patterns prevail in most developed countries and hence that our insights are quite general. Another concern naturally arises as to the relevance of our analysis to other sectors, in particular household transportation, which is arguably the most closely related to residential energy use. The comparison is limited by the fact that public transportation, an important determinant of household mobility and thus a key factor to take into account when assessing carbon tax incidence, has no equivalent in residential energy use. That said, we see an interesting connection between the two sectors in that, just like carbon tax revenue from heating expenses could be used to fund home retrofit programmes, revenue from gasoline expenses could provide extra funding for feebate programmes (Durrmeyer and Samano, 2017), thus allowing the government to boost the rebate part. In turn, we see an important difference between the two sectors in that, unlike the automobile market, the market for home retrofits is to a large extent local and involves a significant labour input, for instance for insulation works and duct sealing. It is thus less clear that the subsidy component can increase the competitiveness of the national industry in the export market as it can with automakers.
26
6.3 Policy implementation
On the one hand, we find little difference between lump-sum and subsidy recycling as regards
distributional impacts. On the other hand, we find that the former option saves energy much more cost-effectively. Altogether, subsidy-recycling therefore seems like a sensible policy option. The question now is: Is it feasible, practically and politically?
From an administrative perspective, a number of subsidy programmes exist in France that encourage energy efficiency improvements in the residential sector. This includes tax credits on income taxes and value-added taxes, zero-interest loans and fuel-poor targeted grants. In 2016, the government spent over €3 billion on these programmes, including over €1.5 billion on income tax credits alone, benefiting about 1 million households (IGF and CGEDD, 2017). In a related paper, Giraudet et al. (2021a) project that, with the carbon tax increasing at the rate assumed in Table 4 and subsidy rates kept at their current levels, carbon tax proceeds will exceed the public cost of subsidy programmes in 2025 and thereafter. The government could therefore take advantage of the pre-existing administrative infrastructure to better connect the two systems. The fact that the rate schedule of income tax credits is revised each year in the Finance Bill should facilitate this approach. So does the fact that auction revenues from the EU ETS are now earmarked to the French National Housing Agency (ANAH) to fund home energy efficiency programmes (Postic et al., 2019).
From a political perspective, subsidy-recycling also has merits. As noted earlier, it allows the government to meet the same environmental target with a lower tax rate. This can provide an environmental hedge against the political uncertainty surrounding the tax rate. Another merit is that subsidy programmes are more likely to be supported by energy efficiency industries than are lump-sum payments. Though rent extraction might be a concern, it should be limited by specifying subsidies in proportion to energy efficiency improvements, rather than ad valorem (Nauleau et al., 2015).
Against these benefits, new administrative costs can be envisaged. Though probably low,15 the
administrative costs associated with the carbon tax could in theory increase if it were combined with an energy efficiency subsidy. Indeed, empirical evidence abounds that energy efficiency subsidy
programmes save significantly less energy than predicted (e.g., Metcalf and Hassett, 1999; Fowlie et al., 2018). Explanations include rebound effects (Sorrell et al., 2009), biases in engineering simulations that overestimate pre-retrofit energy consumption (Sunikka-Blank and Galvin, 2012) and information asymmetries that limit the quality with which retrofit works are completed (Giraudet et al., 2018). This implies that, for programmes to deliver effectively, monitoring and verification is strongly needed. The government has taken different actions to address this. First, in order to get subsidies, homeowner must hire a contractor holding an official label, Reconnu garant de l’environnement (RGE), certifying good practice in renovation works. The label is awarded for four years after a two-day training session and realizations are subject to random verification. Second, the fiscal administration randomly verifies
15 In the absence of reliable estimates for France, Canada provides a relevant benchmark: the C$20/tCO
2-eq fuel
charge is expected to generate C$2.81 billion in direct revenues in 2019-2020 and C$34.7 million in administrative costs, hence 1.2% of revenues, mostly spent on staff. Sources: https://fr.reuters.com/article/idUSKBN1ZY215; https://www.pbo-dpb.gc.ca/en/blog/news/cost-of-administering-the-federal-fuel-charge-and-climate-action-incentive.
27 whether the purchase price claimed for tax credits match those reported on invoices. As the same requirements apply to several other energy efficiency programmes (e.g., zero-interest rate loans, white certificates), most of the associated administrative costs are already sunk. We therefore do not expect administrative costs to significantly increase if the pre-existing carbon tax is connected to pre-existing energy efficiency subsidy programmes.
7 Conclusion
By international standards, the French carbon tax is among the most ambitious carbon pricing schemes. Once meant to steadily grow, it has been frozen since 2018 after the Gilet Jaune protest movement forcefully opposed an upcoming hike. This lack of support from the public seems to be persistent, as the Convention Citoyenne pour le Climat, an assembly of 150 randomly drawn citizens tasked with making policy proposals for fair and effective climate action, ignored it in their proposals and instead
recommended the status quo be maintained for another five years (Giraudet et al., 2021b). With plans to implement carbon border adjustment mechanisms as part of the European Green Deal,16 however,
carbon pricing will remain at the top of the agenda and the question of how to recycle carbon revenue will continue to be a pressing issue.
Our study used an integrated energy-economy model to assess the cost-effectiveness and distributional impacts of the French carbon tax and two options for revenue recycling: a lump-sum payment and an energy efficiency subsidy. The assessment focuses on residential energy use for heating, typically contributing a third of household energy use. Our highly detailed partial-equilibrium framework permits in-depth assessment of equity issues along multiple dimensions: fuel poverty and inequalities, the latter with vertical and horizontal contrasts, each assessed with heating expenditure and heating intensity. We find that both recycling options offset the regressive impacts of the carbon tax. Lump-sum recycling stands out as more effectively reducing horizontal inequalities between owner-occupiers and tenants. In turn, subsidy recycling stands out as more cost-effectively saving energy and increasing comfort. The win-win aspect to subsidy recycling – less inequality, higher cost-effectiveness – adds to other benefits not demonstrated in this paper but underlying its motivation. On the general public part, households consistently express across the world a clear preference for energy efficiency subsidy-like recycling schemes. On the policy-maker part, hybrid tax-subsidy systems can be a politically palatable substitute for tax hikes. Earmarking carbon tax proceeds to fund existing subsidy programmes in France moreover seems technically feasible, as the two systems involve commensurate amounts of public money and are revised on an annual basis. For all these reasons, we see subsidy-recycling as a promising policy avenue – fair, cost-effective and politically acceptable. More research is needed, however, to determine how the instrument could be adjusted so as to better support tenants.
Whatever the approach taken to recycling, implementation will involve a great deal of engineering, communication and citizen participation. Indeed, a strict revenue-neutrality between tax proceeds and recycling payments is unlikely to be sustained over time and across sectors. Effective policy design will
16
28 therefore need to involve flexibility provisions, such as a minimum amount to be returned to households in each sector, and a safety margin as to how strictly proceeds must be recycled onto the same sector as that they originate from. Given the key role trust in politicians plays in gathering support for a carbon tax (Klenert et al., 2018), such policy specifications will need to be clearly communicated to the general public so people have a better understanding of how the reform can improve their and their fellow citizens’ well-being (Carattini et al., 2017; Douenne and Fabre, 2020). Lastly, citizen participation could be instrumental in overcoming status quo and building consensus over fair and effective action, following a global momentum towards citizens’ assemblies. Now at the forefront of social science research, these issues crucially need to be addressed to make carbon pricing work.
29
Appendix A: Renovation costs
Our representation of energy efficiency improvements through EPC label upgrades relies on a cost matrix obeying two standard economic rules: (i) decreasing returns, in that the incremental cost of energy efficiency upgrades is increasing; (ii) economies of scale, making it cheaper to complete a given upgrade at once rather than sequentially (Table A1). Expressed in terms of ensuing energy savings (Table A2), it yields a weighted average cost of €0.08 per lifetime discounted kilowatt-hour saved. Intangible costs are calibrated at base year 2012 so as to reproduce observed renovation patterns (Table A3). Further information can be found in the online appendix (Section 2.3.4).
Table A1: Renovation costs, expressed in €/m²
Final label F E D C B A Initial label G 76 136 201 271 351 442 F 63 130 204 287 382 E 70 146 232 331 D 79 169 271 C 93 199 B 110
Table A2: Renovation cost-effectiveness, expressed in € per lifetime discounted (26 years, 4%) kWh savings of primary energy
Final label F E D C B A Initial label G 0.025 0.028 0.033 0.039 0.047 0.057 F 0.036 0.043 0.053 0.066 0.083 E 0.057 0.070 0.089 0.116 D 0.093 0.123 0.167 C 0.178 0.258 B 0.446
Table A3: Calibrated intangible costs, expressed in €/m²
Final label F E D C B A Initial label G 32 32 51 56 128 149 F 20 43 36 86 125 E 27 33 48 106 D 18 46 74 C 46 36 B 0
30
Appendix B: Impacts on fuel poverty, as measured by the heating
intensity indicator
31
Appendix C: Impacts were the landlord-tenant dilemma overcome
In a more exploratory perspective, we reconsider policy impacts on fuel poverty in a counterfactual setting where the landlord-tenant dilemma is overcome. We effectively consider that subsidy
programmes benefit homeowners irrespective of their occupancy status. Indeed, the assumption made in our default setting that private landlords have a much shorter investment horizon than do owner-occupiers makes the former much less responsive than the latter to subsidy programmes in the default specification. This allows us to capture the empirical fact that private landlords participate very little in subsidy programmes. In an attempt to explore more desirable market environments, we now assume an identical investment horizon of 30 years for all homeowners in the specification extended to landlords.17 Figure 12 shows that, absent the tax, the count of fuel-poor households is cut by a third by the end of the time horizon. In particular, fuel poverty shrinks among tenants (middle left panel), which was not the case in our default setting (cf. Figure 5). Tax effects are qualitatively similar to those in the default
setting, only smaller in magnitude, which reinforces the decrease in fuel poverty. As expected, tax effects are modest on tenants.
17 The low participation of private landlords in the model is generated by some features that can be interpreted as
a market failure, namely contractual frictions that prevent landlords from passing through renovation costs onto rents. In practice, low participation can also be explained by a policy failure in that many subsidy programmes restrict eligibility to owner-occupiers. Whatever type of failure is more significant in practice, our extended specification can be viewed as ruling them all out.
32