IET Electric Power Applications
Research Article
Multiple features extraction and selection for
detection and classification of stator winding
faults
ISSN 1751-8660 Received on 25th July 2017 Revised 16th October 2017 Accepted on 5th November 2017 E-First on 6th December 2017 doi: 10.1049/iet-epa.2017.0457 www.ietdl.orgSmail Haroun
1, Amirouche Nait Seghir
1, Said Touati
21Laboratory of Electrical and Industrial Systems (LSEI), Department of Electrical Engineering, U.S.T.H.B El Alia, BP. 32, Bab Ezzouar, 16111, Algiers, Algeria
2Electrical Engineering Department (DGE), Nuclear Research Center of Birine (CRNB) Bp 180, Ain Oussera, Algeria E-mail: [email protected]
Abstract: In this study, a new effective approach for detection and classification of stator winding faults in induction motors is
presented. The approach is based on current analysis. It uses multiple features extraction techniques, where Park transform, zero crossing time signal, and the envelope are extracted from the three-phase stator currents. Then, statistical features are calculated from time and frequency domains of each extracted signal. The Features selection techniques (ReliefF, minimum redundancy and max relevancy, and support vector machine approach based on recursive feature elimination) are used to select from the extracted features the most relevant ones. As a classifier, the self-organising map neural network is used. The proposed procedure is experimentally studied using stator current signals obtained from various faulty cases and a healthy induction motor at different load variations. The experimental results verify that the proposed strategy is able to distinguish the faulty cases from the healthy ones. Also, it effectively identifies the faulty phase in addition to the extent of the fault.
1 Introduction
Electrical rotating machines have wide applications in various industrial fields and represent the mainstay of many critical sectors such as petrochemical, nuclear, and aeronautics. These fields require accurate efficiency and continuous operation. Despite their reliability and robustness, the electrical rotating machines are still susceptible to a variety of failures due to several issues such as power quality, overloads, mechanical vibrations and stress, severe operating environments and conditions, or even manufacturing defects [1].
One of the most common faults in alternating current rotating machines is the stator winding inter-turn short circuits, where investigations have shown that up to 38% of breakdowns of electric motors are caused by stator winding failures [2]. It is believed that the stator winding faults begin with a short circuit involving a few turns in a coil, and then evolve into a hazardous short circuit among two phases or phase to ground (machine frame) short circuit [3]. These faults lead inevitably to the motor failure and consequently influence the effective and safe operation of the whole system or plant with consequences in costs and safety.
Hence, early detection and diagnosis of such faults are quite necessary for the motor protection and for achieving high reliability and safety. Therefore, several systems for stator windings’ fault detection and diagnosis are proposed [4–6]. These fault diagnosis systems can be decomposed into model- and signal-based systems.
For the model-based fault detection techniques, a mathematical dynamic model with a set of input and output signals of the machine is used to detect the machine condition [7, 8]. However, these techniques are very sensitive to the motor parameter variations [9].
For the signal-based approaches, the faults can be detected by monitoring and analysing different signals measured from the motor such as stator currents [4, 10–15], voltage [16], instantaneous power and flux [17], vibrations [18], temperature and thermal analysis [19], and electromagnetic or mechanical torque [20, 21].
Although these techniques are important, the current analysis is the most explored and well-known approach. This is due to their low cost, non-invasive nature, and a large number of failures that
can be detected [6]. This technique involves various signal-processing tools, such as classical frequency domain analysis [10] and high-resolution techniques [11]. Time-frequency domain techniques like discrete wavelet transform [12], Park's transform [4], envelope analysis [13, 14], and zero crossing time (ZCT) signal [15].
Although these approaches can achieve high performances, when dealing with growing faults and particularly at an unbalanced power supply and noisy condition, the diagnosis of the inter-turn short circuit becomes more challenging. Moreover, a low fault detection performance leads to the appearance of false alarms and lot of misclassified cases due to the interference of the power supply, resulting in unnecessary inspection or major maintenance fees. These common signal-processing methods require also a prior expert knowledge of the stator winding fault effects for accurate failure detection and diagnosis. Thus, an automatic decision-making tool for classifying the motor condition into different health condition categories is needed. Actually, the combination of artificial intelligence (AI) tools with signal processing methods has drawn the attention of many researchers in last few years. These AI-based approaches comprise support vector machine (SVM) [22], fuzzy logic [23], and artificial neural networks [14, 20, 21] among others.
A diagnosis process based on the AI technique and multiple signatures should be more reliable in stator fault detection and severity evaluation. Such a system can also reduce the effect of some misinterpreted signatures that cause false alarms or misclassified cases. Nonetheless, it can weigh down the classification process since much time is needed to calculate the results from the high dimensionality feature set [14]. Therefore, feature selection is an option to select the features that contain the most discriminative information. Feature selection, in general, improves the accuracy and reduces computational and training time of the fault classifier by reducing the dimensionality of the features’ set.
This study aims at developing a new automatic fault detection and classification approach for various cases of stator winding inter-turns, a short circuit with load variation and unbalanced power supply. The proposed methodology, compared with those previously cited, exhibits high accuracy and no false alarms or misclassified cases. It is based on multiple signature analysis
extracted from the time and frequency domains of the three-phase stator currents by different techniques. The decision-making system is based on the self-organising map (SOM) neural network. To enhance the capability and reliability of the SOM, three different feature selection techniques are used to select the most appropriate and effective fault indicators. These techniques are the ReliefF algorithm, the minimum redundancy and max relevancy
(mRMR) technique, and the SVM approach based on recursive feature elimination (SVM-RFE).
The rest of the paper is arranged as follows: Section 2 presents a detailed description of the proposed diagnosis methodology and some theoretical background about the adopted tools. Subsequently, the experimental implementation is presented in Section 3. Section 4 presents results and discussion of the developed approach. Finally, Section 5 presents conclusions, perspectives, and future work.
2 Proposed fault detection method and materials
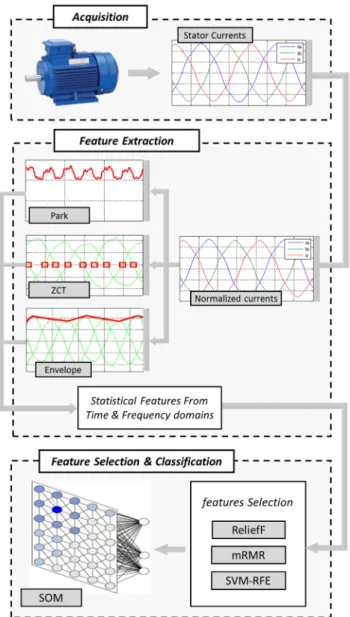
The aim of the present study is to investigate the detection and classification of stator winding faults using multiple fault signatures extracted from the stator currents.For this purpose, the three-phase stator currents are first acquired from the test motors. The adopted procedure combines three pre-processing tools of the stator currents, which are Park's vector magnitude, the envelope, and the ZCT signal. Then statistical parameters are extracted as fault signatures from the time and frequency domains of each pre-processed signal. To improve the diagnosis process performances, the ReliefF, mRMR and SVM-RFE feature selection techniques are used for data dimension reduction and selection of the most significant features. For the decision-making step, the Kohonen SOM neural network is used as a classifier. The effectiveness of each feature extraction method is separately analysed and compared with the whole and selected features by the three feature selection techniques. The developed algorithm flowchart is depicted in Fig. 1.
2.1 Three-phase stator current pre-processing
The purpose of signal pre-processing is to clean (suppress noise) and to transform the original measured signal to another form that contains useful information and excludes the data which are less characteristic of the motor failures.
In this study, Park's vector magnitude, the ZCT, and the envelope of the three phase currents are extracted.
2.1.1 Park's vector magnitude: The effect of unbalanced stator
currents due to winding fault can be observed using the Park transformation [4]. This technique provides greater insight into the severity of stator faults.
According to the currents of phases isa, isb and isc, the Park's vector components isd, isq are given by the following expressions:
isd= 2/ 3 isa− 1/ 6 isb− 1/ 6 isc, (1)
isq= 1/ 2 isb− 1/ 2 isc. (2)
Graphically, under healthy conditions, Lissajou's curve isq= f (isd) takes a circle form, whereas it takes an elliptic form in the case of stator faults. This deformation can be quantified by the calculation of the magnitude (modulus) of Park's vector given by:
isdq(t) = isd(t)2+ isq(t)2. (3)
For improved feature extraction, this calculated signal is normalised by eliminating its mean value.
Lissajou's curve and Park's vector modulus of healthy and faulty motors are shown in Fig. 2.
2.1.2 Three-phase stator current envelope: Geometrically, the
envelope of the three-phase stator currents is the geometric line curve of its instantaneous maximum amplitude [13].
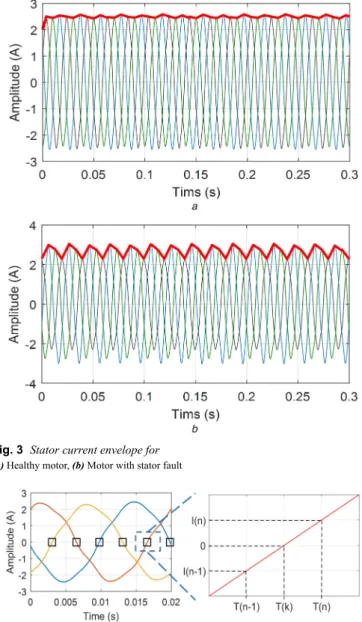
Under healthy conditions, the envelope should be constant, but it can show some fluctuations due to stator unbalance as shown in Fig. 3.
Therefore, the envelope of the stator currents contains important information about the stator winding condition.
The applied technique to extract the three-phase stator current envelope consists of first isolating the ripple of the three-phase
Fig. 1 Flowchart of the proposed stator defect classification system
Fig. 2 Park's vector (left) and magnitude (right) for (a) Healthy motor, (b) Motor with stator fault
stator current and then extracting only the positive peak of each period in each phase. The extracted points are interpolated to detect the dynamic behaviour of the envelope [13]. Finally, the signal is normalised by eliminating its mean value.
2.1.3 Zero crossing times: The analysis of the ZCT signal has
been widely investigated in stator and rotor induction motor defect diagnosis [15].
The ZCT signal is a succession of data values, acquired at each zero crossing of the three-phase stator currents. The values of the data are defined as the time difference between two successive zero-crossing instants (T(n) − T(n − 1)) minus the natural reference time of the ZCT signal [14]:
TZC(n) = T(n) − T(n − 1) − Tref. (4)
Due to the discrete sampling time, it is impossible to find the exact time at which the current is equal to zero. Therefore, by assuming that the current is linear in a small time interval (i.e. sampling time (n – 1) to (n)) as presented in Fig. 4.
Then detecting when the product of two successive values of the current is negative (I(n − 1) ∗ I(n) < 0. The approximate zero crossing point at that moment T(k) can be calculated as [15]:
T(k) = T(n) − I(n)[T(n) − T(n − 1)]I(n) − I(n − 1) . (5) Fig. 5 shows the zero crossing signal for a healthy motor and a faulty motor with a stator winding short-circuit.
As shown in this figure, the stator short circuit influences the behaviour and amplitude of the zero crossing signal. These variations can be determined easily by some statistical parameters.
As shown in the previous figures of the calculated signals, Park's vector magnitude, the envelope and the ZCT signal in the healthy case are not exactly constant. This is due to the unbalance of the power supply during experiments that can obscure the fault detection.
2.2 Feature extraction
Feature extraction is the transformation of high-dimensional data sets into a reduced representation with minimal loss of information. Feature extraction leads also to significant improvements in fault detection performances.
In the present study, after stator current signals were acquired from the test motors and the three current pre-processing techniques were applied, nine statistical indicators from the time domain and 13 from the frequency domain are extracted as fault signatures from each previously calculated signal. Thus, a total of 66 indicators are extracted. The mathematical expressions of these statistical indicators [24] are presented in Tables 1 and 2.
2.3 Feature selection
Many attributes from the extracted feature dataset can be irrelevant or redundant. The feature-selection process objective is to remove irrelevant, redundant, or noisy features and select those that bring satisfying precision for prediction or classification of the motor condition. In addition, this leads to improved learning accuracy and fault classification process [24]. A comparative study of three feature selection techniques will be presented.
The feature selection techniques are the ReliefF algorithm, the mRMR technique and the SVM-RFE.
2.3.1 mRMR algorithm: The mRMR procedure is a filter-based
feature selection technique that measures the relevance and redundancy of the feature candidates based on mutual information and selects the most relevant features having minimal redundancy and maximal relevance [25].
The mutual information I(gi, c) of given gi which represents the feature i, and the class label c is defined in terms of their frequencies of appearances P(gi), P(c) and I(gi, c) as follows:
I(gi, c) =
∫ ∫
p(gi, c)lnp(gp(gi)p(c)dgi, c) idc . (6)Fig. 3 Stator current envelope for (a) Healthy motor, (b) Motor with stator fault
Fig. 4 Calculation of approximate ZCT
Fig. 5 ZCT signal for
The maximum-relevance criterion selects the best m features in the descending order of I(gi, c), i.e. the best m features associated with the class labels:
max S
1
|S| =g
∑
i∈ SI(gi, c) . (7)Due to the very large dependency of the selected features based on Max-relevance only, we can get a lot of redundancy. For this reason, the Min-redundancy criterion is introduced:
min S 1 |S|2=
∑
gi, gj∈ S I(gi, gj) . (8)The principle of the Min-redundancy is to select the features, which are mutually maximally dissimilar. An mRMR feature selection framework is obtained by optimising the conditions in (7) and (8) simultaneously.
2.3.2 ReliefF algorithm: ReliefF algorithm is a simple and
efficient technique to estimate the quality of features in machine learning problems with strong dependencies between features [26]. In practice, ReliefF is frequently applied in data pre-processing as a feature selection method and exhibited excellent performance in both supervised and unsupervised learning. The key idea of the ReliefF is to estimate the quality of attributes according to how well their values distinguish between instances that are close to each other [26].
Given a randomly selected instance Insm from class L, ReliefF searches for K of its nearest neighbours from the same class called nearest hits H, and also K nearest neighbours from each of the different classes, called nearest misses M. It then updates the quality estimation Wi for attribute i based on their values for Insm,
H and M. If Insm and H have different values on attribute i, then the quality estimation W will decrease. On the other hand, if Insm and
M have different values on the attribute i, W will increas. The
whole process is repeated n times which is set by users. The basic algorithm of the ReliefF technique is shown in Fig. 6.
2.3.3 SVM-RFE algorithm: SVMs are a set of supervised
learning tools that are usually used for classification purposes [27, 28]. The SVM has many variants. SVM-RFE is one that was used for feature selection or ranking.
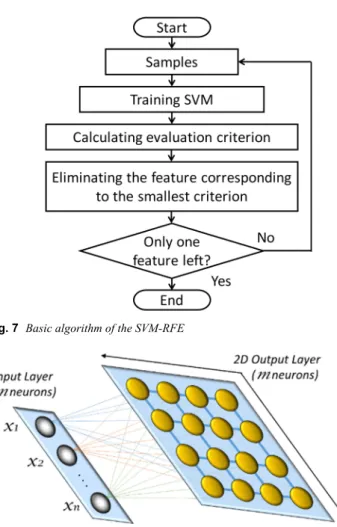
The SVM-RFE algorithm is an iterative elimination process. The outline of this algorithm is presented in Fig. 7.
Its main idea is to eliminate redundant features and select better and more effective feature set. In the iteration process, irrelevant and redundant features are removed sequentially, whereas the important ones are kept using a class interval in the SVM algorithm as the evaluation criterion [27].
The SVM-RFE algorithm can be decomposed into four steps: i. Train an SVM on the training set.
ii. Use the weights of the resulting classifier to calculate the score of each feature.
iii. Eliminate the feature with the smallest score.
iv. Repeat the process with the training set limited to the remaining features.
The output of the SVM-RFE algorithm is a feature list arranged according to their importance.
2.4 Kohonen SOM
The SOM (also known as Kohonen map) is an unsupervised artificial neural network, which is a powerful method for clustering and visualising high-dimensional data [29] based on structural units called neurons, arranged as a two-dimensional lattice (map) called the topological map. Two layers of neurons comprise a SOM network. The first one called input layer (composed of N neurons,
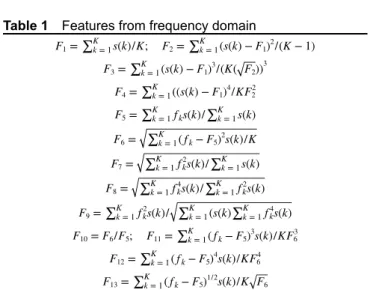
Table 1 Features from frequency domain
F1= ∑k = 1K s(k)/K; F2= ∑k = 1K (s(k) − F1)2/(K − 1) F3= ∑k = 1K (s(k) − F1)3/ K F2 3 F4= ∑k = 1K ((s(k) − F1)4/KF22 F5= ∑k = 1K fks(k)/∑k = 1K s(k) F6= ∑k = 1K ( fk− F5)2s(k)/K F7= ∑k = 1K fk2s(k)/∑k = 1K s(k) F8= ∑k = 1K fk4s(k)/∑k = 1K fk2s(k) F9= ∑k = 1K fk2s(k)/ ∑k = 1K (s(k)∑k = 1K fk4s(k) F10= F6/F5; F11= ∑k = 1K ( fk− F5)3s(k)/KF63 F12= ∑k = 1K ( fk− F5)4s(k)/KF64 F13= ∑k = 1K ( fk− F5)1/2s(k)/K F6
s(k) is a spectrum for k = 1, 2,…, K, K is the number of spectrum lines; fk is the frequency value of the kth spectrum line.
Table 2 Features from time domain XRMS= 1N
∑
i = 1 n xi2; σ = 1N∑
i = 1 n (xi− x¯)2XPPV= ( max (xi) − min (xi))/2;
XKUR= 1N
∑
i = 1 n (xi− x¯ σ ; XSKE= 1N∑
i = 1 n (xi− x¯ σ 3XCLI= max(| xi|)/ 1/N∑i = 1n |xi|2
XIF= max(| xi|)/ 1N
∑
i = 1 n |xi| XCF= max(| xi|)/ 1N∑
i = 1 n (xi2) XSF= 1N∑
i = 1 n (xi2)/ 1N∑
i = 1 n |xi|xi is a signal samples for i = 1, 2,…, N, N is the number of data samples.
one for each input variable). It is responsible for receiving and transmitting information from outside to the output layer. The output layer (composed of M neurons) is in charge of information processing as well as the construction of map features. Usually, neurons in the output layer are arranged in a rectangular or hexagonal two-dimensional map [29] as shown in Fig. 8.
The network is initialised by sampling random values for the preliminary reference vectors from a uniform distribution having limits defined by the input data. Another option is to use linear initialisation, which is faster and less computationally arduous than the classic random initialisation [30]. During the training, the input vectors are first mapped one by one to particular neurons, called the best matching units (BMUs) on the basis of the smallest n-dimensional distance (Euclidean distance) between the input vector and the reference vectors. Next, the nearest neighbours of an activated neuron are likewise activated according to a neighbourhood function (e.g. Gaussian distribution) which depends on the network topology. Finally, the reference vectors of all activated neurons are updated and the next input vector is processed in the same manner.
After the training phase of the SOM, its quality can be evaluated by two parameters: quantisation error (QE) and topographic error (TE). The QE is the average distance between each input vector and its BMU. The TE is defined as the proportion of all input vectors for which the first and second BMUs are not adjacent [29]. Lower QE and TE values specify superior mapping quality [30].
3 Experimental validation
3.1 Test rig and data acquisitionThe investigations for the proposed stator-winding fault diagnosis were carried out using data from the LAII laboratory (France) [31]. The motor under test is a two-pole pair three-phase squirrel cage induction motor with 1.1 kW rated power, 220/380 V, and 50 Hz voltage supply.
Three Hall effect current sensors are used to measure the three-stator currents at 2 kHz sampling frequency for 1 s of sampling time. The currents are then filtered using a fourth-order anti-aliasing filter with a cross-over frequency fixed at 500 Hz.
For testing the stator short circuit fault diagnosis task, in addition to the healthy case, the induction machine was operated under six different stator fault conditions:
• A short-circuit of 18 turns over 464 in the phase A winding. • A short-circuit of 40 turns over 464 in the phase A winding. • A short-circuit of 29 turns over 464 in the phase B winding. • A short-circuit of 58 turns over 464 in the phase B winding. • A short-circuit of 18 turns on phase A and 29 turns on phase B
windings.
• A short-circuit of 58 turns on each one of phase A and phase B windings
In each case, eight different load levels were used: (torque T = 0–7 Nm).
During experiments, it was noted that the power supply voltage is not exactly balanced. This can obscure the classification task.
3.2 Implementation
The collected experimental stator currents were decomposed into 336 segments corresponding to the different motor conditions (48 representatives from each case).
Then the 66 features were calculated from each of the 336 segments to construct a database (size is 336 × 66). Two-third (2/3) of this database serve to train the SOM, and the rest (1/3) were kept to test the trained map. The SOM network was implemented by using the SOM toolbox for Matlab [32]. A label is associated with each motor condition as presented in Table 3.
The classification performance of the SOM can be analysed by projecting the testing data sets on the trained maps. The best matching unit from the map will be found for each data sample [30]. Classification accuracy can be evaluated as a fraction of correctly classified input samples.
4 Results and discussion
The three feature extraction methods have been studied separately and compared with each other for feature performance evaluation.
Fig. 9 shows a histogram for the classification accuracy of the feature extraction techniques separated and combined.
The time domain features of the extended Park's vector (EPV) are better than the time or frequency domain of the envelope and the ZCT signal techniques where it gives 89.29% classification accuracy. However, the combination of the time and frequency domain features of Park's vector magnitude (EPV) gives better results compared with the other methods where we get 92.86% classification accuracy.
The combination of the whole (66) extracted features from the three pre-processing techniques gives 94.64% classification accuracy, which is the best result.
So, we can note that the combination of all the extracted features is more effective than the extracted features separately.
After evaluating the feature extraction techniques separately and combined, we present the whole dataset to dimensionality
Fig. 7 Basic algorithm of the SVM-RFE
Fig. 8 SOM architecture
Table 3 Associated label to test motor conditions
Motor condition Fault condition & level Associated label
healthy motor 0 NOR
motor with stator winding short circuit
18 turns on phase A A18 29 turns on phase B B29 40 turns on phase A A40 58 turns on phase B B58 18 on A & 29 on B A18B29 58 on A & 58 on B A58B58
reduction based on ReliefF, mRMR and SVM-RFE feature selection approaches.
The feature selection techniques (mRMR, ReliefF and SVM-RFE) are implemented starting with the number of selected features from one to 66 in order to detect the optimal number of features.
Fig. 10 presents the classification performances of the trained SOM versus the number of selected features by the three feature selection algorithms.
According to this figure, the optimal number of selected features is 14 for the ReliefF technique, 20 for the SVM-RFE, and 30 for the mRMR technique.
Each one of the trained maps using the selected features by the feature selection techniques exhibits 100% classification accuracy that means there is no false alarms or misclassified cases.
After the training phase and the classification performance evaluation, the result of the Kohonen map (SOM) can be interpreted also by a topological two-dimensional network with the associated labels of the different classes. This representation gives a topological knowledge of the distribution of the training data on the map and offers a clear visualisation of the distance between the classes on the map.
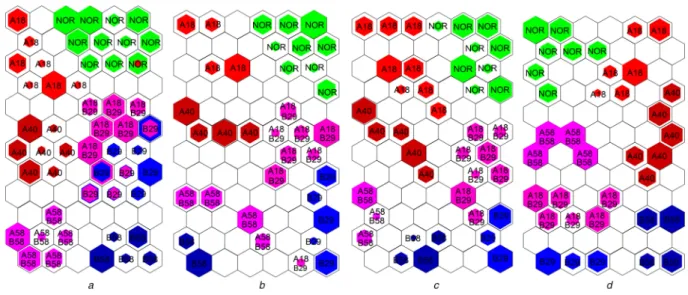
Fig. 11a shows the trained SOM map using the whole extracted features, whereas Figs. 11b–d present the obtained maps using the selected features by the mRMR, SVM-RFE and ReliefF algorithms, respectively. Each SOM map consists of 72 (12 × 6) neurons.
The visual inspection of the trained maps shows the associated labels of the seven training conditions, which were classified into different classes.
The trained map using the whole data (Fig. 11a) shows no real separation between different classes. Moreover, it presents an overlap between some classes where we see some neurons are activated for more than one class (two colours in one neuron). This is considered as a training error. Fig. 11a shows also that each class has several representative neurons, which means that there are some dissimilarities in the whole feature set
In the trained maps by the selected features (by ReliefF, mRMR and SVM-RFE algorithms) (Figs. 11b–d), the classes are well separated and have a better distribution compared with the trained map using the whole feature set. This is due to the elimination of the redundant and insignificant features by the three feature selection techniques.
Fig. 11d shows the trained map obtained by using the ReliefF selected features, showing more homogeneity in the separation between classes. Where the samples collected from the healthy motor (NOR) are mostly concentrated in the upper left corner. While those belonging to the faulty conditions are extensively
Fig. 9 Performance comparison of features from the three pre-processing
methods
Fig. 10 Classification accuracy versus number of selected features using the three feature selection techniques
Fig. 11 Obtained trained maps using the different selected feature sets (a) All features, (b) mRMR, (c) SVM-RFE, (d) ReliefF
distributed on the upper right, middle left and the bottom of the map. Furthermore, it can be noted that the samples collected from faulty conditions in the same phase are grouped closely to each other on the SOM map. For instance, the faults on phase A (A18 and A40) are located on the upper right side of the map. Also, the bottom side comprises the two classes of faults on phase B (B29 and B58). Whereas the two classes of combined faults on A and B (A18B29 and A58b58) are located in the mid left areas of the trained SOM map.
It should be noticed that for all the trained maps, the load effect has not been observed even with the use of different load levels in the training dataset. The power supply unbalance noticed in the calculated signals also has no effect on the trained maps using the feature selection techniques.
For better analysis and evaluation of the feature selection techniques, more performance parameters of the four trained SOM maps are presented in the performance radar chart in Fig. 12.
Radar charts or spider charts are sometimes called as valuable tools for comparing and evaluating multiple quantitative variables at the same time. Each variable value is plotted along its provided axis that starts from the centre. All axes are arranged radially, and all the variables in a dataset are connected together to form a polygon.
The parameters used to evaluate the trained SOMs consist of a number of features, training time, training and test errors, quantisation and topographic errors.
Performances are measured by the area of the shape marked by the formed polygon in this chart. So the smaller the shape, the better the performances.
The radar chart clearly depicts that the trained map using the whole dataset is the worst in overall performance. This is due to poor quality and redundancy of some features in the extracted feature set.
By comparing the results of the trained maps using the feature selection techniques ReliefF, mRMR, and the SVM-RFE, it can be seen that the three feature selection techniques have the same performance in terms of training, test and topographic errors. However, in terms of the number of selected features, training time, and quantisation error, the ReliefF algorithm results are much better than the mRMR and SVM-RFE.
Therefore, it can be noticed that the use of the feature selection techniques can improve and enhance the training of SOM in the stator fault detection system. However, the ReliefF feature selection technique is more reliable where it gives best or at least the same classification performance, with lower training time consumption than the mRMR and SVM-RFE techniques.
5 Conclusion
This study presents a methodology for stator winding short circuit fault detection and diagnosis based on multiple features extraction and selection techniques. Three current pre-processing techniques that include Park's vector magnitude, the ZCT signal and the
envelope are used. Multiple statistical signatures are then calculated from the time and frequency domains of each signal. To improve the effectiveness of the fault detection process, the ReliefF, mRMR, and SVM-RFE feature selection techniques are used to select the most appropriate features.
From the experimental results based on motors with different stator fault situations, at different load levels, it can be concluded that using multiple features extraction techniques gives better results in terms of classification accuracy than using these techniques separately.
The integration of the feature selection techniques (ReliefF, mRMR and SVM-RFE) has improved extensively the classification accuracy and quality of the trained SOMs, but the ReliefF algorithms give the best or at least the same performance than the two other algorithms with reduced training time and lower number of selected features.
Therefore, this proposed stator fault detection and diagnosis approach is a very effective and efficient tool, since it is not only possible to detect the short circuit faults, but it is also able to locate the faulty phase and estimate its extent by separating the different faulty conditions with a high reliability.
Further investigations will be carried out in a way to apply the proposed technique for other electrical faults of rotating machines and implement this strategy in a real-time application.
6 References
[1] Chow, M.Y.: ‘Guest editorial special section on motor fault detection and diagnosis’, IEEE Trans. Ind. Electron., 2000, 47, (5), pp. 982–983
[2] Han, T., Yang, B.S., Yin, Z.J.: ‘Feature-based fault diagnosis system of induction motors using vibration signal’, J. Qual. Maint. Eng., 2007, 13, (2), pp. 163–175
[3] Baccarini, L.M.R., de Menezes, B.R., Caminhas, W.M.: ‘Fault induction dynamic model, suitable for computer simulation: simulation results and experimental validation’, Mech. Syst. Signal Process., 2010, 24, (1), pp. 300– 311
[4] Khalaf, F.M.: ‘Advance current monitoring techniques to detect and diagnosis the inter-turn stator fault in three phase induction motor’, Int. J. Eng. Sci., 2017, 6, (1), pp. 66–70
[5] Tavner, P.J.: ‘Review of condition monitoring of rotating electrical machines’, IET Electr. Power Appl., 2008, 2, (4), pp. 215–247
[6] Gandhi, A., Corrigan, T., Parsa, L.: ‘Recent advances in modeling and online detection of stator inter-turn faults in electrical motors’, IEEE Trans. Ind. Electron., 2011, 58, (5), pp. 1564–1575
[7] Hamoudi, A., Kouadri, B.: ‘Stator winding inter-turn short-circuit detection in induction motors by parameter identification’, IET Electr. Power Appl., 2017,
11, (2), pp. 272–288
[8] Berzoy, A., Mohamed, A.A.S., Mohammed, O.: ‘Impact of inter-turn short-circuit location on induction machines parameters through FE computations’, IEEE Trans. Magn., 2017, 53, (6), pp. 1–4
[9] Hoseini, S.R.K., Farjah, E., Ghanbari, T., et al.: ‘Extended kalman filter-based method for inter-turn fault detection of the switched reluctance motors’, IET Electr. Power Appl., 2016, 10, (8), pp. 714–722
[10] Otava, L.: ‘Implementation of PMSM inter-turn short fault detection using frequency analysis of stator currents’, IFAC-PapersOnLine, 2016, 49, (25), pp. 086–091
[11] Memala, A.W., Rajini, V.: ‘Parametric method based inter-turn incipient short circuit stator fault detection of induction motor’, Indian J. Sci. Technol., 2016,
9, (43), pp. 1–6
[12] Devi, N.R., Sarma, D.V.S., Rao, P.V.R.: ‘Detection of stator incipient faults and identification of faulty phase in three-phase induction motor–simulation and experimental verification’, IET Electr. Power Appl., 2015, 9, (8), pp. 540– 548
[13] Da Silva, A.M.: ‘Induction motor fault diagnostic and monitoring methods’. Doctoral dissertation, Marquette University, 2006
[14] Haroun, S., Nait Seghir, A., Touati, S.: ‘Stator faults detection and diagnosis in reactor coolant pump using Kohonen self-organizing map’, in Amine, A., Otmane, A., Bellatreche, L. (Eds.): ‘Modeling approaches and algorithms for advanced computer applications’ (Springer International Publishing, Cham, Switzerland, 2013), pp. 17–26
[15] Ukil, A., Chen, S., Andenna, A.: ‘Detection of stator short circuit faults in three-phase induction motors using motor current zero crossing instants’, Electr. Power Syst. Res., 2011, 81, (4), pp. 1036–1044
[16] Meinguet, F., Semail, E., Kestelyn, X., et al.: ‘Change-detection algorithm for short-circuit fault detection in closed-loop AC drives’, IET Electr. Power Appl., 2014, 8, (5), pp. 165–177
[17] Ahmed, I., Khan, M.S., Imran, K.: ‘A novel approach for detection of shorted turns fault in machine using combination of flux and instantaneous power signal’, Int. J. Comput. Electr. Eng., 2011, 3, (2), p. 233
[18] Alameh, K., Cité, N., Hoblos, G., et al.: ‘Vibration-based fault diagnosis approach for permanent magnet synchronous motors’, IFAC-PapersOnLine, 2015, 48, (21), pp. 1444–1450
[19] Singh, G., Anil Kumar, T.Ch., Naikan, V.N.A.: ‘Induction motor inter turn fault detection using infrared thermographic analysis’, Infrared Phys. Technol., 2016, 77, pp. 277–282
[20] Haroun, S., Nait Seghir, A., Touati, S., et al.: ‘Misalignment fault detection and diagnosis using AR model of torque signal’. IEEE 10th Int. Symp. on Diagnostics for Electrical Machines, Power Electronics and Drives, 2015, pp. 322–326
[21] Haroun, S., Nait Seghir, A., Hamdani, S., et al.: ‘AR model of the torque signal for mechanical induction motor faults detection and diagnosis’. IEEE 3rd Int. Conf. on Control, Engineering & Information Technology, 2015, pp. 1–5
[22] Martínez-Morales, J.D., Palacios-Hernández, E.R., Campos-Delgado, D.U.: ‘Multiple-fault diagnosis in induction motors through support vector machine classification at variable operating conditions’, Electr. Eng., 2016, pp. 1–15, doi.org/10.1007/s00202-016-0487-x
[23] Bechkaoui, A., Ameur, A., Bouras, S., et al.: ‘Open-circuit and inter-turn short-circuit detection in PMSG for wind turbine applications using fuzzy logic’, Energy Procedia, 2015, 74, pp. 1323–1336
[24] Lei, Y., He, Z., Zi, Y.: ‘A new approach to intelligent fault diagnosis of rotating machinery’, Expert Syst. Appl., 2008, 35, (4), pp. 1593–1600 [25] Peng, H., Long, F., Ding, C.: ‘Feature selection based on mutual information
criteria of max-dependency, max-relevance, and min-redundancy’, IEEE Trans. Pattern Anal. Mach. Intell., 2005, 27, (8), pp. 1226–1238
[26] Robnik-Šikonja, M., Kononenko, I.: ‘Theoretical and empirical analysis of reliefF and RReliefF’, Mach. Learn., 2003, 53, (1–2), pp. 23–69
[27] Wang, J., Shan, G., Duan, X., et al.: ‘Improved SVM-RFE feature selection method for multi-SVM classifier’. IEEE Int. Conf. on Electrical and Control Engineering (ICECE), 2011, pp. 1592–1595
[28] Ruiz, J.R.R., Canals, T., Gomez, R.C.: ‘Comparative study of multivariate methods to identify paper finishes using infrared spectroscopy’, IEEE Trans. Instrum. Meas., 2012, 61, (4), pp. 1027–1036
[29] Kohonen, T.: ‘Self-organizing maps’ (Edition Springer, Berlin, 2001) [30] Kiviluoto, K.: ‘Topology preservation in self-organizing maps’. IEEE Int.
Conf. on Neural Networks, 1996, vol. 1, pp. 294–299
[31] http://laii.univ-poitiers.fr/Diagnost/). ‘LAII Laboratory university of poitiers (France)’, accessed December 2012
[32] Vesanto, J., Himberg, J., Alhoniemi, E., et al.: ‘November. self-organizing map in matlab: the SOM toolbox’. Proc. Matlab DSP Conf., 1999, vol. 99, pp. 16–17