HAL Id: tel-01882121
https://pastel.archives-ouvertes.fr/tel-01882121
Submitted on 26 Sep 2018
HAL is a multi-disciplinary open access archive for the deposit and dissemination of sci-entific research documents, whether they are pub-lished or not. The documents may come from teaching and research institutions in France or abroad, or from public or private research centers.
L’archive ouverte pluridisciplinaire HAL, est destinée au dépôt et à la diffusion de documents scientifiques de niveau recherche, publiés ou non, émanant des établissements d’enseignement et de recherche français ou étrangers, des laboratoires publics ou privés.
composites linked to their processing parameters
Tanguy Choupin
To cite this version:
Tanguy Choupin. Mechanical performances of PEKK thermoplastic composites linked to their pro-cessing parameters. Mécanique des matériaux [physics.class-ph]. Ecole nationale supérieure d’arts et métiers - ENSAM, 2017. Français. �NNT : 2017ENAM0043�. �tel-01882121�
Arts et Métiers ParisTech - Campus de Paris
Laboratoire Procédés et Ingénierie en Mécanique et Matériaux
2017-ENAM-0043
École doctorale n° 432 : Sciences des Métiers de l’ingénieur
présentée et soutenue publiquement par
Tanguy CHOUPIN
le 7 décembre 2017
Mechanical performances of PEKK thermoplastic composites
linked to their processing parameters
Doctorat ParisTech
T H È S E
pour obtenir le grade de docteur délivré par
l’École Nationale Supérieure d'Arts et Métiers
Spécialité “ Mécanique et Matériaux ”
Directeur de thèse : Bruno FAYOLLE Co-encadrement de la thèse : Gilles RÉGNIER
T
H
È
S
E
JuryM. Nicolas BOYARD, CNRS Researcher, Polytech Nantes Rapporteur
M. René FULCHIRON, Associate Professor, Université Claude Bernard Rapporteur M. Philippe OLIVIER, Professor, Institut Clément Ader Président Mme Ewa PIORKOWSKA, Professor, CMMS Poland Examinateur M. Jacques CINQUIN, Research Engineer, Airbus Examinateur M. Christophe PARIS, Research Engineer, Airbus Operations Examinateur M. Gilles RÉGNIER, Professor, Arts et Métiers ParisTech Examinateur M. Bruno FAYOLLE, Professor, Arts et Métiers ParisTech Examinateur
REMERCIEMENTS
J’ai eu beaucoup de liberté pendant cette thèse, mes 4 encadrants m’ont toujours fait confiance et je les en remercie beaucoup pour ça, c’est ce qui m’a donné confiance en moi tout au long de la thèse.
Merci à mon équipe encadrante du côté d’Airbus.
Christophe merci de m’avoir accueilli pour mon stage de fin d’étude chez Airbus et de m’avoir fait confiance pour continuer en thèse. Tu as toujours été disponible pour corriger mes rapports, présentations etc. même après ton départ chez Airbus à Toulouse.
Jacques, j’ai pu apprendre beaucoup avec toi concernant les composites, c’est aussi grâce à toi que j’ai pu continuer en thèse et je t’en remercie.
Didier Filleul de m’avoir accueilli dans ton équipe et Didier Lang de m’avoir fait prendre du recul sur ma thèse, sur le pourquoi de cette thèse et ce qu’on voulait montrer.
Du côté du PIMM, j’ai eu des managers assez différents !
Bruno la force tranquille. C’est déjà grâce à toi que j’ai eu mon stage chez Airbus. A la fin d’un cours tu nous avais annoncé en passant « à la Bruno »: « Oui il y a un petit stage disponible chez Airbus, si ça intéresse quelqu’un ». Je me suis bien sûr jeté sur l’occasion ! Tu es ensuite devenu mon maitre de stage puis mon directeur de thèse. Tu es la personne qui a été la plus présente durant cette thèse, ta qualité principale est que tu es très humain et à l’écoute. Tu as été là pour toutes les étapes de la thèse, d’un grand soutien psychologique et tu es également devenu un ami. Tu es celui qui a aussi subi le plus de repet !
Gilles la force énergétique. J’ai une grande admiration pour toi. On a eu beaucoup de réunions dans ton bureau à parler de notre passion commune la cristallisation ! Je sortais en ayant compris la moitié de notre conversation avec souvent tout à modifier de ce que j’avais fait. De nombreuses fois je me disais bon là on ne va pas y arriver, je ne sais pas comment faire, ça ne marche pas et tu m’as toujours poussé pour aller plus loin et grâce à ça on a pu développer des beaux modèles de cristallisation !
J’aimerais aussi remercier l’équipe d’Arkema qui a suivi la thèse de très près.
Jérôme, que j’ai rencontré pour la première fois sur le stand d’Arkema au salon composite JEC, j’étais assez impressionné il y avait beaucoup de monde mais je voulais parler avec toi du PEKK ! On a enfin parlé de tout l’historique du PEKK et comment il était arrivé dans les mains d’Arkema. C’est un très bon souvenir pour moi.
Benoît, tu as toujours été disponible pour répondre à mes questions et tu as toujours été là pour mes présentations d’avancement de thèse et pour corriger mes divers livrables.
Henri Alexandre, qui m’a accueilli au CERDATO pour fabriquer mes premières plaques composites, je me rappelle encore de mon excitation à la fabrication de la première !
Je remercie également mes 2 stagiaires, Louis et Romain, c’était un réel plaisir de travailler avec vous, vous m’avez permis de sortir le nez de ce que je faisais et regarder d’autres aspects de mon sujet. C’est grâce à vous deux qu’une grosse partie des essais mécaniques
a été faite. Je remercie aussi les 4 PFE ENSAM qui m’ont également aidé à développer la partie mécanique de la thèse.
Je remercie les techniciens du PIMM, Paulo, Gaëlle, Anne, Alain et d’Airbus Group Innovation à Suresnes notamment Pascal Nef et Alain Renoncourt.
Mes collègues du PIMM : Sara et Fatima mes collègues de bureau qui m’ont supporté 3 ans ! Maxime Sagnard, Nicolas Gay, Justine, Sébastian.
Mes collègues chez Airbus : Basile et Pierre, Tanguy Bize, Thibaut, Marco, Alain Mesinele, Fernand, François Marie, Christian Lardière, Ana Isabel, Patrick, Isabelle, François
Je finis par remercier les deux femmes de ma vie :
Maman, même si je sais qu’Arthur me dirait qu’au festival de Cannes on a l’interdiction de remercier ses parents. Je voulais t’exprimer l’admiration que j’ai pour toi. Tu es mon inspiration dans ton travail et dans ta vie personnelle. Tu as toujours été d’un grand soutient pour tes trois enfants, toujours derrière nous à nous faire confiance. C’est en grande partie grâce à toi que je suis là.
Samira, nous nous sommes rencontré grâce au PIMM, cette thèse est associée à beaucoup de bons souvenirs avec toi, tu m’as apporté beaucoup de sérénité durant les moments difficiles et je t’en remercie.
1
TABLE OF CONTENTS
TABLE OF CONTENTS ... 1
INTRODUCTION ... 3
Industrial Context ... 3 Objectives ... 41.
MATERIALS ... 7
1.1 Prepregs ... 7 1.2 PEKK matrices ... 81.2.1 PAEK polymer family ... 8
1.2.2 PEKK copolymers ... 10
1.2.3 Crystalline morphology ... 13
1.2.4 Secondary crystallization ... 16
1.2.5 Nucleation and growth ... 17
1.3 Conclusion ... 18
2.
IMPACT OF THERMAL CYCLES ON PEKK MATRICES MECHANICAL PROPERTIES ... 19
2.1 Experimental ... 19
2.1.1 Differential Scanning Calorimetry (DSC) ... 19
2.1.2 Wide angle X-ray diffraction... 20
2.1.3 Optical microscopy ... 20
2.1.4 Mechanical tests ... 20
2.2 Crystralline morphologies ... 23
2.2.1 Crystalline structure ... 23
2.2.2 Nucleation and growth ... 23
2.3 Crystallization kinetics ... 25
2.3.1 Crystallization kinetic comparison ... 25
2.3.2 Isothermal crystallization kinetics ... 27
2.3.3 Non-isothermal crystallization kinetics ... 43
2.4 Influence of crystallization on The matrix mechanical properties ... 50
2.4.1 Crystallinity measurement of PEKK plates ... 50
2.4.2 Influence of crystallinity on PEKK matrix mechanical properties ... 51
2.4.3 Influence of crystalline morphologies on PEKK 6002 mechanical properties ... 56
2.5 Conclusion ... 58
3.
IMPACT OF TIME/TEMPERATURE PARAMETERS ON THE PROCESSING WINDOW ... 61
3.1 Experimental ... 61
3.1.1 Thermo-Gravimetric Analysis (TGA) ... 61
3.1.2 Rheological measurements ... 61
3.1.3 Differential Scanning Calorimetry (DSC) ... 61
3.1.4 Gel Permeation Chromatography (GPC) ... 62
2
3.2 Macromolecular modification mechanisms ... 62
3.3 Crosslinking kinetics ... 63
3.3.1 Weight changes ... 63
3.3.2 Gel Permeation Chromatography (GPC) analysis ... 65
3.3.3 Rheological analysis... 67
3.3.4 DSC measurements ... 75
3.4 Crosslinking kinetics Modelling ... 76
3.5 Impact of macromolecular changes on crystallization kinetics ... 79
3.5.1 Crystallization peak analysis ... 79
3.5.2 Modification of the Hillier crystallization kinetic parameters ... 81
3.6 Impact of macromolecular changes on mechanical properties ... 83
3.7 Conclusion ... 85
4.
APPLICATION TO PEKK STRUCTURAL COMPOSITES ... 87
4.1 Experimental ... 87
4.1.1 Differential Scanning Calorimetry (DSC) ... 87
4.1.2 Optical microscopy ... 87
4.1.3 Scanning Electron Microscope (SEM) ... 88
4.1.4 Composite manufacturing processes ... 88
4.1.5 Tensile tests ... 88
4.2 PEKK prepregs ... 90
4.3 Impact of carbon fibers on crystallization ... 91
4.3.1 Impact of carbon fibers on crystalline morphologies ... 91
4.3.2 Impact of carbon fibers on crystallization kinetics ... 92
4.4 PEKK COMPOSITE MANUfAcTURING ... 98
4.4.1 Protocol ... 98
4.4.2 Composite plates quality control ... 100
4.4.3 DSC analysis ... 101
4.5 Mechanical properties of PEKK composites ... 101
4.5.1 Unidirectional composites ... 101
4.5.2 ± 45° composites ... 102
4.6 Conclusion ... 106
CONCLUSION AND PROSPECTS ... 109
REFERENCES ... 113
RÉSUMÉ ÉTENDU ... 119
3
INTRODUCTION
INDUSTRIAL CONTEXTThe aeronautic industry uses more and more composite materials to lighten its structures and enhance their performances. This weight saving also allows the aeronautic industry to limit their environmental impact by significantly decreasing aircraft kerosene consuming and consequently decreasing greenhouse gases emissions such as CO2 and NOx. Nowadays,
composite materials constitute more than 50% of the latest generation civil aircraft structure weight (Airbus A350 and Boeing B787).
Fig. 1: Airbus A350 XWB with more than 50% by weight of composite in the structure
Even if most of those composite materials are thermosetting composites, the use of thermoplastic composites is gaining ground due to many benefits. In fact, they have good damage tolerance, they are weldable, recyclable, they are especially suitable for automated fiber placement and they can be consolidated out of autoclave. Those two last features would help to increase the aircraft production rate which is currently a major issue for aircraft manufacturers.
Among those thermoplastics, Poly Aryl Ether Ketone (PAEK) polymer family would be the best candidate as matrix for composite structural parts. Indeed, they have high temperature performances, high chemical and oxidation resistance. The most well-known thermoplastic belonging to the PAEK family is PEEK which is already used as matrix for composite structural parts as for the A400M cockpit floor consolidated out of autoclave and produced by Daher Company. However, this material is still much expensive than epoxy resins and its processing is made difficult by the high melting temperature (around 400°C) leading to high processing times and costs and potential degradation of the matrix during processing.
In this industrial context, new range of high performance thermoplastics PAEK matrices have been recently developed such as Arkema PEKK KEPSTANTM. PEKK are nowadays much
studied in the aircraft industry to compete with PEEK as matrix for composite structural parts. Indeed, for equivalent mechanical performances, PEKK matrices have lower processing temperatures (around 360°C) simplifying the manufacturing of composite parts.
4 OBJECTIVES
The final mechanical performances of composite parts are closely linked to their processing. In fact, depending on the thermal processing cycle, the matrix properties as well as the interaction between the matrix and the carbon fibres are modified. The first composite manufacturing part step is the consolidation associated to the heating of the composite part above the matrix melting temperature to obtain a viscosity decrease of the matrix in order to evacuate all porosities under pressure. As PEKK melting temperature remains above 300°C, the matrix could be modified or degraded during this step and the final mechanical performances of the composite part could be thus potentially altered [1,2]. Secondly, after the consolidation step, the composite part is cooled down to the room temperature. During this step, the matrix may crystallize with different crystallinity ratio and crystalline morphologies depending on the cooling conditions which could also impact the final mechanical performances of the composite part [3–8]. This is why, those phenomena must be understood and controlled to be able to predict and then optimize processing parameters regarding composite parts mechanical performances and processing times.
Fig. 2: Processing thermal cycle of a thermoplastic composite part
In collaboration with the PIMM laboratory of Arts et Métiers ParisTech and the material provider Arkema, Airbus Group Innovations (AGI) aims to explore the capacities of those new high performances thermoplastic PEKK composites for the manufacturing of aeronautical structural parts. To answer to this problematic, the manuscript is divided in four chapters:
This first chapter deals with a bibliographic review on the studied materials in the Phd. The main properties of the tape prepregs used for the composite manufacturing as well as carbon fiber reinforcements and PEKK matrices used in the prepregs are presented.
The second chapter investigates the crystallization kinetics modelling of PEKK matrices and the influence of crystallinity and crystalline morphologies on PEKK matrix mechanical properties.
5 The third chapter focuses on the macromolecular modifications of PEKK matrices at high processing temperatures under nitrogen and their impact on PEKK matrices crystallization and mechanical properties.
The last chapter presents the influence of carbon fibers on crystalline morphologies and crystallization kinetics, the manufacturing of unidirectional and ± 45° PEKK composites under press and autoclave and finally the impact of crystallinity and crystalline morphologies on PEKK composite mechanical properties.
7
CHAPTER I.
MATERIALS
This first chapter deals with a bibliographic review on the studied materials. It is introduced the main properties of the provided tape prepregs used for the composite manufacturing and their impregnation way, the main properties of carbon fibers used for the prepregs manufacturing, the chemical structure of PEKK copolymers matrices, their thermal properties and finally their crystalline behaviors.
I.1 PREPREGS
Composite materials were provided for the project as unidirectional tape prepregs of 50 mm width and 140 µm thick with 60% by volume of carbon fiber and 40% by volume of PEKK matrix.
Caron fibers used for manufacturing unidirectional tape prepregs are high strength non-sized HexTow® AS4 carbon fiber provided by Hexcel. AS4 carbon fibers are continuous high
strength, high strain, PAN based fiber wih 12,000 (12K) filament count tows. Main properties from the product data sheet are listed in Table I.1.
Density
(g.cm-3) Tensile Modulus (GPa) Tensile Strength (MPa) Strain at Break (%)
1.79 231 4,413 1,7
Table I.1 : Properties of Hexcel AS4 12K carbon fibers
Two different tapes were studied, PEKK 6002 and PEKK 7002 prepregs. Data taken from the control certificate of tapes provided by the material supplier are summarized in Table I.2. Details for PEKK matrices are presented in paragraph I.2 respectively. From those data different characteristics were calculated as the matrix mass content which is necessary for the calculation of the crystallinity of the matrix in the prepregs, the matrix and the fiber area weight and the theoretical ply thickness which can give information of the quality of the composite after consolidation. In fact, if the average of the ply thickness in the composite after consolidation is higher than the theoretical value, this could be due to some porosities trapped in the composite, which will be discussed later by microscopic observations.
8 Carbon fibers were impregnated with PEKK by passing them through a bath where PEKK powder is suspended. Carbon fiber tows are then heated up to melt the PEKK polymer and calendared at the dimension of the tape.
Data PEKK 6002 prepregs PEKK 7002 prepregs
Matrix density
(g.cm-3) 1,27 1,29
Fiber density
(g.cm-3) 1,79
Fiber volume content
(%) 60
Prepregs surface mass
(g.m-2) 228,2 230,3
Theoretical calculations
Matrix mass content
(%) 32,11 32,45
Matrix area weight
(g.m-2) 73,29 74,74
Fiber area weight
(g.m-2) 154,95 155,56
Ply thickness
(µm) 144,3 144,8
Table I.2 : Properties of PEKK prepregs tapes
I.2 PEKK MATRICES
I.2.1 PAEK polymer family
PAEK are semi-crystalline thermoplastic polymers made from ether and ketone molecules (Fig. I.2):
Fig. I.2 : Ether a) and ketone b) molecules
With a high glass transition temperature (Table I.4) and a high modulus and strength at yield (Table I.5), PAEK matrices have the best thermo-mechanical properties among existing thermoplastics (Fig. I.3):
9
Fig. I.3 : Classification of thermoplastic polymers as a function of their thermo-mechanical properties [9]
PAEK are different from each other depending on the number of ether and ketone molecules of their monomer (Table I.3):
Structure Name Ketone (%)
PPO 0
PEK 50
PEEK 33
PEKK 67
Table I.3 : Chemical structure of different PAEK with their ratio of ketone entities [10]
The influence of ketone entities on PAEK properties has been studied by different authors [11–14]. They showed that the melting temperature (Tm) and the glass transition temperature
(Tg) increase with the ratio of ketone entities (Fig. I.4). In fact, ketone bonds are less flexible
than ether one which increases the macromolecular chains rigidity and thus Tg. They also
increase the compactness of the crystalline structure which increases the intermolecular energy bonds and thus melting temperature Tm.
10
Fig. I.4 : Evolution of Tg and Tm as a function of the ketone ratio [10]
The PEKK homopolymer has the highest ratio of ketone entities (% Keto=67%) and thus the highest Tg and Tm. Its Tg is very interesting for high temperature applications (below Tg)
however its Tm involves high processing temperatures which could lead to degradation during
composite parts manufacturing. To address this problem, PEKK chemical structure can be modified to decrease its Tm [10].
I.2.2 PEKK copolymers
The PEKK homopolymer is prepared from diphenyl ether (DPE) and terephthalic acid (T) (Fig. I.5.a). Terephthalic acid (T) with para phenyl links can be substituted by isophtaliques acid (I) with meta phenyl links (Fig. I.5.b) and form copolymers constituted with two different isomers, the terephthaloyle (Fig. I.5.a) and the isophthaloyle isomers (Fig. I.5.b). Those isomers can form two different diads, the TT diads compounded by two terephthaloyle isomers (Fig. I.6.a) and the TI diads compounded by one terephthaloyle isomer and one isophthaloyle isomer (Fig. I.6.b). The introduction of isophthaloyle isomers decreases the Tm
(Fig. I.7) which makes PEKK very interesting for composite parts manufacturing.
Fig. I.5 : PEKK terephthaloyle a) and isophthaloyle b) isomers
11
Fig. I.6 : PEKK TT a) and TI b) diads
Fig. I.7 : Evolution of the equilibrium melting temperature Tm0 measured with the Hoffman-Weeks method
and Tg as a function of the terephtaholoyle ratio (T) [10]
The decrease of the Tm is due to meta linkages of isophthaloyle isomers which decreases the
macromolecular chain regularity and thus the compactness of the crystalline phase. As we will see, they also induce lower crystallization kinetics (Fig. I.8) and lower maximum crystallinity ratios. However, it can be noticed that there is no significant impact on Tg which
is a strong advantage.
Fig. I.8 : Plot of isothermal crystallization peak time vs temperature for PEKK copolymers crystallized from the melt [10]
12 Our study focus on PEKK matrices provided by Arkema Company referenced as PEKK 8002, PEKK 7002 and PEKK 6002 with T/I ratios of 80/20, 70/30 and 60/40 respectively. The last digit is linked to the melt volume flow index of the polymer, the more important it is the more the melt volume flow index is important. In our case, the melt volume flow index is equal to 35cm3.10min-1 (ISO 1133). The thermal and mechanical properties of those three
matrices compared to Victrex PEEK 450G are described in Table I.4 and Table I.5.
Grade Ratio T/I T(°C) g T(°C) m
PEKK 8002 80/20 165 358
PEKK 7002 70/30 162 332
PEKK 6002 60/40 160 305
PEEK 450G 143 343
Table I.4 : Thermal properties of PEKK copolymers from Arkema company [15–17] and PEEK 450G from Victrex Company [18]
It can be observed that PEKK 8002 has a higher Tm than PEEK which makes it less
interesting for its processing however it has the highest mechanical properties. PEKK 7002 has a lower Tm than PEEK with similar mechanical properties which makes it a good
candidate as matrix for structural composite part. Finally, PEKK 6002 has the lowest Tm with
about 50°C less than PEEK one which is very interesting for its processing. However, it has lower mechanical properties than the others. It can be added that mechanical tests have been done on injected tensile samples and due to very low crystallization kinetics PEKK 6002 is at a quasi-amorphous state which explains much lower Young modulus and stress at yield compared to PEKK 8002 and 7002 however its strain at break is much more important. At room temperature, PEKK 6002 do not have a brittle behavior which shows that it is tested above its brittle-ductile transition temperature.
Grade Young modulus (GPa) Stress at yield (MPa) Strain at yield (%) Strain at break (%)
PEKK 8002 3.8 105-125 5.2 20-30
PEKK 7002 3.8 70-110 5.2 2-20
PEKK 6002* 2.9 88 5.4 >80
PEEK 450G 3.7 100 5.5. 45
Table I.5 : Mechanical properties of PEKK copolymers from Arkema company [15–17] and PEEK 450G from Victrex Company [18] tested at room temperature (*PEKK 6000 is at the amorphous state compared
13 I.2.3 Crystalline morphology
As the others PAEK, it has been shown in the literature [10,19–21] that PEKK copolymers crystallizes with a two-chain orthorhombic unit cell with the following dimensions: lamellae growing direction a=0.767nm, b=0.606nm and chain axis c=1.008nm [22] (Fig. I.10). This unit cell has been identified from a Cu Kα X-ray diffraction pattern with the (110) peak at 2θ=18.7°, the (111) peak at 2θ=20.6° and the (200) peak at 2θ=22.7° (Fig. I.9). This unit cell will be called “form I” throughout the manuscript.
Fig. I.9 : WAXS measurement for three different PAEK [10]
14 In addition to form I, it has been reported that depending on the crystallization conditions and the T/I ratio PEKK can crystallize with two additional forms called form II and III [22,24–28]. Form II has been identified by Blundell et al. [28] and DuPont and ICI research group [22,24– 27] from X-ray measurements with the apparition of an additional peak (020) at 2θ=16° (Fig. I.11) and indexed by a one or two-chain orthorhombic lattice depending on the authors (Fig. I.12). The ability to form this second crystalline phase is significantly favored for high chain stiffness and low molecular mobility. PEKK copolymers have a high ratio of ketone linkages which increases the stiffness of the molecule and enhances the apparition of form II. More precisely, ketone linkages have high rotational conformation energy barriers which enhance chain stiffness.
Fig. I.11 : X-ray diffraction scans of PEKK 100/0 crystallized at 340°C during 1h from the melting state (a), at 180°C for 1h from the glassy state (b) and crystallized from solvent-induced crystallization (c) [22]
Fig. I.12 : Polymorphism with different crystal unit cells in PEKK : form I (a), form II suggested by Blundell et al. [28] (b) and by Gardner et al. [10,25] (c) [22]
15 The apparition of form II for PEKK is strongly linked to the crystallization conditions and the ratio T/I. A phase diagram proposed by Gardner et al. [25] summarizing the apparition conditions of form I and II is presented in Fig. I.13. Firstly, it can be observed that form II appears for high T/I ratio. In fact, as ketone linkages, terephthaloyle entities have a high chain stiffness favoring the apparition of form II. Secondly, form II apparition seems to be enhanced for solvent crystallization or low mobility crystallization conditions such as cold crystallization which is consistent with Fig. I.11 whereas only form I was observed for crystallization from the melting state corresponding high chain mobility crystallization.
Fig. I.13 : Phase diagram of the two crystalline polymorphism in PEKK as a function of the T/I ratio and the crystallization conditions [25]
In addition to form I and II, an intermediate morphology called form III was reported in the literature by Gardner et al. [10] ,Cheng et al. [22] and Ho et al. [26] with the apparition of the peak (113) at 20° (Fig. I.14) indexed to an orthorhombic unit cell. This subsidiary form was observed for high annealing temperatures and assumed to correspond to a recrystallization process of form II to a more stable form.
Fig. I.14 : X-ray diffraction scans of PEKK 50/50 crystallized at 260°C for 60 min from the melting state before annealing (a) and after annealing at 310°C for 10 min
16 I.2.4 Secondary crystallization
Isothermal crystallization mechanisms of PEKK have been studied by Gardner et al. [10] and Cortés et al. [29]. After annealing, they observed an additional endotherm during the melting which occurs about 10°C above the annealing temperature (Fig. I.15). Such behavior has also been observed for PEEK [20,30,31] and other semi-crystalline polymers as poly(ethyleneterephthalate) [32–34] and is called the double-melting behavior. This additional endotherm is attributed to the melting of a secondary crystallization associated to the growth of an interlamellar crystalline structure within lamellae [35]. This subsidiary crystallization appears after long annealing or slow cooling rates.
Fig. I.15 : DSC heating scans at 10°C.min-1 of PEKK 80/20 crystallized at different temperatures from the melt [10]
17 I.2.5 Nucleation and growth
As for most of thermoplastic polymers, PEKK crystallizes with a spherulitic growth by chain layovers and deposits.
Fig. I.16 : Polarized optical microscopy (a) and TEM (b) observations of PEKK spherolites after isothermal crystallization at 280°C for 30 min [10]
Crystalline lamellae are separated by amorphous zone which includes end of chains, chain segments belonging to two adjacent crystalline lamellae and entangled chain segments. The lamellae thickness depends on the crystallization conditions. It has been shown for PEEK [36] that the motif {crystalline lamellae + amorphous zone} is about 15 nm with a crystalline lamellae thickness of 10 nm corresponding to 7 consecutive crystalline unit cells
18 I.3 CONCLUSION
Tape prepregs used for the composite manufacturing are prepared with 40% by volume of PEKK matrix and 60% by volume of carbon fibers volume. PEKK matrices are copolymers containing isophthaloyle (I) and terephthaloyle isomers (T) with different ratios depending on the copolymer. Three different PEKK are studied, PEKK 8002, PEKK 7002 and PEKK 6002 with T/I ratios of 80\20, 70\30 and 60\40 respectively. They have the same glass transition temperature whereas their melting temperature decreases with the number of isophthaloyle entities until 305°C for PEKK 6002. PEKK matrices crystallize with spherulitic growth and depending on the ratio T/I and the processing thermal conditions they can crystallize with two different crystalline morphologies with different unit cell dimensions. In addition, a secondary crystallization associated to the growth of an interlamellar crystalline structure within lamellae can occur after long annealing or slow cooling rates. Each PEKK copolymer crystallizes differently with different crystallization kinetics and crystallinity. PEKK 6002 crystallizes more slowly than PEKK 7002 and 8002 and has a lower crystallinity.
19
CHAPTER II.
IMPACT OF THERMAL CYCLES ON PEKK
MATRICES MECHANICAL PROPERTIES
In this chapter, we investigated the isothermal and non-isothermal crystallization kinetics modelling of neat PEKK resins. Crystalline structure and morphologies were first identified by X-ray measurements and optical microscopy. A new methodology was developed to identify the parameters of the isothermal crystallization kinetics Hillier model directly from the heat flow measured by DSC. Isothermal Time Transformation Temperature (TTT) diagrams of the crystallinity were built providing a useful tool for PEKK processing. A new non-isothermal crystallization kinetics model established from the derivative of the isothermal crystallization kinetics Hillier model is presented allowing the prediction of the non-isothermal crystallization behavior of neat PEKK. Finally, we studied the impact of crystallinity and crystalline morphologies on the mechanical properties of neat PEKK at room temperature and above the glass transition.
II.1 EXPERIMENTAL
II.1.1 Differential Scanning Calorimetry (DSC)
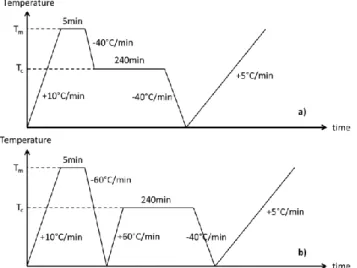
Isothermal and non-isothermal crystallization analyses were carried out on a TA Instruments Q2000 on granules of about 7-8 mg. For cold and melt crystallization, all specimens were first heated at 10°C.min-1 from room temperature to 360°C for PEKK 6002, 380°C for PEKK
7002 and 400°C for PEKK 8002 during 5 minutes (Tm in Fig. II.1). Those temperatures are
above PEKK equilibrium melting temperatures [10] to erase the thermal history.
For isothermal crystallization from the melt, specimens were then cooled at 40°C.min-1 to
annealing temperatures (Tc in Fig. II.1). Annealing temperatures were maintained during 240
minutes and specimens were finally cooled to room temperature at 40°C.min-1. For
isothermal cold crystallization, the polymer is cooled from the melt at 60°C.min-1 to room
temperature and then heated at 60°C.min-1 to the isothermal temperature which was
maintained during 240 minutes. Finally, specimens were cooled at 40°C.min-1 to room
temperature. The chosen cooling and heating rates were high enough to make sure that the polymer does not crystallizes before annealing and the annealing time was long enough to allow the polymer to fully crystallize.
20 For non-isothermal crystallization, specimens were cooled at cooling rates between 1°C/min to 30°C/min to room temperature.
For all specimens, a heat scan at 10°C.min-1 to 400°C was carried out after crystallization to
measure the glass transition, the melting temperature and the melting enthalpy induced by the crystallization cycle.
II.1.2 Wide angle X-ray diffraction
The X-ray data were collected by performing wide angle X-ray scattering (WAXS) patterns at room temperature on samples with a thickness of 2mm thanks to the SAXS/WAXS system from Xenocs. The apparatus consists of an X-ray source using a Cu-Kanode radiation with
a wavelength of a 1.54 Å delivering a parallel beam. The X-ray patterns were recorded with a MAR300 2D detector piloted with the MAR300 software. The sample to detector distance was 168 mm. Silver behenate standard reference material was used for sample-to-detector distance calibration. The exposure time was 15h. The 2D patterns were treated using Fit2D software developed by the European Synchrotron (ESRF). The 2D X-ray diffraction patterns were integrated along the azimuthal direction from isotropic samples.
II.1.3 Optical microscopy
The optical microscope used was a polarizing Nikon Eclipse LV100 model equipped with a Nikon DS Digital Sight DS-Fi1 camera and a hot stage Linkam LTS-420. Observations were carried out with an ocular lens of 30x on PEKK film with a thickness of 5 µm prepared with a Leica RM-2235 microtom. Films were first heated at 10°C.min-1 from room temperature to
360°C during 5 minutes to erase the thermal history of the specimen and then cooled down at 40°C.min-1 to 270°C. The annealing temperature of 270°C was maintained during two
hours and corresponds to a low supercooling i.e. to a low nucleation rate allowing the formation of large spherulites.
II.1.4 Mechanical tests II.1.4.1 Tensile tests
Mechanical tests were carried out with a tensile test machine Instron 5966 equipped with a laser extensometer and an oven to make tests at high temperature. Tests were done on normalized 1BA tensile samples (ISO 527) with length of 75 mm, width of 5 mm for the fitting length and a thickness of 2 mm machined from amorphous plates of 100x100x2 mm3
crystallized in an oven (Fig. II.5). Plates were first dried at 120°C during 48h and crystallized from the glassy state at 200°C, 230°C and 260°C (Tc) (Fig. II.2.b.) and from the melting state
(360°C during 5 minutes) at 260°C during different times to obtain different crystallinities (Fig. II.2.b.). For PEKK 8002 and 7002 only amorphous or fully crystallized from the glassy state plates could be compared due to their fast crystallization rates (Fig. II.2.b.).
21
Fig. II.2 : Isothermal melt (a) and cold (b) crystallization thermal cycles for PEKK crystallization plates
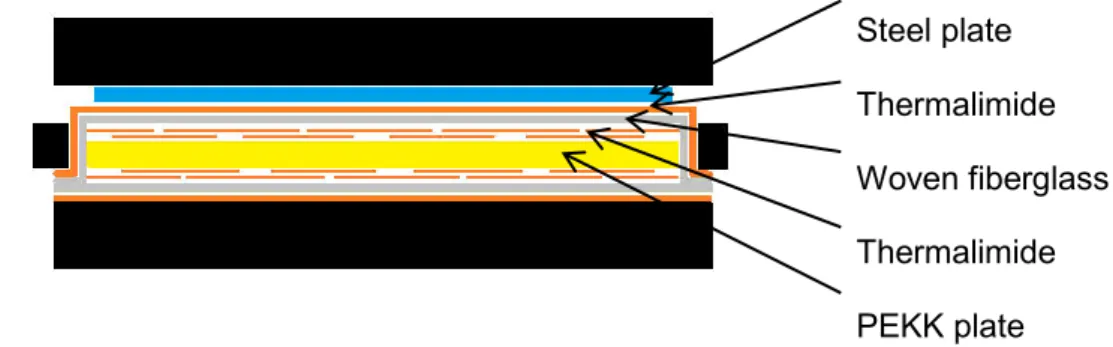
A casing was used during the crystallization to keep the plat flat with the same dimensions (Fig. II.3). Plates were put between Teflon films for crystallization from the glassy state and a more complex environment described in Fig. II.4 was carried out for crystallization from the melt due to a problem of bubbles apparition on the surface of plates. More precisely, superposition of thermalimide strips and woven fiber glass of 300 g.m-2 has shown good
results to evacuate bubbles on the surface of plates. After crystallization, DSC scans from room temperature to 400°C at 5°C.min-1 were carried out on pieces cut from the crystallized
plates to measure the crystallinity. Specimens were tested at room temperature and 180°C (above Tg) with testing speed of 1 mm.min-1 and 100 mm.min-1 that is 0.033 s-1 and 3.3 s-1
respectively. At 180°C, PEKK matrices are at the rubbery state and the testing speed must be high enough to measure entanglements network properties and not chain flow due to disentanglement. At this temperature, the crystallization kinetics is low enough to assume that the polymer do not crystallize during the test.
22
Fig. II.3 : Casing for the PEKK plates crystallization
Steel plate Thermalimide Woven fiberglass Thermalimide PEKK plate
Fig. II.4 : PEKK plates environment for crystallization from the melt
Fig. II.5 : PEKK plate crystallized with the machined 1BA tensile samples
II.1.4.2 Dynamic Mechanical Analysis (DMA)
A DMA Q800 of TA Instruments has been used to characterize the viscoelastic behavior of PEKK. The bending mode chosen was a “Single Cantilever” mode which is the most relevant mode for rubbery state polymers and thermoplastics (AITM 1-0003). The calibration of both clamps has been made with a standard sample of steel 17.5 x 12.77 mm² with a thickness of 3.16 mm. For every sample, the working length was 17.5 mm corresponding to the distance between the two clamps. The atmosphere was the room air. DMA tests were done on rectangular samples with length of 50 mm, width of 10 mm and thickness of 2 mm machined from fully crystallized plates at 230°C from the glassy state with the protocol describe in the previous paragraph. Fully crystallized samples were tested from 40°C to 300°C with a
23 heating rate of 3°C/min which is low enough to consider the thermal inertia of the material negligible. A strain of 0.5% at a frequency of 1 Hz were determined to stay in the linear viscoelastic domain and to consider that dynamical mechanical properties do not depend on strain.
II.2 CRYSTRALLINE MORPHOLOGIES II.2.1 Crystalline structure
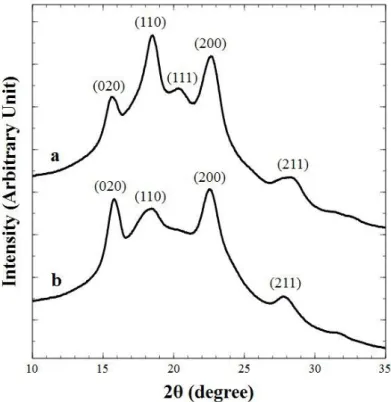
WAXS measurements have been carried out on a PEKK 6002 sample crystallized from the melt and from the glassy state at 230°C during 2 hours (Fig. II.6). It has been observed for crystallization from the melting state a diffraction pattern with the (110) peak at 2θ=18.7°, the (111) peak at 2θ=20.6° and the (200) peak at 2θ=22.7°. This pattern is similar to the other PAEK and is attributed the crystalline morphology form I presented in paragraph I.2.3. An additional pattern with the (020) peak at 2θ=16° has been observed for both crystallization conditions which corresponds to form II reported in paragraph I.2.3. For PEKK 6002 crystallized from the glassy state, a more important (020) peak has been observed compared to crystallization from the melting state and the (111) peak is non-existent. This is consistent with the fact that cold crystallization induces low chain mobility enhancing the growth of the form II. The disappearing of the (111) peak highlights that PEKK 6002 crystallized from the glassy state presents only pure form II.
Fig. II.6 : X-ray diffraction scans of neat PEKK 6002 crystallized at 230°C during 2h from the melting state (a) and from the glassy state (b)
II.2.2 Nucleation and growth
Fig. II.7 shows the crystal growth of a PEKK 6002 sample crystallized from the melt at 270°C during 20 minutes (Fig. II.7.a), 30 minutes (Fig. II.7.b) and 40 minutes (Fig. II.7.c). Radial growths of crystalline entities similar to spherulites were observed. During the first step of crystallization, the crystalline entities grow independently to each other with the same size
24 until impingement which is typical to an instantaneous nucleation. The initial number of potential nuclei N0 has been calculated and is equal to about 0.0014 µm-3. It is equal to the
number of nuclei at the early beginning of the crystallization divided by the volume containing the nuclei which have been both measured with an image processing program. At the end of the crystallization process, the crystalline entities diameters have been measured from 18µm to 33µm.
Fig. II.7 : Micrographs of PEKK 6002 crystallized from the melt at 270°C during 20min (a), 30min (b) and 40min (c)
The evolution of the radius of a spherulite during the crystallization process as a function of time at 270°C from the melting state has been followed in Fig. II.8. In order to better assess the crystalline growth rate, the followed spherulite has been chosen to be the most far as possible from the others to collect enough data before impingement. Three different steps
25 can be observed during the crystallization process. The first step is related to the crystallization initiation where the spherulite studied was first observed after 8 minutes of crystallization with a radius of 2 µm. This time depends on the device resolution. After this initiation step, the spherulite grows constantly until it impinges on another spherulite. The growth rate G is independent of the size of the spherulite and calculated from the slope of the line by G=dR/dt. The growth rate of spherulites at 270°C from the melt has been measured of about 0.2µm.min-1. At the end of the crystallization growth, the radius has been observed of
about 16.5µm. Those results will be compared later with the following DSC study.
Fig. II.8 : Spherulite radius vs time during crystallization at 270°C from the melting state
II.3 CRYSTALLIZATION KINETICS
II.3.1 Crystallization kinetic comparison
In a first approach, PEKK 8002, 7002 and 6002 matrices were cooled from the melt at three different cooling rates (1°C.min-1, 5°C.min-1 and 10°C.min-1) to compare their crystallization
kinetics. For each cooling condition, the melting enthalpy was measured by DSC during a heat scan at 5°C.min-1 after crystallization and the crystallinity (X
c) was calculated with
Equation II.1: % 100
H
H
H
X
c m cc
Equation II.1with ΔHm the melting enthalpy (J.g-1), ΔHcc the cold crystallization enthalpy (J.g-1) and ΔH100%
the fully crystallized polymer enthalpy which was taken the same as for PEEK equal to 130 J.g-1 [20]. Results are presented in Table II.1. DSC heating scans at 5°C.min-1 of PEKK 8002,
26
Fig. II.9 : DSC heating scans at 5°C.min-1 of PEKK 8002, 7002 and 6002 cooled from the melt at 10°C.min-1
It can be observed in Fig. II.9 that PEKK 8002 crystallizes more than PEKK 7002 with melting enthalpies of 51 J.g-1 and 41 J.g-1 respectively. A cold crystallization peak appears for
PEKK 6002 scan with an enthalpy of 9 J.g-1 closed to the melting enthalpy equal to 11 J.g-1.
This shows that PEKK 6002 hardly crystallizes for a cooling rate of 10°C.min-1 from the melt
due to a low crystallization kinetics. Additional endothermic peaks were noticed at around 300°C and 260°C for PEKK 8002 and 7002 respectively which are associated to the melting of a secondary crystallization (see CHAPTER I).
Grade Xc (%) at
V=10°C.min-1 V=5°C.minXc (%) at -1 V=1°C.minXc (%) at -1
PEKK 8002 39 39 40
PEKK 7002 31 32 33
PEKK 6002 2 14 28
Table II.1 : Crystallinity Xc (%) vs cooling rate for PEKK crystallized from the melt
In Table II.1, we can observe that PEKK 8002 and 7002 crystallinities are quasi-independent of the cooling rate between 1°C/min and 10°C/min showing a high crystallization rate. On the contrary, the final crystallinity of PEKK 6002 is very sensitive to the cooling rate. In fact, its crystallinity drops down with the increase of the cooling rate until almost not crystallizing at 10°C/min (see Fig. II.9). Thus, PEKK 6002 matrix may not fully crystallize during the composite processing which could be a problem because we can assume that mechanical properties are linked to the crystallinity. It is thus essential to be able to predict crystallization depending on the thermal cycle.
27 II.3.2 Isothermal crystallization kinetics
II.3.2.1 Modified Hillier model
The isothermal crystallization kinetics of PEKK was already studied by Gardner et al. [10] with a peak-time method (time for which the crystallization exothermic peak is maximum) but they did not use a crystallization kinetic model taking into account the secondary crystallization (see CHAPTER I). This subsidiary crystallization makes the crystallization kinetics modeling more difficult.
Different isothermal crystallization models have been developed to incorporate the secondary crystallization, the most relevant reported are the Velisaris Seferis [37] and the Hillier models [35]. The former postulates that two Avrami type crystallization processes [38] occur in parallel independently whereas the second assumes that a primary Avrami type crystallization process occurs followed by a first order crystallization process which grows from the primary crystallization. Hsiao et al. [39] investigated the isothermal crystallization kinetics of a PEKK 70/30 with a modified Hillier model which postulates that the secondary crystallization is not necessarily a first order process and compared it to the Velisaris Seferis model. They concluded that the modified Hillier model has a better physical meaning than the Velisaris Seferis one because it is more suitable to describe the growth of a second crystalline structure within lamellae. In this modified Hillier model, the primary crystallization is expressed by an Avrami equation:
1
1 11
exp
nt
K
t
Equation II.2where α1(t) is the relative volume fraction crystallinity at time t, K1is the crystallization rate
constant depending on the annealing temperature and n1the Avrami exponent depending on
the nucleation and the growth geometry, for the first mechanism.
The secondary crystallization process which occurs once a volume element has been included in the lamellae at time θ is expressed in the modified Hillier model by an Avrami equation:
t
t
d
d
d
t
0 2 1 2
Equation II.3where α2(t) is the relative volume fraction crystallinity at time t, K2is the crystallization rate
constant depending on the annealing temperature and n2the Avrami exponent depending on
the nucleation and the growth geometry, for the second mechanism. The Avrami exponent n2
is not necessarily equal to 1 according to Hsiao et al. [39]. The total crystallinity at time t arising from those two consecutive crystallization processes is equal to:
t
w
1
1
t
w
2
2
t
Equation II.4where w1 and w2 are the weight factor between the primary and the secondary crystallization
with w1+w2=1, indicating that the relative crystallinity at infinite time is unity which
corresponds to the Avrami model hypotheses [38]. Values of weight factors provide the relative importance between both crystallizations. Consequently, From Equation II.2,Equation
28 II.3 and Equation II.4, total crystallinity at time t can be expressed by the modified Hillier model:
1
1 11
exp
nt
K
w
t
t n n nd
t
K
t
K
n
K
w
0 2 1 1 2 2 2 2 2 1exp
exp
1
Equation II.5It can be noticed that Equation II.5 differs from Hsiao et al. [39] model which could be due to a misprint in their article for the derivative of the secondary crystallization in Equation II.3. If n2=1, then the simplified Equation II.5 gives the Hillier model:
1
1 11
exp
nt
K
w
t
t nd
t
K
K
K
w
0 2 1 2 21
exp
exp
1
Equation II.6II.3.2.2 DSC thermogram analysis
Isothermal DSC scans of PEKK 6002 samples at 200°C and 230°C cooled at 40°C.min-1
from the melt are reported in Fig. II.10. It can be witnessed that the beginning of the crystallization exothermic peaks are truncated corresponding to a gap between the beginning of the crystallization peak and the baseline (double arrow in Fig. II.10). This phenomenon has been observed by different authors [39,40] and was attributed to the instrumental thermal inertia switching from the cooling to the isothermal step. It can be observed that this gap is more important for isothermal at 230°C than 200°C due to higher crystallization kinetics at 230°C.
Fig. II.10 : DSC thermograms of neat PEKK 6002 crystallized from the melt during isothermal crystallization at 230°C (solid line) and 200°C (dashed line)
29 The absence of the crystallization peak beginning involves a problem to determine the evolution of the relative volume crystallinity because it is calculated from the area above the heat flow curve with Equation II.7:
dt
t
Q
t
Q
t
t t
0 0)
(
)
(
Equation II.7Where Q(t) is the heat flow measured at time t and t∞ is the time when the polymer is fully
crystallized. It was thus necessary to extrapolate the beginning of the crystallization peak until the baseline to take into account the overall crystallization process. Two different approaches have been investigated to rebuild the crystallization peak.
II.3.2.3 First approach: modified Hillier model fitting on the relative crystallinity
The first approach was to extrapolate the beginning of the crystallization peak by a linear curve (dashed line in Fig. II.11) until the base line.
Fig. II.11 : DSC thermograms of PEKK 6002 crystallized from the melt during isothermal crystallization at 230°C with the linear extrapolation of the crystallization peak beginning (dashed line) with the
crystallization induction time ti (dotted line)
In this case, a delay can be detected between the beginning of the extrapolated crystallization peak and the isothermal scan. This delay has also been observed for other polymers with low crystallization kinetics and modelled as a crystallization induction time (ti)
[33,41]. It would correspond to the time to reach a steady state of nucleation i.e. the time to reach enough critical nuclei in the bulk to initiate crystallization. Indeed, the increase in number of critical nuclei which leads into the steady state linear would be initially slow [42]. In this work, the induction time ti has been defined by the intersection of the baseline and the
extrapolation line of the crystallization peak beginning (Fig. II.11).
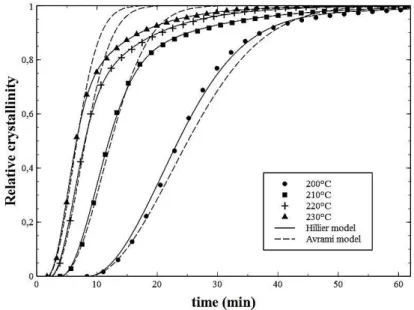
For each isothermal crystallization, the relative crystallinity α(t) has been calculated with Equation II.7 (Fig. II.12) and its double logarithm has been plotted in Fig. II.13. Straight line trends have been observed for the double logarithm plot in Fig. II.13 during the beginning of
30 the crystallization which is consistent with the Avrami theory. For every crystallization, the slopes of the lines corresponding to the Avrami exponent have been measured of about 2.05±0.01 (dashed lines in Fig. II.13). The corresponding Avrami model (Equation II.2) has been plotted in Fig. II.12 (dashed lines) with an Avrami exponent n1 fixed by 2. It can be
observed that the Avrami model fits well with experiments for relative crystallinity below 0.6. According to the Avrami theory, a value of 2 for the Avrami exponent would be associated either to a two dimensional crystallization growth with an instantaneous nucleation or to a one dimensional crystallization growth with a sporadic nucleation. Since the microscopic study has shown previously that the nucleation process is instantaneous (Fig. II.7), it can be assumed that the first crystallization mechanism would be a two dimensional disk-like crystallization. However, this assumption does not seem to be consistent with the microscopic observations where growing crystalline entities behave like spherulites.
Fig. II.12 : Relative crystallinity α(t) vs time, the Avrami model (dashed curves) and the modified Hillier model (solid curves) plots for PEKK 6002 isothermal crystallization from the melt
Fig. II.13 : Double logarithm vs ln(time), the Avrami model (dashed curves) and the modified Hillier model (solid curves) plots for PEKK 6002 isothermal crystallization from the melt
31 For values of relative crystallinity above 0.6, crystallization kinetics become slower than the Avrami model which corresponds to a bending of the double logarithm plots in Fig. II.13. This phenomenon is typical of the formation of a secondary crystallization process within the primary crystallization with a slower crystallization kinetics [37,39]. The modified Hillier model previously presented (Equation II.5) has been used to take into account this secondary crystallization and fit with experiments during the overall crystallization process. The best fit of the modified Hillier model determined with a multi linear regression fitting has been found for a secondary crystallization Avrami exponent n2=1. It is associated to a one dimensional
crystallization growth with an instantaneous nucleation. This value is the same as reported by Hillier for polymethylene [35] and attributed to a first-order crystallization law within the crystalline lamellae. Consequently, the used crystallization kinetics model corresponds to the Hillier model presented in Equation II.6.
To conclude, this first approach gives good results regarding the fitting of the modified Hillier model with experiments [43]. However the value of 2 found for the primary crystallization Avrami exponent seems not to be consistent with microscopic observations. This could be due to the linear extrapolation of the crystallization peak beginning.
II.3.2.4 Second approach: Derivative Hillier model fitting on the heat flow Due to inconsistent results regarding the primary crystallization Avrami exponent presented in paragraph II.3.2.3 another approach has been investigated to extrapolate the crystallization peak beginning. Instead of fitting the Hillier model with the relative crystallinity calculated from the extrapolated crystallization peak by a straight line, this approach consists of fitting directly the Hillier model with the heat flow measured by DSC. In fact by deriving Equation II.7, it can be written:
m c t o
H
t
Q
H
t
Q
dt
t
Q
t
Q
dt
d
)
(
)
(
)
(
)
(
Equation II.8where ΔHc isthe crystallization enthalpy and ΔHm is the melting enthalpy after crystallization.
According to Equation II.4, the derivative of the Hillier model can be expressed by:
dt
d
w
dt
d
w
dt
d
2 2 1 1
Equation II.9where the derivative of the primary and the secondary crystallization kinetics equations (Equation II.2 and Equation II.3 respectively) can be expressed by:
)
exp(
1 1 1 1 1 1 1 n nt
K
t
n
K
dt
d
Equation II.10
1
exp(
)
0
2 1 1 2 2 1 2 nK
n
K
t
ndt
d
Equation II.11
K
K
t
n
t
K
n
t
d
n
K
t n n n n
0 2 2 2 2 2 2 2 1 2 2 2 2 2 1)
exp
(
)
1
exp(
1
32 It can be observed that for time close to 0, the derivative of the primary crystallization kinetics equation (Equation II.10) becomes:
1 1 1 1
n1t
n
K
dt
d
Equation II.12In this case, if n1 is equal to 2, the expression of the derivative of the primary crystallization
corresponds to the equation of a linear curve with a slope equal to K1n1. This observation is
very interesting because if we assume that only primary crystallization occurs during the beginning of the crystallization, this explains the value of 2 of the Avrami exponent for the primary crystallization found in the first approach where the crystallization peak beginning was extrapolated by a linear curve.
According to the microscopic observations, the primary crystallization Avrami exponents n1
has been fixed with a value of 3 corresponding to a three dimensional growth with an instantaneous nucleation [38]. As for the first approach, the best fit of the derivative Hillier model determined with a multi linear regression fitting has been found for a secondary crystallization Avrami exponent n2=1. Thus, by simplifying with n2=1, the derivative of the
secondary crystallization kinetic equation (Equation II.11) becomes:
d
t
K
K
K
t
K
K
dt
d
n t n
0 2 1 2 2 1 22
1
exp(
1)
1
exp
(
1)
exp
(
)
Equation II.13The fitting of the derivative Hillier model (Equation II.9) with the heat flow measured by DSC divided by the melting enthalpy ΔHm (Equation II.8) for isothermal crystallization at 230°C and
200°C are presented in Fig. II.14. Heat flows for the primary crystallization (Equation II.10) and secondary crystallization mechanisms (Equation II.13) determined from the derivative Hillier model fitting have also been plotted. It can be noticed that no induction times were found for this approach compared to the first one assuming that the crystallization process begins at the same time as the isothermal scan.
33
Fig. II.14 : DSC thermograms of neat PEKK 6002 crystallized from the melt at 230°C (a) and 200°C (b) with the fitting of the derivative Hillier model (solid line) and the primary (dash curves) and secondary
crystallization (dash-dot curves) modeling
We can observe that the model fits well with the heat flow and allows building the beginning of the crystallization peak truncated by the DSC. The beginning of the model fitting is cofounded with primary crystallization plot which shows that the early beginning of the crystallization process corresponds only to the growth of the primary crystallization. It is then followed by the growth of the secondary crystallization related to the enhancement of the first crystallization stage.
II.3.2.5 Hillier parameter modelling
Following the general approach reported in literature for nucleation and crystallization growth, crystallization rate constants (K1 and K2)can be expressed as a function of the initial
number of potential nuclei (N0) and the crystal growth rate (G) depending on the
dimensionality of crystallization and the nucleation mode. For the primary crystallization which has been shown to have a three dimensional crystallization growth with an instantaneous nucleation, the crystallization rate constant can be written:
3 1 01 1
3
4
G
N
K
Equation II.14with N01 the initial number of potential nuclei and G1 the crystallization growth rate for the
primary crystallization.
For the secondary crystallization which has been shown to have a one dimensional crystallization growth with an instantaneous nucleation, the crystallization rate constant can be written:
2 02
2
N
G
K
Equation II.15with N02 the initial number of potential nuclei and G2 the crystallization growth rate for the
34 According to the Hoffmann and Lauritzen theory [44–46], the crystal growth can be expressed by:
T
T
f
K
T
T
R
U
G
T
G
i(
)
iexp
exp
gi * 0 Equation II.16where G0i is a pre-exponential factor independent of the temperature. The first exponential
term contains the contribution of the diffusion process to the growth rate, where U* is the
activation energy of the molecular transferring through the melt crystal interface, T∞ is the
temperature below which diffusion stops (T∞=Tg-30K) with Tg=155°C and R is the gas
constant.
The second exponential term is the contribution of the nucleation process, where Kgi is the
activation energy of nucleation for a crystal with a critical size, ΔT is the degree of supercooling (ΔT=Tm0-T) with Tm0 the equilibrium melting temperature and f is a correction
coefficient for the temperature dependence of the melting enthalpy (f=2T/(Tm0+T)). The index i for Gi, G0i and Kgi is equal to 1 for primary crystallization and 2 for secondary crystallization.
Finally, the primary crystallization rate constant can be written:
T
T
f
K
T
T
R
U
K
T
K
g1 * 01 13
exp
3
exp
)
(
Equation II.17And the secondary crystallization rate constant can be written:
T
T
f
K
T
T
R
U
K
T
K
g 2 * 022
(
)
exp
exp
Equation II.18with the pre-exponential factors 3
01 01 01
3
4
G
N
K
and.K
02
N
02G
02 independent oftemperature. Regarding the evolution of the primary crystallization weight factor w1 with the
crystallization temperature (Fig. II.16), it was chosen to model w1 by a linear equation:
1 11
T
a
T
b
w
Equation II.19where a1 and b1 are two constants independent of the temperature.
II.3.2.6 Comparison of crystallization kinetics between cold and melt crystallization
The logarithm of K1 and K2 determined from the derivative Hillier model fitting have been
plotted in Fig. II.15 and fitted with the Hoffman and Lauritzen model (respectively Equation II.17 and Equation II.18) for crystallization from the melt and cold crystallization of neat resin samples. Results for K0i, Kgi and U* are presented in Table II.2. As expected, we observed
that both plots have typical bell shapes regarding the Hoffman and Lauritzen growth theory [45]. Crystallization kinetics are the most important around 240°C and very low close to the Tg and Tm corresponding to low diffusion and nucleation kinetics respectively. Interestingly, it
appears that crystallization rate constants for cold crystallization are slightly higher than those for crystallization from the melt. We attributed that to a lower final degree of crystallinity
![Fig. I.3 : Classification of thermoplastic polymers as a function of their thermo-mechanical properties [9]](https://thumb-eu.123doks.com/thumbv2/123doknet/2961946.81543/16.892.188.697.108.432/fig-classification-thermoplastic-polymers-function-thermo-mechanical-properties.webp)
![Fig. I.15 : DSC heating scans at 10°C.min -1 of PEKK 80/20 crystallized at different temperatures from the melt [10]](https://thumb-eu.123doks.com/thumbv2/123doknet/2961946.81543/23.892.265.619.340.833/fig-dsc-heating-scans-pekk-crystallized-different-temperatures.webp)