All rights reserved
Seasonally and Malaria in a West African Village: Does High Parasite
Density Predict Fever Incidence?
Paul Bouvier,1 Andre Rougemont,1 Norman Breslow,12 Ogobara Doumbo,3 Veronique Delley,1 Allassane Dicko,3 Mahamadou Diakite,3 Anne Mauris,1 and Claude-Francois Robert1
In this cohort study, the authors studied the effect of blood malaria parasite density on fever incidence in children in an endemic area with 9 days' follow-up of 1- to 12-year-old children during two time periods: the end of the dry season (May 1993: n = 783) and the end of the rainy season (October 1993: n = 841) in Bougoula, West Africa (region of Sikasso, Mali). The cumulative incidence of fever (temperature >38.0°C) was 2.0% in the dry season and 8.2% in the rainy season (p < 0.0001). In the rainy season, the risk of fever was increased in children of ages 1-3 years (relative risk (RR) = 2.5, 95% confidence interval (Cl) 1.6-4.1); in those with an initial parasitemia >15,000/fJ (RR = 2.7, 95% Cl 1.4-5.4); in children with an enlarged spleen (RR = 2.0, 95% Cl 1.2-3.3); or in those with anemia (hematocrit <30%: RR = 1.8, 95% Cl 1.1-2.9). In the dry season, anemia was the only predictor of fever incidence. In the rainy season, the best predictors of fever were, in order, age (<4 years), enlarged spleen, and high parasite density. Even in the higher risk groups, the cumulative incidence was <20%. The authors conclude that most children with high parasite density do not develop fever subsequently. The association between parasite density and fever varies according to age and season. Since even high levels of parasite density do not reliably predict fever incidence, parasite density should be considered as just one of a group of indicators that increase the probability of a fever of malarial origin. Am J Epidemiol 1997; 145:850-7.
anemia; child; epidemiologic factors; fever; malaria; preventive medicine; prospective studies; splenomegaly
Malaria is a major cause of illness and death in children in many parts of the world. The crucial ques-tion of exactly what constitutes a malarial attack, how-ever, especially in hyperendemic areas, is still chal-lenging both clinicians and epidemiologists (1, 2). In recent years, a common approach defined a malarial attack as the conjunction of fever—or other symp-toms—with a parasite count greater than a given cutoff level (3, 4). Although limited for diagnosis in individ-uals, this approach has been expanded successfully to estimate the proportion of cases of disease attributable to malaria in populations (5-8). These approaches all
Received for publication July 29, 1996, and accepted for publi-cation December 5, 1996.
Abbreviations: Cl, confidence interval; OR, odds ratio; RR, rela-tive risk.
1 Institute of Social and Preventive Medicine, University of Ge-neva, Switzerland.
2 Department of Biostatisttes, School of Public Health and Com-munity Medicine, University of Washington at Seattle, Seattle, WA. 3 Department of Epidemiology of Parasitic Diseases, National School of Medicine and Pharmacy, Bamako, Mali.
Reprint requests to Dr. Paul Bouvier, Institute of Social and Preventive Medicine, Centre Medical Universitaire, 1 rue Michel-Servet, CH 1211 Geneve 4, Switzerland.
rely on the idea of a direct relation between para-sitemia and malarial disease (3, 9, 10). Although the probability of a fever of malarial origin appears to increase with the parasite count, the magnitude and the time course of this relation remain unclear.
In hyperendemic areas, the absence of detectable parasites on thick smears probably reflects the Limita-tions of technique more than the absence of parasites. In community surveys, parasite densities greater than the so-called "pyrogenic threshold" (3, 10) are found in children presenting no symptoms. Although some authors believe that these children invariably develop symptoms in the following hours or days (11, 12), there is no clear evidence for this assumption. How-ever, children with fever but no detectable parasites in their blood are generally considered not to have suf-fered an acute malaria attack, although there are de-scriptions of cases of cerebral malaria without detect-able peripheral parasites (13).
In short, the role of the parasite count as a predictor of a malaria attack in hyperendemic areas has not been adequately investigated. The study reported herein aimed to answer the following questions:
1. How is the parasitemia in apparently well, afe-brile children related to the incidence of fever in the next 9 days?
2. What is the time course of the onset of fever in relation to parasitemia?
3. Among the factors season, age, enlarged spleen, and parasite density, what are the best predictors of fever incidence?
MATERIALS AND METHODS Setting
This study was carried out in Bougoula, a rural village with a population of 3,200, situated 10 km east of Sikasso, the capital of the third administrative re-gion of the Mali Republic. It is situated at a latitude of 11°21N, i n a relatively moist band of savanna. The rainy season lasts 6 months from May to October, with an average annual rainfall of 1,100 mm, most of which (75 percent) falls between July and September.
The pattern of malaria transmission is typical of the savanna ecological zone (14). According to a study (15) conducted between June 1992 and September 1993 in Pimperena, 15 km north of Sikasso, transmis-sion is intense between July and November. Virtually no transmission occurs from December to June. The main vectors of malaria are from the Anopheles gam-biae si complex (about 95 percent A. gamgam-biae ss and 5 percent Anopheles arabiensis).
Most inhabitants belong to the Senoufo population, which maintains a traditional rural life style. Access to health services is limited. A nurse and two auxiliaries who worked in the village health center provided basic health care, including immunizations, prenatal care, and maternity care.
Methods
The study was conducted during two time periods: in early May 1993 at the end of the dry season, the time of lowest malaria transmission, and at the end of October during the peak transmission period (15-17). On each occasion, the same procedures were applied. During the 2 weeks that preceded the study, a census of the village was taken and all children aged 1-12 years were invited to participate. On the first study day (day 0), all children were examined in the morning at the health center, and their temperatures were re-corded. Clinical examination included palpation of the spleen, graded according to the classification of Hackert (18). A finger prick blood sample was taken for the preparation of a thick smear for malaria para-sitology and for estimation of the hematocrit.
During the following 9 days (days 1-9), a time period corresponding to approximately three life
cy-cles of Plasmodium falciparum, fever occurrence was assessed. Each family was visited early in the morning to ascertain the child's condition during the preceding night and on that morning. Those found to have fever or other illness were brought to the health center. In addition, parents, child care providers, and school teachers were instructed to bring to the health center any child who complained of fever or other illness at any time during the day. A clinical examination was then performed by a qualified pediatrician. Standard-ized protocols of the World Health Organization and United Nations International Children's Emergency Fund Sick Child Charts (Geneva, 1993) were followed for diagnosis and treatment of the most common con-ditions. Antibiotics were given when indicated, essen-tially in cases of pneumonia or otitis media, avoiding cotrimoxazole and other drugs that could interfere with malaria (19). Cases of fever with no obvious source of infection were considered to be of possible malarial origin. In the absence of any serious mani-festation, these children were examined daily, treated symptomatically with paracetamol, and given malaria treatment at the end of the follow-up.
Temperature was taken by an examiner using elec-tronic digital thermometers (Terumo, Somerset, New Jersey). It was taken orally, except for infants younger than 24 months for whom the rectal site was preferred. Compared with axillary or rectal measurements, oral temperature has been shown to be more accurate and precise in children (20). Fever was defined as a tem-perature exceeding 38.0°C. Hematocrit was measured immediately (Hettich centrifugator model 2010, D-7200 Tuttingen, Germany). Anemia was defined as an hematocrit <30 percent, corresponding to moderate to severe anemia according to World Health Organi-zation criteria (21). The quantitative determination of the parasite count was performed by a single team at the Laboratory of Epidemiology of Parasitic Diseases of the National School of Medicine in Bamako, Mali. Estimation of the parasite/leukocyte ratio was based on the observation of 300 leukocytes in each thick-blood film, and the parasite count was calculated on the basis of an average leukocyte concentration of
7,500//J1.
STATISTICAL ANALYSES
For regression analyses, the parasite count was transformed by adding 10 and then taking the base 10 logarithm. A value of 1 thus corresponded to a zero count, whereas 5 represented a count of 100,000 par-asites per microliter. The geometric mean of parasite densities was calculated by back transformation of the mean of these transformed values. The parasite rate was defined as the proportion of children with
para-sites detected in their blood and the spleen rate, as the proportion with an enlarged spleen (18). Age grouping was made following a slight modification of World Health Organization recommendations (18) in order to have four homogenous 3-year groups (1-3, 4 - 6 , 7-9, and 10-12 years).
The chi-square test was used for comparisons of rates and proportions within each season. Compari-sons between the two seaCompari-sons were evaluated using McNemar's (22) matched pair test to account for the fact that most children participated in both surveys. Interactions between season and age on fever preva-lence and other proportions were studied using condi-tional logistic regression, for the same reason (23).
The cumulative incidence of new cases of fever was estimated as a function of the study day by the Kaplan-Meier method (24). The proportional hazards model of Cox (25) was used to analyze the association between fever incidence and the baseline variables sex, age, spleen enlargement, and parasitemia.
The association of fever and parasitemia was also analyzed using nonparametric logistic regression with a spline smoother (26, 27). Predictors of fever were further identified both by stepwise logistic regression and using the classification tree (CART nonparametric multivariate regression) of Breiman and colleagues (28). This latter method searches for specific combi-nations of predictors that lead to high or low fever incidence (29). Cross-validation was used to find the tree that provided the best prediction. Two series of classification trees were generated. The first was in-tended to best describe the data and included all the available variables. The second tree was developed to highlight the predictive value of parasitemia in various season and age groups and included only the variables season, age, and parasitemia. For these analyses, spleen size was treated as an ordered categorical
vari-able with five levels, whereas parasite count and he-matocrit were treated as continuous variables. Finally, stepwise logistic regression was performed on the risk of fever, treating enlarged spleen, parasite count (base 10 log scale), anemia, and their interactions with an age < 4 years as independent variables. Statistical analyses were performed using EGRET (30) and S-Plus (31).
RESULTS
Prevalence of fever and other variables
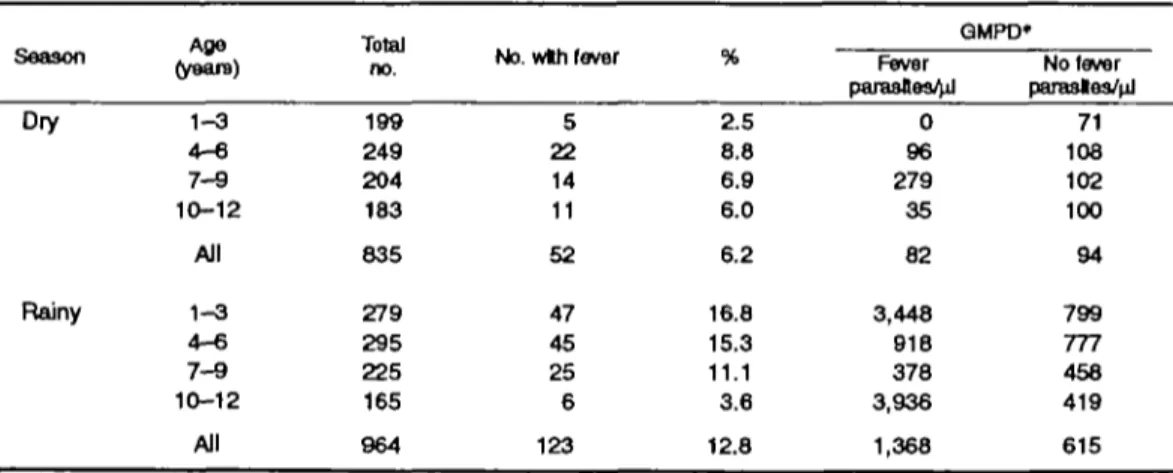
The number of registered children was 928 in the first occasion (dry season) and 998 in the second. Complete follow-up and information were available for 835 children (90.0 percent) in the dry season and for 964 (96.6 percent) in the rainy season. The prev-alence of fever on the first study day (day 0) (temper-ature >38°C) was 6.2 percent (52/835) in the dry and 12.8 percent (123/964) in the rainy season (table 1). Children with fever on day 0 had on average greater parasite densities on day 0 during the rainy season (p = 0.002) but not during the dry season. Subsequent analyses included only those participants who were afebrile on day 0.
The parasite rate was higher (77.6 percent) in the rainy season compared with the dry season (53.5 per-cent, p < 0.0001), as was the prevalence of anemia (23.8 vs. 8.9 percent, p < 0.0001). No significant seasonal variation was apparent for the spleen rate (21.0 vs. 25.0 percent, p - 0.11). The prevalence of anemia was greater in children with enlarged spleen, both in the dry (7.7 vs. 12.8 percent, p = 0.03) and in the rainy season (20.6 vs. 35.2 percent, p < 0.0001). The parasite rate was elevated among children with an enlarged spleen in the dry season (45.8 vs. 76.5 per-cent, p < 0.0001) but not in the rainy season (76.8 vs. TABLE 1. Prevalence of fever and mean parasite densities on day 0 by age group and season,
Bougoula, West Africa, 1993
Season (years)Afje Total
no. No. wth fever
QMPD» Fever parasfles4d No fever parasles/nJ Dry Rainy 1-3 4 - 6 7 - 9 10-12 All 1 - 3 4 - 6 7 - 9 10-12 199 249 204 183 835 279 295 225 165 All 964 5 22 14 11 52 47 45 25 6 123 2.5 8.8 6.9 6.0 6.2 16.8 15.3 11.1 3.6 0 96 279 35 82 3,448 918 378 3,936 12.8 1,368 71 108 102 100 94 799 777 458 419 615 * GMPD, geometric mean of parasite density.
80.8 percent). No direct association was observed be-tween the parasite rate and anemia.
Incidence and time course of fever
The 9-day cumulative fever incidence increased from 2.0 percent in the dry season to 8.2 percent in the rainy season {p < 0.0001). Since the incidence of fever with a determined cause was comparable in both seasons (1.1 percent in the dry, 1.3 percent in the rainy season), the seasonal variation of fever was essentially due to an increase in fevers of undetermined, most likely malarial, origin.
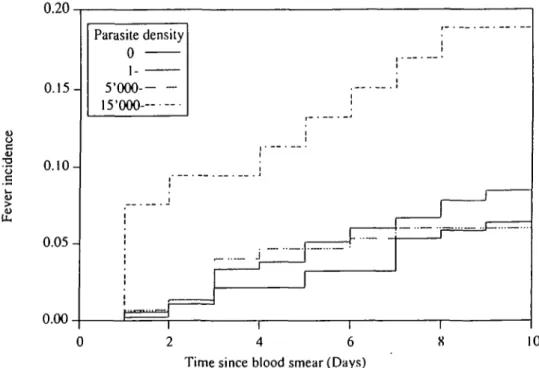
In the rainy season, the fever incidence was in-creased in children with a parasite count >15,000//xl (18.9 percent (95 percent confidence (CI) interval 10.6-32.2)), compared with those whose counts were < 15,000 (7.5 percent (95 percent CI 5.9-9.6)); rela-tive risk (RR) = 2.7 (95 percent CI 1.4-5.4), p = 0.003). Intermediate levels of parasitemia, between 1 and 15,000/pil, were not associated with a significant increase in risk. Even in the high risk group, the cumulative incidence was <20 percent (figure 1 and table 2).
The relation between the parasite count and the risk of fever was further analyzed graphically (not shown). In the rainy season, nonparametric regression showed a sharp acceleration of the risk of fever from 15,000 parasites//i,l upward and in the dry season, a slight increase for children with a parasite count >2,000//xl.
Predictors of fever
The risk of fever (table 2) was higher in the younger age group (1-3 years) compared with older children (dry season: RR = 2.4 (95 percent CI 0.9-6.4), p = 0.08; rainy season: RR = 2.5 (1.6-4.1), p < 0.001). Children with moderate to severe anemia had an in-creased cumulative risk of fever in the dry season (RR = 8.2 (3.0-22.1), p < 0.001) and in the rainy season (RR = 1.8 (1.1-2.9),/? = 0.024). Spleen en-largement was not associated with any increase in the risk of fever in the dry season, but with a twofold increase in the rainy season (RR = 2.0 (1.2-3.3), p = 0.006).
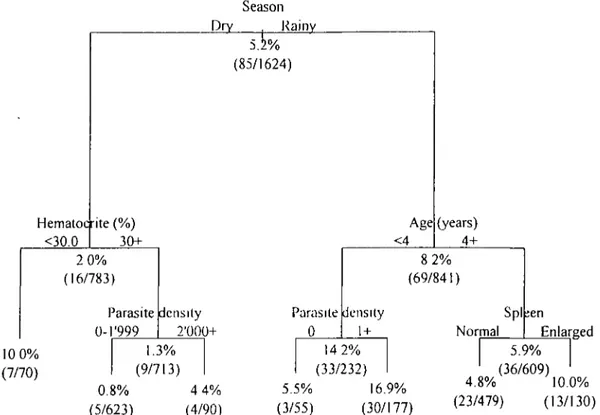
The best classification tree for prediction of fever incidence, fitted to data from both seasons, is shown in figure 2. The vertical distance from each parent to child node is proportional to the change in deviance, so that greater distance represents enhanced statistical significance. In the rainy season, age < 4 years was the most important predictor of fever. In this age group, the best predictor was the presence of parasites ( > 1 /
JLLI); by contrast, in children aged S 4 years, an en-larged spleen was the best predictor. So in the wet season, the highest incidence groups were the follow-ing children: 1) younger than 4 years exhibitfollow-ing plas-modia in peripheral blood (6.9 percent), and 2) older than 4 with an enlarged spleen (10.0 percent). In the dry season, the best predictor of fever was an hemat-ocrit <30 percent, with a cumulative incidence of 10.0
0.20 c U 0.15- 0.10- 0.05-0.00 Parasite density 0 i 5-000- 15'OOQ-. 15'OOQ-. i 0 2 4 6 8 10 Time since blood smear (Days)
TABLE 2. Distribution of main variables and their association with 9-day cumulative fever incidence by season, Bougoula, West Africa, 1993
Variable All Gender Male Female Age (years) 1-3 4-6 7-9 10-12 Enlarged spleen No Yes Anemia No Yes Parasite density 0 1-1,1999 2,000-4,999 5,000-14,999 215,000 No. 783 415 368 194 227 190 172 587 196 713 70 364 314 57 48 0 Dry season Fever Incidence (%) 2.0 2.7 1.4 3.6 2.2 2.1 0.0 2.2 1.5 1.3 10.0 1.9 1.0 7.0 4.2 Ratal Ive risk* 1.00 0.51 1.00 0.60 0.58 0.00 1.00 0.69 1.00 8.24 1.00 0.49 3.81 2.21 P vaJuet 0.2 0.4 0.4 0.012* 0.6 0.001 0.308 0.033 0.323 No. 841 440 401 232 250 200 159 659 182 641 200 188 314 136 150 53 Rainy 8 Fever incidence (%) 8.2 8.9 7.5 14.2 6.8 5.0 5.7 6.8 13.2 7.0 12.0 6.4 8.3 8.8 6.0 18.9 aason Relative risk* 1.00 0.84 1.00 0.45 0.33 0.38 1.00 1.99 1.00 1.77 1.00 1.31 1.41 0.94 3.25 P valuet 0.5 0.008 0.002 0.01 0.006 0.024 0.441 0.402 0.907 0.006 • Estimated from Cox regressions.
t For the comparison of each level with the baseline level, from Wald tests (Cox regressions) and chi-square tests, where noted.
% Chi-square test.
percent. In nonanemic children, a parasite count >2,000//u,l was the next best predictor.
The second series of regression trees, with season, age, and parasitemia as risk factors, showed in the rainy season a first dichotomy at 4 years of age; in children < 4 years, a dichotomy at a level of one parasite//xl or more (as in figure 2); in children > 4 years, a dichotomy at a level of 16,000 parasites//xl, with a cumulative incidence of 16.1 percent (5/31) greater than, and 5.4 percent (31/578) less than that level. In the dry season, a first dichotomy occurred with age at 8 years, followed by parasitemia >2,000//xl in children younger than 8 years, with a risk of 6.7 percent (5/75), compared with 2.4 percent (10/417) for parasitemia <2,000/jxl. Only one case of fever, in a child with a parasite count of 4,225/jil, occurred in children older than 8 years in the dry season (1/291).
The stepwise logistic regression analysis kept two determinants in the model in the rainy season: an enlarged spleen (odds ratio (OR) = 2.0 (95 percent CI 1.2-3.5)) and in the 1- to 3-year-old children only, the log of parasite count (OR = 1.4 (1.2-1.6)). In the dry season, only anemia was kept in the model (OR = 9.7 (3.1-24.1)).
DISCUSSION
Parasitemia and fever
Based on a population of children without fever on a given day, this study shows an association between parasite density and fever incidence. The nature of the association depends on both season and age, which also consistently appear as the stronger predictors of fever. The levels of parasite density above which the risk of fever was increased were, in the rainy season, 15,000/pil in children older than 4 years and l//xl in younger children; in the dry season, this level was 2,000/^,1 for children of all ages. This relation between parasitemia and fever incidence appears to vary ac-cording to the season and the child's age.
Even in the high risk groups, the cumulative inci-dence of fever was <20 percent. These findings con-tradict the frequent assumption that asymptomatic children with high levels of parasitemia will probably develop fever. They provide only partial support for the concept of a pyrogenic threshold and call into question the hypothesis of a consistent relation be-tween parasitemia and fever.
Age and season probably reflect different states of dynamic equilibrium between malaria transmission,
Season Dry Rainy Hematocrite (% <30.0 (85/1624) Age 30+ <4 (years) 4+ 2 0% (16/783) Parasite 0-T999 density 2'000+ Parasite 0 8 2% (69/841) density 1 + Spl Normal ;en 10 0% (7/70) 1.3% (9/713) 0.8% (5/623) 4 4% (4/90) 14 2% (33/232) 5.5% 16.9% (3/55) (30/177) Enlarged 5.9% (36/609) 4.8% 10.0% (23/479) (13/130)
FIGURE 2. Classification and regression tree of the cumulative risk of fever by season, age, spleen size, hematocrtt, and parasite density, Bougoula, West Africa, 1993.
parasite load, and immune defenses, resulting in dif-ferent levels of tolerance to malaria parasites (32). Other predictors of fever
Although anemia or splenomegaly have been shown to be associated with fever and parasitemia in cross-sectional studies (10, 33-35), the relation between these variables and the incidence of fever has, to our knowledge, never before been explored prospectively. In our study, spleen enlargement in the rainy season and anemia in the dry season were stronger predictors of fever incidence than parasite density. Lower mean hematocrit values in the rainy season and in para-sitemic children have been observed before in one previous study (33) in the Gambia. Our finding that the prevalence of moderate to severe anemia more than doubled in the rainy season complements our earlier observation of a similar seasonal effect in preg-nant women from the same village (36). Thus, malaria appears to be the main cause of anemia in both chil-dren and pregnant women in this region.
Malaria in the dry season
In the dry season, anemia was the best predictor of fever, with an incidence of 10 percent in children whose hematocrit was <30 percent. To our
knowl-edge, this is the first time such an observation has been made.
Although no malaria transmission occurs in this area during most of the dry season, some children still presented with parasitemia, anemia, and/or spleen en-largement by the end of the season. These findings raise the possibility of the persistence of malaria in-fection and of some of its effects throughout the dry season and merit further investigations.
What is a malaria attack?
The relation between parasitemia and the clinical manifestations of malaria is complex. Parasitemia, spleen enlargement, or anemia in an afebrile child may all indicate the presence of a pathologic, malarial process.
Little is known, however, of the parasite dynamics, especially in people living in endemic areas. The par-asite count in the peripheral blood of a particular individual at a given time varies in relation to the proportion of parasitized erythrocytes sequestered in internal organs and may change substantially during the course of only a few hours (9). Parasite density should be considered not so much a direct marker of an ongoing malaria attack but as just one indicator of the likelihood of a current or imminent attack, or even
of one just passed. The concept of a "pyrogenic thresh-old," which implies a direct relation between both parasitemia and fever, is misleading and probably should be abandoned. The current reliance on para-sitemia for the diagnosis of malaria (37) should be replaced by probabilistic approaches, involving struc-tured decision-making processes.
ACKNOWLEDGMENTS
Support for this study was provided by grants from the National Funds for Scientific Research (Swiss grant N-3200-037810.93), the Swiss branch of Mother and Child (Iamaneh), and the Novartis Foundation for a Sustainable Development, Basel, Switzerland. The study was conducted under the auspices of the Sikasso Maternal and Child Health Project for the development of health services and programs in the city of Sikasso, which is sponsored by the Swiss and the Malian branches of Mother and Child International (Iamaneh) and the Regional Direction of Public Health in Sikasso (Dr. Benoit Karambiri).
The authors thank Dr. Michel Picquet, the district medi-cal officers of the Cercle de Sikasso, the staff of the Re-gional Direction of Public Health, and the health team of Bougoula for their collaboration as well as Pauline Du-ponchel in Bamako for her valuable assistance. The authors also thank the interviewers, Moussa Diallo, Mahachiata Bengali, Mariam Kone, Aissata Dicko, Diafara Berths, and Dramane Ballo, in addition to the population, the guide, and the authorities of Bougoula for their support of this project.
REFERENCES
1. Molineaux L, Gramiccia G. The Garki Project. Geneva: World Health Organization, 1980.
2. Salako LA, Ajayi FO, Sowunmi A, et al. Malaria in Nigeria: a revisit Ann Trap Med Parasitol 1990;84:435-45.
3. Baudon D, Galaup B, Ouedraogo L, et al. Une 6tude de la morbidity palustre en milieu hospitalier au Burkina Faso (Af-rique de l'Ouest). (In French). Med Trap 1988;48:9-13. 4. Trape JF, Zoulani A, Quinet MC. Assessment of the incidence
and prevalence of clinical malaria in semi-immune children exposed to intense and perennial transmission. Am J Epide-miol 1987; 126:193-201.
5. Velema JP, Alinohou EM, Chippaux JP, et al. Malaria mor-bidity and mortality in children under three years of age on the coast of Benin, West Africa. Trans R Sec Trop Med Hyg 1991;85:430-5.
6. Smith T, Schellenberg JA, Hayes R. Attributable fraction estimates and case definitions for malaria in endemic areas. Stat Med 1994; 13:2345-58.
7. Schellenberg JRMA, Smith T, Alonso PL, et al. What is clinical malaria? Finding case definitions for field research in highly endemic areas. Parasitol Today 1994; 10:439-42. 8. Smith T, Genton B, Baea K, et al. Relationships between
Plasmodium falciparum infection and morbidity in a highly
endemic area. Parasitology 1994;109;539-49.
9. Marsh K. Malaria—a neglected disease? Parasitology 1992; 104:S53-69.
10. Hogh B, Maibiah NT, Petersen E, et al. Classification of clinical falcipamm malaria and its use for the evaluation of chemosuppression in children under six years of age in Libe-ria, West Africa. Acta Tropica 1993;54:105-15.
11. Van den Ende J, Van den Ende E, Gompel A, et al. When is fever malaria? Lancet 1992;339:690.
12. Trape JF, Peelman P, Morault-Peelman B. Criteria for diag-nosing clinical malaria among a semi-immune population exposed to intense and perennial transmission. Trans R Soc Trop Med Hyg 1985;79:435-42.
13. Walker O, Sowunmi A, Salako LA. Pitfalls in the diagnosis of malaria: a parasitaemic severe malaria. J Trop Pediatr 1992; 38:268.
14. Carnevale P, Robert V, Molez JF, et al. Epide'miologie g6n6rale: fades e'pidemiologique des paludismes en Afrique subsaharienne. (In French). Etudes Me"dicales 1984;3:123—33. 15. Traore S. Epidemiologie du paludisme en zone de savanne sud-soudanienne au Mali: le village de Pimperena dans la region de Sikasso de Juin 1992 a Septembre 1993. (In French). These, Ecole Nationale de Metlecine et de Pharmacie, Ba-mako, 1995.
16. Boudin C, Robert V, Verhaeve JP, et al. Plasmodium
falcipa-mm and P. malariae epidemiology in a West African village.
Bull World Health Organ 1991 ;69:199-205.
17. Robert V, Carnevale P, Ouedraogo V, et al. La transmission du paludisme humain dans un village de savane du sud-ouest du Burkina Faso. (In French). Ann Soc Beige M6d Trop 1988;68:107-21.
18. Gilles HM. Epidemiology of malaria. In: Gilles HM, Warrel DA, eds. Bruce-Chwatt's essential malariology. 3rd ed. Boston: Little, Brown, 1993:124-62.
19. World Health Organization Programme for the Control of Acute Respiratory Infections and Malaria Unit. The overlap in the clinical presentation and treatment of malaria and pneu-monia in children: report of a meeting. Geneva: World Health Organization, 1993. (ARI/92.23, MAL/92.1065).
20. Pontious SL, Kennedy A, Chung KL, et al. Accuracy and reliability of temperature measurement in the emergency de-partment by instrument and site in children. Pediatr Nurs 1994;20:58-63.
21. DeMayer EM. Preventing and controlling iron deficiency ane-mia through primary health care. Geneva: World Health Or-ganization, 1989.
22. McNemar Q. Note on the sampling error of the difference between correlated proportions or percentages. Psychometrika 1947;12:153-7.
23. Breslow NE, Day NE, eds. Statistical methods in cancer research. Vol 1. The analysis of case-control studies. (IARC scientific publication no. 32). Lyon: International Agency for Research on Cancer, 1980.
24. Kaplan EL, Meier P. Nonparametric estimation from incom-plete observations. J Am Stat Assoc 1958;53:457-81. 25. Cox DR. Regression models and life-tables (with discussion).
J R Stat Soc 1972;B34:187-220.
26. Chambers JM, Hastie TJ. Statistical models in S. Pacific Grove, CA: Wadsworth and Brooks, 1992.
27. Hastie T, Tibshirani R. Generalized additive models. London: Chapman and Hall, 1990.
28. Breiman L, Friedman JH, Olshen R, et al. Classification and regression trees. Pacific Grove, CA: Wadsworth and Brooks, 1984.
29. Pallara A. Binary decision trees approach to classification: a review of CART and other methods with some applications to real data. Stat Applicata 1992;4:255-86.
30. EGRET. Seattle, WA: Statistics and Epidemiology Research Corporation, 1991.
31. StatSci. S-Plus user's manual, version 3.0. Seattle, WA: Sta-tistical Sciences Corporation, 1990.
32. Clyde DF. Epidemiologie significance of immunity in vivax malaria. Epidemiol Rev 1989; 11:109-25.
33. Greenwood BM, Bradley AK, Greenwood AM, et al. Mortal-ity and morbidMortal-ity from malaria among children in a rural area of the Gambia, West Africa. Trans R Soc Trap Med Hyg
1987;81:478-86.
34. Hedberg K, Shaffer N, Davachi F, et al. Plasmodium falcipa-nun-associated anemia in children at a large urban hospital in Zaire. Am J Trap Med Hyg 1993;48:365-71.
35. Redd SC, Kazembe PN, Luby SP, et al. Clinical algorithm for
treatment of Plasmodium falciparum malaria in children. Lan-cet 1996;347:223-7.
36. Bouvier P, Doumbo O, Breslow N, et al. Seasonality, malaria and impact of prophylaxis in a West African village. I. Effect on anemia in pregnancy. Am J Trop Med Hyg (In press). 37. Jonkman A, Chibwe RA, Khoromana CO, et al. Cost-savings
through microscopy-based versus presumptive diagnosis of malaria in adult outpatients in Malawi. Bull World Health Organ 1995:73:223-7.