Johannes M. Froehlich Muriel Daenzer
Constantin von Weymarn S. Mehmet Erturk Christoph L. Zollikofer Michael A. Patak Received: 28 August 2008 Revised: 3 December 2008 Accepted: 13 December 2008 Published online: 4 February 2009 # European Society of Radiology 2009
Aperistaltic effect of hyoscine
N-butylbromide
versus glucagon on the small bowel assessed
by magnetic resonance imaging
Abstract The aim of this prospective study was to compare the intraindi-vidual aperistaltic effect of 40 mg
hyoscine N-butylbromide (HBB/
Buscopan) with that of 1 mg gluca-gon on small bowel motility by using magnetic resonance imaging (MRI). Ten healthy volunteers underwent two separate 1.5-T MRI studies (HBB/glucagon) after a standardized oral preparation with an aqueous solution of Gd-DOTA and ispaghula (Metamucil). A 2D T1-w GRE se-quence was acquired (TR 2.7 ms/TE 1.3 ms, temporal resolution 0.25 s) before and after intravenous (i.v.) drug administration and motility was followed over 1 h. On the resulting images the cross-sectional luminal diameters were assessed and plotted over time. Baseline motility frequen-cy, onset of aperistalsis, duration of arrest, reappearance of motility and return to normal motility were
analysed. Significant differences re-garding reliability and duration of aperistalsis were observed. In the HBB group aperistalsis lasted a mean of 6.8± 5.3 min compared with 18.3 ±
7 min after glucagon (p<0.0001). In
50% of cases HBB did not accom-plish aperistalsis, whereas glucagon
always succeeded (p=0.05). There
were no significant differences in terms of baseline and end frequencies for the onset of aperistalsis (22.2± 37.5 s HBB/13.4± 9.2 s glucagon, p=0.1), nor for the return to normal motility. Arrest of small bowel mo-tion is achieved more reliably and lasts significantly longer after i.v. administration of 1 mg glucagon compared with 40 mg HBB.
Keywords Small intestine . Magnetic resonance imaging . Gastrointestinal
motility . HyoscineN-butylbromide .
Glucagon . Antispasmodic drugs
Introduction
Small bowel peristalsis causes movement artefacts in MRI and computed tomography (CT) examinations that can impede the diagnostic quality of abdominal and pelvic
studies [1–3]. A spasmolytic agent is therefore commonly
administered intravenously to inhibit bowel motion shortly before performing abdominal imaging studies. The two main paralysing agents used in clinical routine are hyoscine N-butylbromide (HBB; Buscopan®, Boehringer Ingel-heim, Germany) and glucagon (GlucaGen®, Novo Nor-disk, Küsnacht, Switzerland). HBB is a well-known anticholinergic compound with a high tissue affinity for
muscarinic receptors located on visceral smooth muscles of the gastrointestinal tract where it has a
relaxing/spasmo-lytic effect [4].
Glucagon is a protein comprising 29 amino acids which is produced by expression of recombinant DNA in a Saccharomyces cerevisiae vector. Glucagon exerts para-lytic effects on the gastrointestinal smooth muscle by acting on the stimulatory G-protein-coupled glucagon receptors, which are distributed throughout the
gastroin-testinal tract [5]. Although the pharmacological properties
of hyoscineN-butylbromide and glucagon are completely
different their effect on bowel peristalsis is the same, both leading to aperistalsis. Little has been reported on their
J. M. Froehlich . C. von Weymarn . C. L. Zollikofer
MR Research Group, Cantonal Hospital Winterthur, Winterthur, Switzerland M. Daenzer . M. A. Patak
Inselspital, University Hospital of Bern, Bern, Switzerland
S. M. Erturk
Department of Radiology, Sisli Etfal Education and Research Hospital, Istanbul, Turkey
M. A. Patak (*)
Institute of Diagnostic Radiology, Inselspital, University Hospital, 3010 Bern, Switzerland e-mail: [email protected] Tel.: +41-31-6322111
effect on small bowel motility, particularly for inhibiting
bowel wall motion in cross-sectional imaging [6–8].
There is an ongoing discussion on the relative merits of these two agents, mainly focused on the onset time,
duration and location of their effects [8].
MR motility imaging of the small bowel was introduced in recent years allowing visualisation, quantification and
characterisation of small bowel motility [6]. The MRI
method proposed here is based on ultrafast imaging by repeated acquisition on the same image plane covering large portions of the small bowel and allowing direct visualisation of small bowel wall movement. The aim of this prospective volunteer study was to characterise and compare the paralytic effect of HBB versus that of glucagon on small bowel motility based on MRI measure-ments over a period of 60 min.
Materials and methods
Study population
The MRI studies were performed between December 2004 and January 2006. The study population (five female; five male) comprised healthy nonsmokers, with an average age of
32 years, a BMI of 22 kg/m2(19–29 kg/m2), with no known
small bowel diseases or contraindications to MRI. Each of the volunteers agreed to undergo two identical MRI procedures, once with 40 mg HBB and once with 1mg glucagon. There was an interval of at least 2 weeks and no more than 2 months between the two imaging sessions. The study was approved
by the hospital’s ethics committee and informed written
consent was obtained from all ten volunteers.
Preparation
Each volunteer received an oral administration of a standardised combination of 20 ml Gd-DOTA (gadoterate, Dotarem®, Guerbet, Aulnay sur Bois, France) and 0.2 g/kg body weight of ispaghula fibres (Metamucil®, Proctor and Gamble, Ohio, USA), dissolved in 1,200 ml tap water. This solution was ingested continuously by the volunteers over a period of 2 h before imaging, providing a standardised distension of the entire small bowel.
Imaging and drug administration
The study was performed on a 1.5-T MRI unit (Intera Achieva, Philips Medical System, Best, the Netherlands) using a 4-channel SENSE body surface coil (phased array coil). Imaging was performed in apnoea with the volunteer prone. To aid in choosing the optimal coronal slice for measuring motility, an initial coronal 3D-balanced fast-field-echo (bFFE) pulse sequence covering the whole
abdomen was applied for 30 s in apnoea with the following parameters: TR 4.4 ms, TE 1.3 ms, flip angle 20°, FOV 420 mm, rectangular FOV 95%, matrix 512×512, SENSE factor 2, 80 slices, slice thickness 1.5 mm, partial echo. The quality of this initial pulse sequence was hampered by the active bowel motion. To monitor motility, a 2D T1-weighted gradient-echo sequence was used with the following parameters: TR 2.7 ms, TE 1.3 ms, flip angle 45°, FOV 500 mm, rectangular FOV 95%, slice thickness 10 mm, matrix 192×512, SENSE factor 2 with a single slice assessment time of 0.25 s. The preferred direction of image acquisition alternated between the coronal and sagittal planes with interleaved acquisition order. This sequence can be repeated as long as required, in our protocol for a period of 1 h. A total of 40 consecutive sequences were therefore acquired within one study examination; the complete setup for the imaging study is
summarised in Fig.1.
Once the“baseline sequence” to analyse normal motility
had been obtained in a 20-s apnoea phase, a bolus of either 40 mg HBB or 1 mg glucagon was injected intravenously into the antecubital arm vein and flushed by a bolus of 20 ml saline (0.9% NaCl). Volunteers were not aware which drug was being injected. After administration of the drug, the first 2D sequence of the study series was applied with scanning for 40 s, again in apnoea, followed by a 20-s break for breathing. After that, a sequence was repeated every minute for the next 20 min, each time with MR data acquired for 20 s followed by a 40-s pause for breathing. After 20 min the recording interval was prolonged to 2 min consisting of 20-s image acquisition followed by a 1 min 40 s interval for breathing. After drug injection, the overall follow-up time was 1 h. All volunteers were monitored for adverse effects or late reaction for approximately 90 min after drug administration.
Image analysis
All recorded studies were reviewed blinded for the given drug. Evaluation began by choosing single well-distended segments at five different locations within the abdomen. Measurement was done orthogonally to the long axis of the small bowel resulting in cross-sectional diameters of
the small bowel over time (Fig.2). On the sagittal plane the
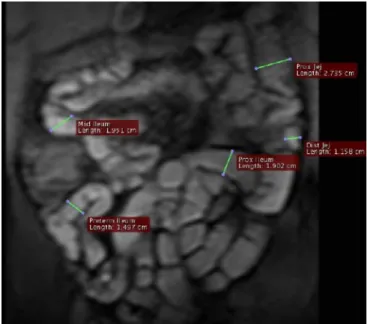
chosen measurement site was at the level of the duodenum, directly beneath the stomach. On the coronal plane cross-sectional diameters were measured at five different levels of the small bowel; at the level of the proximal and distal jejunum, and at the proximal, mid- and preterminal ileum
(Fig.3). Measurement locations were defined on the first
slice, then propagated through the complete stack and adjusted for diameter on each slice in order to exactly depict the lumen diameter. Because of breathing, the measured location slightly shifted and had to be manually adjusted.
The measurements were plotted over time separately for each volunteer, each drug and for each location by one blinded reader. The resulting 240 plots (from 6 locations within 10 volunteers receiving two different drugs, pre- and postadministration of the drug) were evaluated in consensus by two other blinded readers. On each of the 120 plots acquired before injection of the spasmolytic agent, baseline motility frequency was assessed where frequency was defined as the number
of “valleys” on the plot (a valley defined as a
contraction of the small bowel leading to a decrease
in its diameter, a “hill” as the maximum distension of
the same small bowel segment) correlated to the measurement time of 20 s and extrapolated up to
1 min (Fig.4). On each of the 120 plots after injection
the following time points were assessed: onset of paralysis, reappearance of small bowel motility and finally the delay until motility normalised. Examples of
all these time points are shown in Fig. 5. The time
point of paralysis was defined as the flattening of the plot down to an amplitude smaller than 20% of the baseline amplitude. Reappearance represented the time
Fig. 2 Image of a single bowel segment magnified from a dynamic MRI of the small bowel. The bowel loop is shown at different time points within the same dynamic sequence. At one time it is distended (a), at another contracted (b), and at yet another relaxed again (c). Measurement of the cross-sectional diameters along this segment allows assessment of small bowel motility
Fig. 3 Coronal slice of a 2D T1-w GRE sequence for the detection of small bowel motility after administration of 1,200 ml water spiked with 0.2 g/kg BW ispaghula and 20 ml Gd-DOTA. On each of the slices the diameter of the small bowel was measured at five different locations: the proximal and the distal jejunum, and the proximal, mid- and preterminal ileum. The diameters were measured orthogonally to the long axis of the bowel segment
Fig. 1 Sequence algorithm for the evaluation of small bowel motility. The first sequence lasted 40 s with a break of 20 s to breath, whereas all succeeding ones were acquired over a period of 20 s.
Initially, the pauses in between the sequences were 40 s for the first 20 min followed by 1 min and 40 s up to the end of the experiment with 60 min after the injection of the study drug
point where the amplitude again exceeded the prior limit of 20% but without a regular pattern of the curve. Normalisation was defined as the return to an ampli-tude similar to the baseline (±10%), with a regular sinusoidal curve form and a constant frequency over a minimum of three subsequent measurements. The difference between initiation of paralysis and reappear-ance of first motility constitutes the actual time of drug effect needed for imaging. Normalised motility was defined as return of the motility curve to a sinusoidal pattern resembling the baseline patterns, as described
previously [6].
Statistical analysis
Mean values of all measured parameters such as onset of paralysis, duration of paralysis, reappearance of first bowel motion and time to nomalisation were compared statistically within the two groups based on the location (i.e. reapperance of first bowel motion in the HBB group on the level of the duodenum versus on the level of proximal ileum). The location-dependent mean values were compared between the two drug groups (i.e. time of
onset on the level of duodenum in the HBB group versus in the glucagon group). Finally all time-dependent parameters were compared between both treatment groups by averaging all data for all locations (i.e. time to normalization of all volunteers over all locations in the HBB group versus all volunteers over all locations in the glucagon group). Statistical analysis was done using
the two-sided paired Student’s t test on the hypothesis that
there was no difference in the measured parameters. A
value of p<0.05 was considered to be statistically
significant.
Results
All ten volunteers showed a high degree of compliance during the two MRI examinations (one for each drug). No one dropped out and all imaging sequences could be evaluated for all volunteers.
Only minor adverse effects were noted for each drug shortly after administration. Three volunteers had a short period of dizziness, two in the HBB group and one in the glucagon group. No serious adverse effects or late reactions were registered during the 90-min post-drug-administration monitoring period. 0 5 10 15 20 0 2 4 6 8 10 12 14 16 18 20 22 24 26 28 30 32 34 36 38 40 61 63 65 67 69 71 73 75 Baseline frequency Diameter (mm) Time (s)
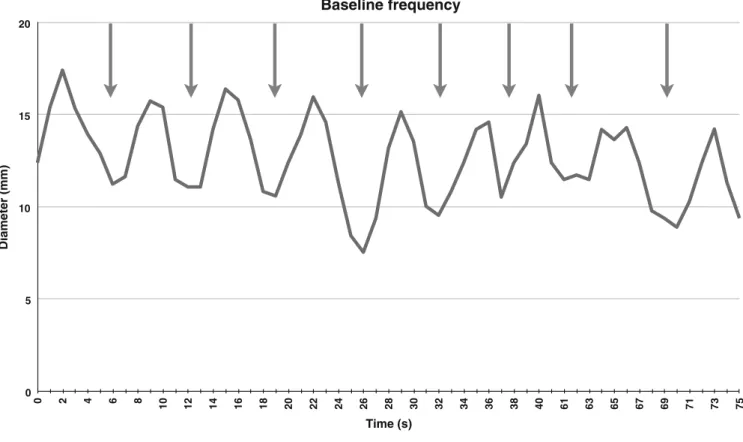
Fig. 4 Plot of baseline motility before the administration of an antiperistaltic drug (20 s). This plot represents the small bowel cross-sectional diameter measurements over time of a single volunteer on the level of the preterminal ileum. Measurement of contraction frequency was based on the number of valleys (arrows)
indicating a narrowing of the small bowel segment diameter. The number of valleys was extrapolated up to 1 min to get an estimate of contractions per minute. The average contraction rate was 8.5 per min for all volunteers before and after drug administration and independent of the applied drug
The plots for each volunteer, regarding the different locations and for the two study drugs, were individually analysed. The results below correspond to the mean values (± standard deviation) of these assessed parameters.
The baseline frequency of the small bowel contraction showed 8.5±1.75 contractions per min before spasmolytic drug administration. The two groups did not differ with
regard to baseline frequency (p=0.91). This shows that
each volunteer had an equal baseline frequency before the two postadministration MRI examinations. The baseline of
the study and the preparation scheme are therefore both inter- and intraindividually comparable, underlining the
method’s good reproducibility.
The mean interval between injection and paralysis of small bowel motility was 22.2±37.5 s for HBB versus 13.4±9.2 s for glucagon, both being relatively rapid. The difference for the onset time of paralysis was not
statistically significant (p=0.1). Moreover, no significant
difference was noted between the various locations within a single group or intraindividually between the two groups. 0 7.5 15.0 22.5 30.0 0 11 22 33 63 74 105 116 147 158 189 240 251 302 313 364 375 426 437 488 499 550 601 612 663 674 725 736 787 798 849 900 911 962 973 1024 1035 1086 1097 1148 1159 1329 1440 1451 1562 1573 1684 1695 1806 1817 1928 1939 2050 2161 2172 2283 2294 2405 2416 2527 2538 2649 2760 2771 2882 2893 3004 3015 3126 3137 3248 3259 3370 3481 3492 i.v. Glucagon Diameter (mm) Time (s) 0 7.5 15.0 22.5 30.0 0 11 22 33 63 74 105 116 147 158 189 240 251 302 313 364 375 426 437 488 499 550 601 612 663 674 725 736 787 798 849 900 911 962 973 1024 1035 1086 1097 1148 1159 1329 1440 1451 1562 1573 1684 1695 1806 1817 1928 1939 2050 2161 2172 2283 2294 2405 2416 2527 2538 2649 2760 2771 2882 2893 3004 3015 3126 3137 3248 3259 3370 3481 3492 i.v. Buscopan Diameter (mm) Time (s)
a
b
1 2 1 2 3 3Fig. 5 Plots of the contractions of small bowel segments monitored over a period of 1 h after i.v. injection of 1 mg glucagon (a) or 40 mg HBB (b). Each plot depicts the small bowel cross-sectional diameter changes over time for one volunteer on the level of the terminal ileum. On these plots the following time points were evaluated:1 onset of paralysis, 2 first motion after paralysis, 3 return
to normal motility. The timespan between1 and 2 is the important phase for cross-sectional imaging free of bowel-induced motion artefacts. These time points were analysed for each volunteer on six different levels, separately for each drug (corresponding to a total of 240 evaluated plots). Glucagon has a significantly longer paralysis effect than HBB
Table 1 Small bowel peristaltic movement frequencies per min, duration of complete arrest, normalisation
Parameters HBB (Buscopan®) Glucagon P value Baseline frequency (contractions per min) 8.5±2 8.5±1.5 0.91 Onset of effect (s) 22.2±37.5 13.4±9.2 0.1 First movement (min) 6.8±5.3 18.3±7 <0.0001 Most frequent location of first movement Jejunum Terminal ileum
Delay to normalisation (min) 23±14.9 33±6.1 0.08 Terminal frequency (contractions per min) 9.5±1.7 9.7±1.8 0.45
In the HBB group only five volunteers achieved complete arrest of bowel motion, whereas all volunteers in the glucagon group attained complete paralysis. The difference for achieving paralysis between the two drugs was
statistically significant (p=0.05).
A significant difference was found regarding the duration of effect for the two drugs. In the HBB group, the first reappearance of small bowel motility was observed after a mean period of 6.8±5.3 min, whereas in the glucagon group this did not occur until after 18.3±7 min
(p<0.0001). However, the duration of this pharmacological
effect showed significant intraindividual differences for both drugs resulting in a large standard deviation (range
39 s up to 50 min). Finally, no significant difference (p=
0.08) was measured between the two drugs for the return to normal motility, even though a slight tendency for a more delayed normalisation was noted for glucagon (23± 14.9 min for HBB versus 33±6.1 min for glucagon). The motility of all volunteers returned to normal before each of the two studies were completed. The end frequencies for both groups at the end of the two examinations were 9.7±1.8 contractions per minute after administration of glucagon and 9.5±1.7 after administration of HBB,
which is not statistically significant (p=0.45). There
was also no significant difference between the groups
regarding pre- and postspasmolysis frequencies (p=0.2).
Table1summarises the various parameters measured
pre-and post-drug administration.
Discussion
Reduction of bowel motion is essential to improving the quality of abdominal or pelvic MRI. Without spasmolytic drugs, however, multiple pulse sequences with longer acquisition times are susceptible to bowel motion, produ-cing only blurred and clinically undesirable images, thus
hampering diagnostic quality [7–9]. There is an ongoing
discussion on the relative merits of the two main aperistaltic agents, HBB (Buscopan®) and glucagon. To date no prospective study has compared these two agents regarding their impact on small bowel motion in cross-sectional imaging. Our study shows a clear advantage for glucagon with a significantly greater efficiency and a significantly longer effect of paralysis.
Various other authors [10–12] have already
qualita-tively compared the spasmolytic, duodenal distension and coating effects of glucagon and HBB in double-contrast barium meal examinations. Prolonged gastric visualiza-tion was reported with 0.5 mg i.v. glucagon compared with 20 mg HBB. Opposing effects of glucagon (hyper-tonic) and HBB (hypo(hyper-tonic) on gastric emptying and duodenal filling influenced by the tonicity of the pyloric sphincter explain the specific findings in these previous studies limiting their extrapolation to cross-sectional imaging techniques.
Despite their completely different action site and
pharmacology [4, 5], HBB and glucagon have an early
and rapid onset that occurs more or less in parallel with the arterial first-pass effect in the abdomen. The effects of both drugs start approximately 30 s after injection with no measurable location-dependent difference regarding mo-tility. Apparently, the muscarinic receptors and glucagon receptors are expressed in similar compartments.
Glucagon was clearly more effective at inducing spasmol-ysis than HBB: all glucagon volunteers achieved complete arrest of bowel motion versus only 50% of HBB volunteers. Our results also show that glucagon induces a significantly longer duration of paralytic effect than HBB. The period of complete arrest of bowel motion needed for imaging is about threefold longer after 1 mg glucagon than after 40 mg HBB. This exemplifies the lower absolute plasma glucagon concentration needed to arrest bowel wall motion compared
with HBB [4]. Potentially, lower doses of glucagon may be
sufficient to induce shorter periods of aperistalsis, but this was not investigated in the present study.
Despite the rather small scale of this study from an imaging perspective, its findings clearly have practical consequences. Glucagon has several advantages over HBB for complete elimination of bowel wall motion in abdom-inal imaging. Glucagon has a fast and more reliable onset and allows prolonged MRI studies with no intestinal movement for about 18 min. This however awaits further confirmation in large-scale clinical trials.
We undertook this prospective volunteer study also to evaluate the MRI method as a robust tool for evaluation of bowel motility.
In a previous feasibility study we were able to demonstrate that MRI might be useful for assessment of
small bowel peristalsis [6]; however, in the feasibility study
the sequence duration was only 30 s, whereas the sequences used in the present trial allowed monitoring over a period of 60 min.
The technical results of the present trial demonstrate that MRI is a valuable, robust and reproducible tool for evaluating small bowel peristalsis in healthy volunteers even over a time period of 1 h.
To our knowledge, this is the first prospective study that directly compares the two main spasmolytic drugs on the visualisation of small bowel wall motion. This parameter is deemed the most important factor for successful imaging, since bowel-motion-related artefacts are the main problems to be overcome by premedication for reliable cross-sectional imaging of the abdomen and pelvis.
The clear gold standard for assessment of small bowel motility is still manometry via a pressure-sensitive tube
placed in the small bowel [13, 14]. It should be
emphasised, though, that this technique records only contractions where the lumen fully closes. This measure-ment is fundameasure-mentally different from visualisation of bowel wall motion by MRI. Another way to monitor small bowel motion is by analysing the electrophysiological properties
that propel the contraction over the small bowel wall (impedancometry). This technique is comparable to
elec-trocardiogram for measuring heart physiology(ECG) [15].
It cannot be done, however, by simple placement of electrodes on the body surface, rather they must be applied directly to the surface of the bowel wall which renders the method useless in a clinical setting.
Measuring small bowel motion by MRI has several advantages over the two techniques just mentioned. First, it allows depiction of the entire length of the small bowel, which neither of the other methods does. Second, it is completely noninvasive. Third, it is easy-to-apply and reproducible, whereas both other techniques are
inconve-nient for patients and little used in clinical practice [6,16]
There are several limitations to our study. Correlation to a standard method is lacking and should be evaluated in a future trial. In the present study we wanted first to prove its feasibility for time periods of up to 1 h, which can yield a huge amount of data. In this study we collected more than
70,000 measurements by hand and transferred them into a database. The evaluation itself consisted of another 1,000 data points. Certainly, acquiring this amount of data by hand will pose a problem in future studies. There is a clear need for computational support and semiautomated techniques that can simplify the data acquisition of small bowel motion assessment for further studies.
The aperistaltic characteristics of both drugs cannot be extrapolated to other administration routes, such as
subcu-taneous injection [4, 8,17]. Future studies must compare
the relative merits of the various administration routes. In conclusion, glucagon appears to be superior to HBB for small bowel paralysis in cross-sectional imaging of the abdomen and pelvis. Glucagon is significantly more reliable for the onset of effect and induces complete arrest of bowel motion lasting roughly three times longer than with HBB. It remains for future studies to correlate the findings of our study with a standard method, such as manometry.
References
1. Laniado M, Gronewaller E, Kopp AF, Kaminsky SF, Hamm B, Jacobsen TF, Claussen CD (1997) The value of hyoscine butylbromide in abdominal MR imaging with and without oral magnetic particles. Abdom Imaging 22:381–388
2. Kozak RI, Bennett JD, Brown TC, Lee TY (1994) Reduction of bowel motion artifact during digital subtraction angi-ography: a comparison of hyoscine butylbromide and glucagon. Can Assoc Radiol J 45:209–211
3. Hupscher DN, Dommerholt O (1984) Action and side effects of small doses of buscopan in gastroduodenal radiog-raphy. A prospective study in 300 patients. Diagn Imaging Clin Med 53:77–86
4. Tytgat GN (2007) Hyoscine butylbro-mide: a review of its use in the treatment of abdominal cramping and pain. Drugs 67:1343–1357
5. Mayo KE, Miller LJ, Bataille D, Dalle S, Goke B, Thorens B, Drucker DJ (2003) International Union of Pharmacology. XXXV. The glucagon receptor family. Pharmacol Rev 55:167–194
6. Froehlich JM, Patak MA, von Weymarn C, Juli CF, Zollikofer CL, Wentz KU (2005) Small bowel motility assessment with magnetic resonance imaging. J Magn Reson Imaging 21:370–375
7. Johnson W, Taylor MB, Carrington BM, Bonington SC, Swindell R (2007) The value of hyoscine butylbromide in pelvic MRI. Clin Radiol 62:1087–1093 8. Marti-Bonmati L, Graells M,
Ronchera-Oms CL (1996) Reduction of peristaltic artifacts on magnetic reso-nance imaging of the abdomen: a comparative evaluation of three drugs. Abdom Imaging 21:309–313
9. Wagner M, Klessen C, Rief M, Elgeti T, Taupitz M, Hamm B, Asbach P (2008) High-resolution T2-weighted abdominal magnetic resonance imaging using respiratory triggering: impact of butylscopolamine on image quality. Acta Radiol 49:376–382
10. Cittadini G, Sardanelli F, De Cicco E, Casiglia M, De Cata T, Parodi RC (1998) Compared effect of a genetically engineered glucagon and hyoscine N-butylbromide on double-contrast barium meal study. Eur Radiol 8:449–453
11. Massoud TF, Nolan DJ (1992) Dose reduction of hyoscine-N-butylbromide for double-contrast barium meal exam-inations—a prospective randomized study. Clin Radiol 46:340–343
12. Heron CW, Hine AL, Pozniak AL, Swinburn CR, Johnson NM (1985) Radiographic features in patients with pulmonary manifestations of the ac-quired immune deficiency syndrome. Clin Radiol 36:583–588
13. Hansen MB (2002) Small intestinal manometry. Physiol Res 51:541–556 14. Camilleri M, Hasler WL, Parkman HP,
Quigley EM, Soffer E (1998) Mea-surement of gastrointestinal motility in the GI laboratory. Gastroenterology 115:747–762
15. Nguyen HN, Silny J, Matern S (1999) Multiple intraluminal electrical impe-dancometry for recording of upper gastrointestinal motility: current results and further implications. Am J Gastro-enterol 94:306–317
16. Patak MA, Froehlich JM, von Weymarn C, Breitenstein S, Zollikofer CL, Wentz KU (2007) Non-invasive measurement of small-bowel motility by MRI after abdominal surgery. Gut 56:1023–1025
17. Dosda R, Marti-Bonmati L,
Ronchera-Oms CL, Molla E, Arana E (2003) Effect of subcutaneous butyls-copolamine administration in the reduction of peristaltic artifacts in 1.5-T MR fast abdominal examinations. Eur Radiol 13:294–298