HAL Id: hal-02267743
https://hal.archives-ouvertes.fr/hal-02267743
Submitted on 19 Aug 2019
HAL is a multi-disciplinary open access
archive for the deposit and dissemination of
sci-entific research documents, whether they are
pub-lished or not. The documents may come from
teaching and research institutions in France or
abroad, or from public or private research centers.
L’archive ouverte pluridisciplinaire HAL, est
destinée au dépôt et à la diffusion de documents
scientifiques de niveau recherche, publiés ou non,
émanant des établissements d’enseignement et de
recherche français ou étrangers, des laboratoires
publics ou privés.
Dependability Modelling of Safety Applications in
Communicating Automotive Systems
Ossama Hamouda, Mohamed Kaâniche, Karama Kanoun
To cite this version:
Ossama Hamouda, Mohamed Kaâniche, Karama Kanoun. Dependability Modelling of Safety
Ap-plications in Communicating Automotive Systems. ERTS2 2010, Embedded Real Time Software &
Systems, May 2010, Toulouse, France. �hal-02267743�
Dependability Modelling of Safety Applications
in Communicating Automotive Systems
Ossama Hamouda
1,2, Mohamed Kaâniche
1,2, and Karama Kanoun
1,21
CNRS; LAAS; 7 avenue du colonel Roche, F-31077 Toulouse, France 2
Université de Toulouse; UPS, INSA, INP, ISAE; LAAS; F-31077 Toulouse, France
{ossama.hamouda, mohamed.kaaniche, karama.kanoun}@laas.fr
Abstract: This paper addresses the dependability modelling and evaluation of two safety-related applications that are based on communications between vehicles and between vehicles and fixed infrastructures: automated highway systems and virtual black boxes. The main objective is to develop model-based evaluation approaches to analyze and quantify the dependability of such applications. Modelling is based on Stochastic Activity Networks. The results show the significant impact of some mobility parameters on application availability and safety.
Keywords: Dependability modelling, evaluation, communicating vehicles, mobility, ad-hoc networks
1. Introduction
Traffic is more and more growing, reducing inevitably the safety of vehicles and their occupants. Several solutions, based on new mobility and communication technologies have been envisaged to increase safety, among which Automated Highway Systems (AHS) and Virtual Black Boxes (VBB). AHS and particularly platooning applications based on automatically controlled platoons of coordinated vehicles constitute an efficient solution to increase highway safety by adding automation to the vehicles and to the roadside without building new roads. However, automation may induce new safety problems (due for example to the loss of communications for coordination or to malicious threats) that should be taken into account too when analyzing system safety. The VBB application is inspired from the black box for avionics systems. However, instead of a robust and expensive hardware black box, the data storage is based on a cost effective software solution. The VBB stores important historical information on the vehicles that can be retrieved and analysed in the event of an accident [1].
Both AHS and VBB use a combination of ad-hoc and infrastructure based communication networks. AHS and VBB can be used individually and can be combined to increase safety.
This paper addresses the dependability analysis and evaluation of AHS and VBB applications, based in particular on Stochastic Activity Networks (SAN [2]).
This formalism and the associated Möbius tool [3] provide compositional operators that are useful to master the complexity of the models, both at model construction and model processing phase. In particular, the system model can be built by the composition of atomic models using Join and Replicate operators.
A platoon is a series of coordinated vehicles moving in the same direction on a highway [4], controlled by the vehicle at the head of the platoon (leader). The vehicles are driven by more or less automated agents, interacting in a multi-agent environment [5]. Switching to manual driving is possible under specific circumstances. The application combines vehicle data with position and map data. Longitudinal control of the vehicle is provided in order to maintain the short-range headway following within a platoon (similar to adaptive cruise control). Lateral control via automated steering provides lane-keeping and lane-change manoeuvres of platoon vehicles in a coordinated manner. In case of a failure in one vehicle, a well defined set of manoeuvres are used to help the failed vehicle to leave the platoon and to preserve the safety of the other vehicles. Our work is aimed at quantifying the impact of some characteristics of the AHS (e.g., the coordination strategy, the failure rates, the platoon length, and the trip duration) on the highway safety.
In the VBB application, periodically, historical data items about the vehicle s state (speed and movements of the vehicle, actuation of brakes, direction indicator, light, and throttle position(s), etc.) are recorded. Due to the limited storage facilities within the vehicle, and to the fact that in case of an accident the data stored on the vehicle can be lost, the VBB is resident on the fixed infrastructure. To increase the availability of the VBB, the data related to the concerned vehicle, referred to as the Vehicle, is replicated temporarily on vehicles encountered by the Vehicle, referred to as participant vehicles (or participants), using data replication strategies. Our work is aimed at evaluating the availability of the data in the VBB, taking into account possible data replication strategies, and various mobility scenarios characterized by the rates at which connections occur with the fixed infrastructure and between the vehicles in the ad-hoc domain.
Section 2 of this paper is dedicated to the AHS safety while Section 3 is devoted to VBB data availability. Section 4 concludes the paper.
2. Platooning Application
We consider the architectures developed in the context of the PATH project (Partners for Advanced
Transit and Highways) [6]. These architectures
implement recovery manoeuvres to ensure the platoons safety in the presence of different types of failures affecting the vehicles and their environment. To this end, they require coordination between the vehicles in the platoon (intra-platoon) and with neighbouring platoons (inter-platoon). Various communication models (centralized and decentralized) have been proposed in [7] for the
inter- and intra-platoon coordination, based on the
PATH architecture. In our work we have considered the four strategies resulting from the combination of the above models, given in Table 1.
Table 1: Coordination strategies considered
Strategy Inter-platoon model Intra-platoon model
DD Decentralized Decentralized DC Decentralized Centralized CD Centralized Decentralized CC Centralized Centralized
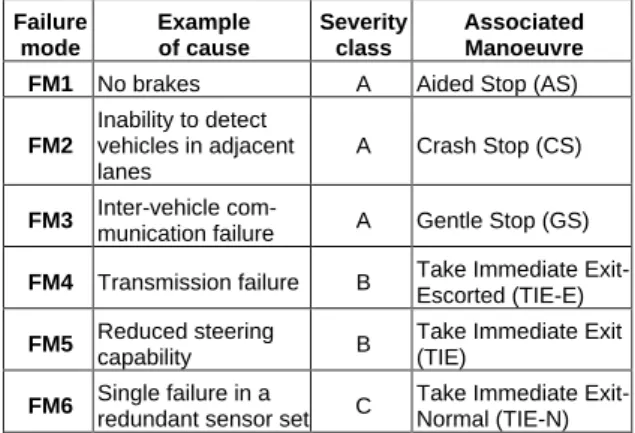
Several failure modes, can affect the vehicles involved in platoons and their safety [4,13]. In our work, we have considered six potential failure modes that may affect a single vehicle, presented in Table 2. This table shows for each failure mode, an example of cause, the severity class, and the maneuver that ensures the safe continuity of service despite the presence of failures.
Table 2: Failure modes and associated manoeuvres
Failure mode Example of cause Severity class Associated Manoeuvre FM1 No brakes A Aided Stop (AS)
FM2 Inability to detect vehicles in adjacent lanes A Crash Stop (CS) FM3 Inter-vehicle
com-munication failure A Gentle Stop (GS)
FM4 Transmission failure B Take Immediate Exit-Escorted (TIE-E)
FM5 Reduced steering
capability B
Take Immediate Exit (TIE)
FM6 Single failure in a
redundant sensor set C
Take Immediate Exit-Normal (TIE-N)
The severity classes are ranked by decreasing order. Class A is the highest, gathering the most critical failures that need to stop the vehicle on the
highway. Three manoeuvres are defined: Gentle
Stop (GS, the faulty vehicle uses its brakes smoothly to stop), Crash Stop (CS, the faulty vehicle uses maximum emergency braking), and Aided Stop (AS, the faulty vehicle is stopped by the vehicle immediately ahead). Specific control laws are then
used to ease congestion, divert traffic away from the incident, assist emergency vehicles, and get the queued vehicles out.
The B and C severity classes include the failure modes that can be recovered by allowing the faulty vehicle to get out of the highway without stopping the traffic. The corresponding manoeuvres can be achieved either without assistance or with the cooperation of some adjacent vehicles. Three manoeuvres are defined too: Take Immediate
Exit-Escorted (TIE-E), Take Immediate Exit (TIE), Take Immediate Exit-Normal (TIE-N).
It is noteworthy that the severity class also determines the priority of the corresponding manoeuvre. In case of occurrence of multiple failure modes in the same vehicle, the manoeuvre with the highest priority is applied. The successive failure of maneuvers may eventually lead to a state where no maneuvers are available to recover the faulty situation. This is illustrated by the state machine in
Figure 1, where v_KO identifies such a state. The transitions correspond to the occurrence of failure modes, or to the results of maneuver executions that might succeed (transitions to the safe state, v_OK) or fail (KO transitions). Whether state v_KO
corresponds to an unsafe state for the AHS or not, depends on the state of the adjacent vehicles.
Figure 1: Failure modes, manoeuvres, safety impact
When nearly simultaneous failures affect multiple vehicles, in particular adjacent vehicles, in the same platoon or in neighbouring platoons, the manoeuvre with the highest priority is applied. The success of a manoeuvre depends on many factors, for example, the state of faulty vehicles in the platoon, the capability of the adjacent vehicles needed to assist the faulty vehicle to realize the manoeuvre (particularly the leaders concerned by the manoeuvre), and the traffic flow.
Based on the analysis presented in [9], we summarize in Table 3 three catastrophic situations that would lead the AHS to an unsafe state, taking
into account the number of failures affecting adjacent vehicles and their severity.
Table 3: Catastrophic situations
Situation Description
ST1 At least two Class A failures
ST2
At least one Class A failure AND { (two Class B failures)
OR (one Class B AND one Class C failures) OR (three Class C failures) }
ST3 At least four failures whose severities correspond to Class B or Class C
The evaluated measure, S(t), corresponds to system unsafety, where t is the time. It is given by the probability that the system is in one of the above catastrophic situations.
2.1 Safety modelling
We consider a two lane AHS with one platoon in each lane. Vehicles in each platoon can change from one platoon to the other one freely. Each platoon contains up to N vehicles. We model this system, taking into account the four coordination strategies of Table 1, the six failure modes and the associated manoeuvres presented Table 2, and the catastrophic situations of Table 3.
As discussed in Section 2, several factors need to be considered when analyzing the impact of failures on the safety of an AHS. In particular, the success or failure of a recovery manoeuvre depends on the state of the adjacent vehicles contributing to the manoeuvre. Thus, the models also describe the configuration of the platoons as well as their dynamic evolution.
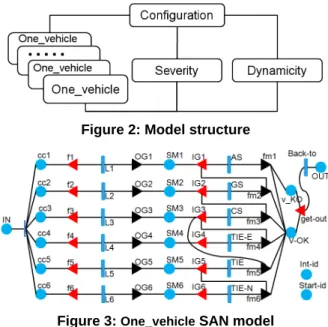
Figure 2 shows the overall structure of the model describing the AHS composed of two lanes. The model includes 2N replicas of the One_vehicle sub model that are composed with the Configuration,
Dynamicity, and Severity submodels. The One_vehicle
submodel describes the behaviour of a vehicle as resulting from its failure modes and the manoeuvres presented in Table 2. The Severity submodel describes the impact of multiple failures affecting several vehicles. The sub model Dynamicity models the dynamics of the system in the absence of failures, resulting from join and leave events that correspond to vehicles entering or getting out of the highway. The Configuration submodel initializes the other submodels and synchronizes their evolution according to the whole system evolution.
For illustration purpose, we show in Figure 3 the SAN of One-vehicle. The other models are given in [10].
The model consists of six interconnected elementary SANs; each of which models the occurrence of a failure mode for a given class of severity and the
associated manoeuvre. An elementary SAN consists of: i) two places (CCi, SMi), ii) two input gates (fi, IGi), iii) two output gates (OGi, fmi), and iv) two timed activities (Li, manoeuvre). This model is replicated 2N
times (i.e., one model for each vehicle). Places CCi
are local to each sub model. Each place CCi receives one token when a vehicle enters the platoon (i.e., place IN is marked). Place Int_id saves the ID of each vehicle in the system. Place Start_id is used for the initialization of the submodel.
Figure 2: Model structure
Figure 3: One_vehicle SAN model
Place CCi identifies the initial state from which the failure mode described by timed activity Li with firing rate i could be fired. The occurrence of the failure
mode activates the associated manoeuvre (place
SMi is marked). The selection of the appropriate manoeuvre (TIE-N, TIE, TIE-E, GS, CS, or AS) depends on its priority compared to other manoeuvres that might be already active, and on the state of the adjacent vehicles contributing to the manoeuvre. The predicates and the functions associated with the input gates IGi and the output gates fmi manage the priority of manoeuvres as defined in Table 2 and check the marking of places
SMi of the adjacent vehicles, according to the coordination strategy presented in Table 1. When a higher priority manoeuvre is activated, all lower priority manoeuvres associated with the same vehicle are inhibited. The execution times of the manoeuvres are described by exponentially distributed timed activities with firing rates ( TIE-N, TIE,
TIE-E, CS, GS, and AS).
If the manoeuvre succeeds, place v_OK is marked to indicate that the vehicle gets out of the platoon safely. The manoeuvre failure leads the vehicle to start the next higher priority manoeuvre. Eventually, if the manoeuvre in highest priority AS fails, v_KO is
marked, and the vehicle becomes a free agent (this is not represented in the model because it will constitute a third platoon). The two platoons continue their way without this vehicle.
When a vehicle gets out of the platoon by reaching one of the places v_OK or v_KO, another vehicle could join the system. This is modelled through the timed activity Back_to and the marking of place OUT.
2.2 Examples of Results
We illustrate the type of results obtained from the processing of the SAN models. The analyses focus on the impact on S (t) of the failure rates associated with the failure modes, the maximum number of vehicles per platoon, the trip duration, and the AHS coordination strategies.
We assume that all the processes represented by timed activities in the SAN models have exponential distributions (i.e., have constant occurrence rates). Let be the smallest failure rate. To facilitate sensitivity analyses, the values of the failure rates i
associated with the six failure modes FMi identified in Table 2 are expressed in terms of . In this paper, considering the contribution of all sources of failures that can lead to the considered failure mode, we have used the following values:
6= 4 ; 5=3 ; 4=2 ; 3=2 ; 2=2 ; 1= .
The values of execution rates associated with the manoeuvres ( TIE-N, TIE, TIE-E, CS, GS, AS) range
from 15/hr and 30/hr (manoeuvre durations between 4 and 2 minutes).
We suppose that the two highway lanes start initially with N vehicles in each platoon (platoon1 and
platoon2). At any time each vehicle can change from its platoon to the other one, with constant change rates. We consider the same numerical values for the two change rates equal to 6/hr.
The numerical values used are inspired from real life similar situations. However, these values can be easily modified. The results have been obtained, using the simulator provided by the Möbius tool. Each point of the graphs has been computed as a mean of at least 10000 simulation batches, converging within 95% probability in a 0.1 relative interval. Actually, the total number of simulation batches mainly depends on the value of the failure rate considered.
Figure 4 shows the impact of N, the maximum number of vehicles per platoon on S (t), for trip durations varying from 2 to 10 hours. For a given N, the probability of reaching the unsafe state increases by one order of magnitude when the trip duration goes from 2 to 10 hours.
For a given trip duration, increasing N leads to a significant increase of S (t). For example, from N=8
to N=12, the unsafety is one order of magnitude higher, for a 10 hour trip duration.
Figure 4: S (t) for different platoon lengths, N
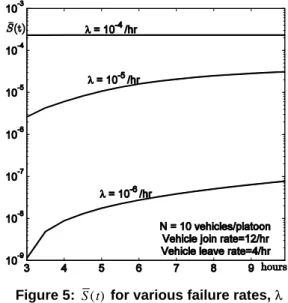
The impact of the failure rate, , is illustrated in Figure 5. We notice that the probability of reaching an unsafe state is very sensitive to the value of . For example, increasing from 10-6/hr to 10-5/hr, leads to an increase of unsafety of about 175 times, for a trip duration of 6 hours. The variation of system unsafety is lower (about 40 times) when increasing from 10-5/hr to 10-4/hr for the same trip duration. Also, it can be noticed that the sensitivity of S (t) to the trip duration is higher for lower values of . For =10-4/hr the steady state is reached very quickly. For a 2 hour trip duration, the unsafety is almost 10-12 for =10-6/hr. This is why the corresponding result is not plotted.
Figure 5: S (t) for various failure rates,
The results in Figures 4 and 5 correspond to the case of a decentralized inter- and intra-platoon
coordination strategy (DD). Figure 6 compares the unsafety for the four strategies in Table 1: DD (Decentralized inter- and intra-platoon) DC (Decentralized inter-platoon and Centralized intra-platoon), CD (Centralized inter-platoon and Decentralized intra-platoon), and CC (Centralized and intra-platoon). We can see that the inter-platoon strategy has more impact than the intra-platoon, with a higher safety observed for the decentralized inter-platoon strategy. This is due to the fact that more vehicles are involved in the centralized inter-platoon.
Figure 6: S (t) and coordination strategy
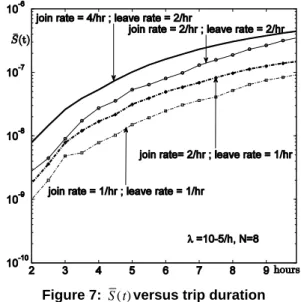
Actually, the system unsafety should depend on the number of vehicles in each platoon that might be affected by failures. The number of vehicles depends on the frequency at which vehicles join and leave the platoon. In order to have a better understanding of the combined influence of the join and leave rates, we analyze the evolution of system unsafety as a function of the load of the platoon =
join rate leave rate. The results are plotted in Figure 7 with different values for the join and leave rates. It is interesting to see that similar trends are observed for all the curves, with the highest unsafety observed for the highest join rate. Comparison of the results corresponding to different values of and a fixed value of the leave rate shows that the highest value leads to the highest level of unsafety. However, the results are of the same order of magnitude.
2.3 Concluding comments
The results obtained for the AHS application provide some indications about the optimal size of platoons and the maximum trip duration, as well as the most suitable coordination strategy of the platoons that lead to better safety. For instance, for the parameters considered in our study, the size of the platoons should not exceed 10, which is
consistent with the numbers considered in experimental tests, as reported in [6] for example. Another interesting result concerns the coordination strategy: the best results are obtained for decentralized coordination strategies both for inter and intra-platoon communications.
Figure 7: S (t)versus trip duration
3. Virtual Black-Box Application
The impact of mobility on the dependability of a vehicular application is further investigated in the context of the Virtual-Black Box (VBB) application. We consider the case where a vehicle periodically and almost continuously collects data items in the form of records. A record gathers information related to the Vehicle speed and movements, actuation of brakes, direction indicator, light, throttle position(s), etc. From a practical point of view, the last successive data records generated during the last 15 to 30 seconds before the accident form a full set of data allowing tracing back the accident. Let z be the number of records during this period of time. As the data is updated very frequently, the loss of a small number of data records, among this full set of data, may not affect significantly the accuracy of the collected information. Particularly, when we need to understand what had happened just before the occurrence of an accident, it could be sufficient to analyse only r records among the last z records generated before the accident.
Primarily, the records are stored in the Vehicle itself, before being delivered to the fixed infrastructure as soon as a service access point is encountered to complement and update the historical data already recorded in the VBB. Between two updates, the most recent information that is critical in case of an accident is only in the Vehicle itself, and there is a high probability that it will be lost due to the accident. The idea is to take advantage of surrounding
vehicles encountered (participant vehicles) to replicate safely the data before being transmitted to the fixed infrastructure. The temporary data can be transmitted to the fixed infrastructure either by the Vehicle or by the participant vehicles.
Replication of the data records may be handled either by creating full copies of the records (we refer to this as replication by duplication) or by more sophisticated mechanisms using a replication by
fragmentation strategy to protect the data records
against accidental as well as malicious threats, in the same way as in [11].
The replication by fragmentation strategy is based
on the erasure coding techniques that are well suited to ensure data availability and confidentiality in the presence of permanent failures [12, 13]. Let us consider a data record collected by the Vehicle at a given time that must be saved at the fixed infrastructure via some participant vehicles. An erasure coding algorithm with parameters n and k (n k), produces n fragments of the original record that are scattered among participant vehicles. An optimal erasure code allows (n k) failures (or erasures) to be tolerated (beside that of the primary replica), i.e., k fragments are necessary and sufficient to recover the original data record [13]. Wherever a participant vehicle gains access to the fixed infrastructure, it transfers all the data fragments that are replicated on its storage facilities. In particular, in case of an accident, it is expected that all the fragments on the participant vehicles will eventually be delivered to the fixed infrastructure to be used for the analysis.
We consider that every encounter between vehicles offers a storage opportunity. Specially, every vehicle encountered is considered to be a participant vehicle that unconditionally accepts storage requests from the Vehicle. The Vehicle unconditionally sends one data fragment to each vehicle encountered. Note that scenarios in which not all encounters offer storage opportunities (e.g., with vehicles refusing to cooperate) can be simply modelled by introducing a participant/encounter ratio as an additional parameter.
Replication by duplication of the data corresponds
to the case n=k=1.
We analyse the unavailability of the VBB application
via the evaluation of the probability of data loss, i.e.,
the asymptotic probability, noted UA, of reaching a state where more than r data records among z records generated during a certain time interval are lost before being delivered to the fixed infrastructure. The data availability clearly depends on the mobility of the vehicles and their connectivity dynamics, in particular, the rate at which the vehicles meet (i. e., the vehicle encounter process) and the rate at which they meet an access point of the fixed infrastructure.
Several studies have been carried out to analyse the vehicle encounter process using simulation, real-traces or analytical proofs [14-16]. They show that there are still different opinions about which of the two distributions (Pareto or exponential) applies for describing the vehicle encounter process. Thus, in this paper we consider both cases: the vehicle-to-vehicle encounter process follows an exponential or a Pareto distribution.
With respect to the process that models the connection of a vehicle to the fixed infrastructure, [15] shows that this process can be modelled by an
exponential distribution, in urban networks. A similar
conclusion is derived in [14] for highways. Hence, we consider that the vehicle-to-infrastructure encounter process follows an exponential distribution.
3.1 Availability modelling
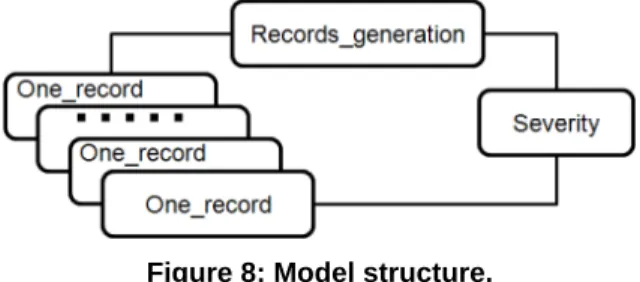
Figure 7 shows the overall structure of the model describing the VBB application. The model includes
z replicas of the One_record sub model that are
composed with two other sub models: Records_generation and Severity. The One_record sub model describes the behavior of a record as resulting from its data loss modes and the associated data replication strategy presented in Section 3. The Severity sub model describes the impact of multiple data losses of data records in the system. The sub model Record_generation is used to model and manage the records generated by the Vehicle in the absence of data loss, to initialize the other sub models and to synchronize their evolution according to the whole system evolution.
As for the AHS, we detail only one submodel, corresponding to the One-record model in Figure 9, the other models are given in [17].
Figure 8: Model structure.
Figure 9 focuses on the vehicular ad-hoc part of the VBB application, purposefully ignoring issues related to the implementation of the fixed infrastructure functionalities. Thus, one fragment of one disseminated record is considered safe (i.e., it cannot be lost) whenever either its creator the Vehicle or a participant vehicle storing it is able to access the fixed infrastructure. In other words, the server of the fixed infrastructure of the VBB application is assumed to be very reliable (i.e., it has
enough redundancy and fault tolerance to ensure a very low failure rate that can be neglected).
Finally, we assume that when a participant vehicle fails before reaching the fixed infrastructure, all the fragments it holds are lost. Thus, with (n,k) erasure coding, one record is definitely lost if and only if the record on the Vehicle is lost and less than k fragments of the data record are available on the participants and at the fixed infrastructure.
The One_record model in Figure 9 consists of three main processes represented by timed activities:
A: the vehicle-to-vehicle encounter process; depending on the considered mobility scenario, A is either modelled by an exponential distribution with a constant rate or by a Pareto distribution with parameters p and s.
B: the vehicle-to-infrastructure encounter process, represented by (Bv, Bp) with rates . Bv is for the Vehicle and Bp is for the participants. D: the data loss process, at the Vehicle (Dv) and the participants side (Dp); both have exponential distributions with constant rate .
The model is divided into two interacting subnets. The subnet on the left describes the evolution of a data record at the Vehicle side: either it is lost, with rate (activity Dv), or it reaches the fixed infrastructure, with rate (activity Bv). Places one_record_created and OD denote situations where the data record on the Vehicle is available or is lost, respectively. When a record is created, the place one_record_created will be marked with one token (see Records_generation submodel).
The subnet on the right describes: (i) the data encoding process with an erasure code (n,k) leading to the creation of fragments (place MF) on participant vehicles as they are encountered (activity A ), and (ii) the process leading to the storage of the fragments (place SF) at the fixed infrastructure (rate activity Bp ), or its loss caused by the failure of the participant vehicle (rate activity Dp ). Place FC initial marking denotes the number of fragments to create (n). The rates associated with the loss of a fragment or its storage on the fixed infrastructure are weighted by the marking of place MF, i.e., the number of fragments that can enable the corresponding activities. The timed activity A will be fired when the place one_record_created is marked and still there are fragments to distribute to participants (i.e., place FC marked). This is managed by the predicates in the input and output gates, IA and OA, respectively. The firing of activity A decrements the marking of place FC by one, increments the marking of place MF by one, and without affecting the marking of place one_record_created.
Figure 9: One_record SAN model.
Two places with associated immediate activities (T_DS, T_DL) are used in the sub model to identify when the data record is safely stored in the fixed infrastructure (place DS), or is definitely lost (place DL), respectively. The data safe state is reached (i.e., DS is marked) when the original data record from the Vehicle or at least k fragments from the participants reach the fixed infrastructure. The data
loss state is reached (i.e., DL is marked) when the
original data record from the Vehicle is lost, and less than k fragments are available on the participants and at the fixed infrastructure side. This condition is represented by a predicate associated with the input gate (T1). Finally, the predicates and the functions associated with the output gates (OBv, ODp, OBp) and the input gates (DBv, DBp, T2) manage the sub model by applying liveliness predicate , true if and only if DS and DL are not marked (m(DS)=m(DL)=0); as soon as one of these places is marked, no activity can be fired in this submodel.
Place Rec_id saves the ID of each data record generated in the system. Place Start_id is used for the initialization of the sub model (i.e., a new One_record is generated). When the place DL is marked for an One_record submodel and still the system generating the records is available, another record will be generated by adding one token to the place Start-id.
3.2 Examples of results
The analyses focus on the impact of the parameters summarized in Table 4. We will first address the unavailability of one data record, and then we will address the VBB unavailability.
Table 4: Parameters used for modelling VBB
The vehicle-to-vehicle encounter rate The vehicle-to-infrastructure encounter rate c The connectivity ratio =
Data loss rate, for the Vehicle and participants
n, k Parameters of the erasure code
r, z The accuracy required of the historical data to
analyse what happened when an accident occurs
Figure 10 shows the unavailability of a single data record as a function of the data loss rate , in the case of: i) the replication by duplication strategy (n=k=1) when the vehicle-to-vehicle encounter process is described by either an exponential or a
Pareto distribution, and ii) without replication in the ad-hoc domain n=k=0; (i.e., the data record is stored
on the Vehicle until it is delivered to the fixed infrastructure when an access point is encountered).
Figure 10: Data record unavailability
The values assigned to parameters p and s of the
Pareto distribution are such that the mean time
between encounters is equal to 1/ , the mean of the
exponential distribution to which it is compared.
Figure 10 has a log-Log scale. The linear increase of UA for increasing values of induces a power law relationship between these two quantities. Also, it can be observed that the unavailability is impacted by the connectivity ratio c characterizing the mobility scenario. This figure shows that even for low values of c, replication decreases significantly the data record unavailability.
Figure 11 highlights the impact of the replication strategy on the unavailability of one data record for an exponential vehicle-to-vehicle encounter process (similar results are obtained for the Pareto case). It compares the unavailability associated to the
replication by duplication strategy (denoted UA(1,1)) to the unavailability associated to the replication by fragmentation strategy using an erasure code (n ,k) (denoted UA(n,k)), through the ratio UA(1,1)/UA(n,k).
Figure 11: Impact of the replication strategy
It can be noticed that the unavailability decreases as
n and k increase. Also, it appears that the potential
gain yielded by the use of an erasure code compared to replication by duplication is rather modest (less than 2 times in the most favourable case). It should be mentioned that a noticeable advantage of erasure codes over the replication by duplication is the fact that they are generally used to ensure security related properties too, in particular confidentiality. The higher is k the better is the confidentiality. However, the assessment of these properties is not the focus of this paper.
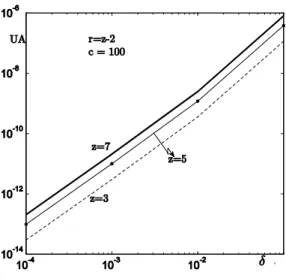
The impact of the variation of z (the last records generated before the accident) and r (the number of records among z that could be sufficient to analyse the causes of the accident) on the VBB unavailability is illustrated in Figure 12. It shows that the higher is
z the higher is the unavailability and the difference is
significant (e.g., the unavailability corresponding to (z=7, r=5) is 7 times higher than the unavailability with (z=5, r=3) when = 10-3/h).
Figure 13 shows that the potential gain due to replication is significant. The maximum gain is obtained in the case of exponential vehicle-to-vehicle encounters for c=100. This figure also shows that the distribution of the vehicle-to-vehicle encounters (exponential or Pareto) has a significant impact too.
Figure 12: Impact of z on VBB unavailability
Figure 13: Replication by duplication
3.3 Concluding comments
The results obtained show that the VBB application exhibits different levels of availability when considering mobility scenarios with Pareto or exponential distributions, depending on the value of the connectivity ratio in the corresponding environment. Another noteworthy result concerns the availability gain yielded by the data replication in the
ad-hoc domain compared to the case where such a
replication is not used. The unavailability can be decreased thanks to replication by a factor up to the connectivity ratio (100 in our study) when considering a single data record. This result confirms the conclusion derived in [18] and shows that it is also valid in mobility environments where vehicle-to-vehicle encounter process follows a Pareto distribution. Moreover, our study shows that the gain brought by replication can be significantly high.
4. Conclusion
This paper presented two case studies from the automotive domain that relies on mobile communication technologies and mobile ad-hoc networks to improve the safety or the availability of the service delivered to the users. A challenging problem when modelling such applications is to take into account in an integrated way: i) the failure modes affecting the vehicles, their severity level, and the associated recovery mechanisms, i) the vehicle coordination strategies, and ii) the dynamics of the systems resulting from their mobility.
We focussed on the dependability modelling of the corresponding applications to evaluate quantitative measures that can be used by the designers to perform sensitivity analyses and to highlight the impact of relevant design parameters and of the applications environment.
We have applied a similar approach based on stochastic activity networks for the modelling of the platooning and the VBB applications investigated in this paper. The dependability modelling approach has been designed to master the complexity of the models taking into account the dynamic evolution of the corresponding systems. The system model is elaborated based on submodels characterizing the vehicles behavior resulting from failures, that are then replicated and composed with other submodels describing the system configuration and its dynamic evolution. Such evolution results from vehicles joining and leaving the network of communicating vehicles involved in the application.
The feasibility and the flexibility of the proposed approach was illustrated by considering different dependability measures highlighting various facets of the considered applications related to safety and availability, as well as different dependability mechanisms, coordination strategies and mobility scenarios. Various examples are also presented to illustrate the kind of results and sensitivity studies that can be achieved.
The models presented in this paper can be extended to analyze more complex use cases and mobility scenarios. In such a context, the combination of different types of formalisms and evaluation techniques including analytical models, simulation and experimental measurements might be needed in order to provide detailed evaluations of end-to-end scenarios taking into different decomposition and abstraction levels of the system. An example of a holistic approach following these directions is presented in [19]).
5. Acknowledgements
This work was partially supported by the HIDENETS project (Highly DEpendable ip-based NETworks and Services), EU-IST-26979,http://www.hidenets.aau.dk/.
6. References
[1] M. O. Killijian, M. Roy, G. Severac, and C. Zanon, "Data backup for mobile nodes: a cooperative middleware and experimentation platform," Workshop on Architecting Dependable Systems (WADS), supplemental volume of DSN-09, Lisbon (Portugal), pp. 6, 2009.
[2] W. H. Sanders and J. F. Meyer, "Stochastic activity networks: Formal definitions and concepts," In Lectures on Formal Methods and Performance Analysis, pp. 315-343. Springer Verlag, 2001.
[3] D. Daly, D. D. Deavours, J. M. Doyle, P. G. Webster, and W. H. Sanders, "Möbius: An extensible tool for perfomance and dependability modeling," In 11th International Conference, TOOLS 2000, vol. Lecture Notes in Computer Science, pp. 332-336, Schaumnurg, IL B.R. Haverkort, H. C. Bohnenkamp, and C. U. Smith (Eds.), 2000.
[4] D. N. Godbole, J. Lygeros, E. Singh, A. Deshpande, and A. E. Lindsey, "Towards a Fault Tolerant AHS Design Part II: Design and Verification of Communication Protocols," Institute of Transportation Studies, University of California, Berkeley, Paper UCB-ITS-PRR-96-15 1996.
[5] S. Hallé and B. Chaib-draa, "Collaborative Driving System Using Teamwork for platoon formations." New York, USA: Proceedings of AAMAS-04 Workshop on Agents in Traffic and Transportation, 2004, pp. 35-46.
[6] M. Miller, "PATH: Societal and Institutional Issues of Automated Highway Systems," Intellimotion Paper News, vol. vol. 6 (3), 1997.
[7] S. Hallé, "Automated Highway Systems: Platoons of Vehicles Viewed as a Multiagent System." in Faculté des études supérieures de l Université Laval, Québec, M.Sc., pp.194, 2005.
[8] J. Lygeros, D. N. Godbole, and M. Broucke, "Towards a Fault Tolerant AHS Design Part I: Extended Architecture," Institute of Transportation Studies, University of California, Berkeley, PATH Technical Report UCB-ITS-PRR-96-14 1996. [9] J. Lygeros, et al., "Design of an Extended
Architecture for Degraded Modes of Operation of IVHS," presented at American Control Conference, UCB-ITS'PWP'95'3, 1995.
[10] O. Hamouda, M. Kaâniche, and K. Kanoun, "Safety Modeling and Evaluation of Automated Highway Systems," The 39th Annual IEEE/IFIP international conference on Dependable Systems and Networks (DSN-09), Lisbon, Portugal, pp. 73-82, 2009.
[11] L. Courtès, M.-O. Killijian, and D. Powell, "Storage Tradeoffs in a Collaborative Backup Service for Mobile Devices," Proc. of the 6th European Dependable Computing Conf., IEEE CS Press, pp. 129-38, 2006.
[12] H. Weatherspoon and J. Kubiatowicz, "Erasure-Coding vs. Replication: A Quantitative Comparison," Revised Papers from the 1st International Workshop on P2P Systems, pp. 328-338, Springer-Verlang, 2002.
[13] L. Xu, V. Bohossian, J. Bruck, and D. G. Wagner, "Low Density MDS Codes and Factors of Complete Graphs," IEEE Transactions on Information Theory, vol. vol. 45 (1), pp. 1817-1826, 1999.
[14] O. Hamouda, M. Kaâniche, E. Matthiesen Moller, J. Gulddahl Rasmussen, and H.-P. Schwefel, "Connectivity Dynamics in Vehicular Freeway Scenarios," Proceedings of the Second international conference on Global Information Infrastructure Symposium, Hammamet, Tunisia, pp. 365-372, 2009.
[15] T. Spyropoulos, A. Jindal, and K. Psounis, "An Analytical Study of Fundamental Mobility Properties for Encounter-based Protocols," International Journal of Autonomous and Adaptive Communications Systems, vol. vol. 1 (1), pp. 4-40, 2008.
[16] T. Karagiannis, J.-Y. Le Boudec, and M. Vojnovic, "Power Law and Exponential Decay of Inter Contact Times between Mobile Devices," Proc. of the 13th annual ACM international conf. on Mobile computing and networking, 2007. [17] O. Hamouda, M. Kaâniche, and K. Kanoun,
"Availability Modelling of a Virtual Black Box for Automotive Systems," 2nd International Workshop on Software Engineering for Resilient Systems, London, United Kingdom, 2010.
[18] L. Courtès, O. Hamouda, M. Kaâniche, M.-O. Killijian, and D. Powell, "Dependability Evaluation of Cooperative Backup Strategies for Mobile Devices," Proc. of the IEEE Int. Symp. on Pacific Rim Dependable Computing, 2007.
[19] HIDENETS, "HIghly Dependable ip-based NETworks and Services, Evaluation methodologies, techniques and tools (final version)," in Project Deliverable D4.1.2, IST-FP6-STREP-26979, 2007.