What sort of teenager has high intakes of energy and nutrients?
B Y D A V I D R. W O O D W A R D
Biochemistry Department, University of Tasmania, GPO Box 252C, Hobart, Tasmania 7001, Australia
(Received 20 November 1984 - Accepted 29 January 1985)
1. An alternative statistical technique, based on analysis of the 75th percentile, was used t o examine teenagers’ diets. The technique was developed to identify personal characteristics that affected the prevalence of high energy and nutrient intakes. It provided useful information not obtainable from methods based on average intakes.
2. The study sample was a representative sample of 1055 high-school students in Tasmania, Australia, aged 11-16 years.
3. Among girls, the prevalence of high intakes of energy and several nutrients was not affected by any of the fifteen characteristics studied. (In this context, ‘high’ was defined as above the 75th percentile for girls.) Fatter, heavier girls were less likely to have high intakes of carbohydrate, iron and niacin-equivalent, and also of meat and ‘empty-energy’ foods. Girls from small families were less likely to have high calcium intakes, and girls from goverment schools less likely to have high thiamin intakes.
4. Among boys, age generally had the greatest influence on the prevalence of high intakes (‘high’ being defined as above the 75th percentile for boys). Older boys were more likely to have high intakes of energy and most nutrients, as well as meat, cereals and fruit and vegetables. These age-related changes were, however, rather asynchronous. High fat intakes were more common among boys wbo had drunk more than five glasses of alcoholic beverages in the preceding week. High Ca intakes were more frequent among those who exercised vigorously, and high vitamin A intakes less common among the sons of well-educated mothers.
In previous papers (Woodward, 1984, 1985), the use of percentile-based analysis to study the diets of a large and representative sample of Tasmanian high-school students was described. First the identification of those personal characteristics that had the greatest influence on median intakes of energy and ten nutrients was sought (Woodward, 1984). Second a parallel approach was applied to identify characteristics influencing the 25th percentile of intakes, or (in equivalent terms) influencing the likelihood of low intakes (Woodward, 1985). The analysis based on the 25th percentile yielded useful information not revealed by the analysis based on average intakes.
An obvious extension was to look at characteristics influencing the likelihood of high intakes. The indicator chosen for high intakes was the 75th percentile, which may be viewed as the average of those with above-average intakes. Persons with intakes above the 75th percentile may be considered to have high intakes, by the standards of the population in question.
M A T E R I A L S A N D M E T H O D S
Students in grades 7-10 (modal ages 12-15 years) in Tasmanian high schools were sampled by a two-stage cluster technique. Subjects completed a 24 h dietary record (Woodward et
al. 1981) and a questionnaire on personal characteristics (Woodward, 1984). In all, 1055 students provided usable replies, a response rate of 81
% .
As far as could be ascertained, the respondents were representative of Tasmanian high-school students, and energy and nutrient intakes were consistent with those reported in other Australian surveys.The personal characteristics studied were of three types : physical (sex, age, height, weight, fatness), behavioural (exercise-level and usage of alcohol, cigarettes, analgesics and vitamin-supplements) and socio-economic (school type, educational level of each parent, social status, family size). For the statistical analysis, each of these characteristics was
326
D. R. W O O D W A R D
re-expressed as one or more explanatory variable (EV). For instance, the characteristic
height yielded two explanatory variables, the EV HI (which compared the shortest third
of the group with the taller two-thirds) and the EV H2 (which compared the tallest third
of the group with the others). A full list of the thirty-nine EV examined in the present study
is given in Table 1 of Woodward (1984).
In the previous papers, the analysis was based on assessing the impact of each EV on the
median or the 25th percentile of intakes. In the present paper, analysis was based on assessing the impact of each EV on the 75th percentile of intakes. Calculation of impacts
on the 75th percentile used the same method (the ‘median test’) as was used in the previous papers (Woodward, 1984, 1985), with one difference: the term ‘75th percentile’ was substituted for ‘median’ or ‘25th percentile’ throughout. (The statistical rationale for this modification is provided in Conover (1971).)
Using this criterion of impact, the analysis developed, for each nutrient, a hierarchical model of influences operating at the 75th percentile of intakes. The analysis followed the approach previously applied to median intakes in Woodward (1984), and to the 25th percentile of intakes in Woodward (1985).
As in the preceding papers (Woodward, 1984, 1985), statistical impacts are characterized as moderate (0.001 < P < O.Ol), strong (0.0001
<
P < 0-001) or very strong(I‘
< 0.0001). For some analyses, foods were grouped into five categories, which are defined in detail in Woodward (1984). These were:Cereal. This included ‘plain’ cereals, such as bread, low-sucrose breakfast cereals, plain
biscuits and scones; it also included butter and margarine spread thereon. Cereal products with substantial amounts of sucrose, such as cakes and puddings, were excluded. The 75th percentile of cereal intakes was 3.6 MJ for boys and 2.5 MJ for girls.
Fruit and vegetables. This included all such foods and their juices, except maize and dried
legumes; jams and fruit pies were excluded. Intakes were 2.9 and 2.5 MJ for boys and girls respectively.
Meat. This included all muscle and organ tissue of vertebrate and invertebrate origin as
well as eggs, nuts and legumes; pies and stews based on these were also included. Intakes were 3.8 MJ for boys and 2.8 MJ for girls.
Dairy. This included milk, cheese and yoghurt ; ice-cream and butter were excluded. Intakes were 2.5 MJ for boys and 2.1 MJ for girls.
Miscellaneous. This included all items not in the other four categories. Major items were
‘sweet’ cereals, confectionery and soft drinks, soups and sauces, alcohol, proprietary lines of the Milo (malted beverage) and Vegemite (yeast extract) type. Intakes were 3.6 MJ for boys and 3.0 MJ for girls.
R E S U L T S
As at the other percentiles studied, vitamin C was atypical. None of the thirty-nine EV
studied had a significant impact on the 75th percentile of vitamin C intakes.
High intakes were more common among boys
For energy and the remaining nine nutrients the EV sex was the dominant EV, with a very
strong impact. The 75th percentile of intakes was higher among girls than among boys. If we define intakes above the 75th percentile as ‘high’, then high intakes were more common among boys.
TO elucidate the food choices underlying this sex difference, the impact
of
the
EV
sex
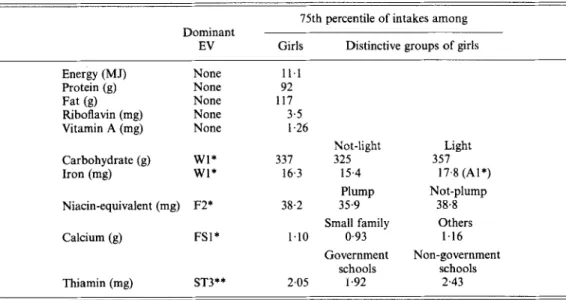
on the 75th percentile of intakes for five major food categories (defined above) was examined. The impact of sex was very strong for the dairy, meat and cereal categories, andTable 1. The 75th percentile of energy and nutrient intakes among girls in Tasmanian high
schools
(Light and plump girls each comprised 33% of the girls in our sample, those from small families 24%, and those from non-government schools 26%. Where anexplanatory variable (EV) appearsin parentheses, it was dominant for that substance in that distinctive group)
75th percentile of intakes among Dominant
EV Girls Distinctive groups of girls
Energy (MJ) None 11.1 Riboflavin (mg) None 3.5 Carbohydrate (g) w l * 337 325 357 Protein (g) None 92 Fat (g) None 117 Vitamin A (mg) None 1.26 Not-light Light Iron (mg) w l * 16.3 15.4 17.8 (Al*) Plump Not-plump Niacin-equivalent (mg) F2* 38.2 35.9 38.8 Calcium (g) FSI* 1.10 0.93 1.16
Small family Others
Government Non-government
schools schools
Thiamin (mg) ST3** 2.05 1.92 2.43
W1, weight 4 45 kg v. the rest; F2 fatness > 20.7 kg/m2 v. the rest; FSI,
<
one sibling v. the rest; ST3, Level of impact of EV: *0.001 i P i 0.01, **0.0001 i P < 0,001.government schools v. non-government schools; A l ,
<
12 years v. 3 13 years.moderate for fruits and vegetables and for miscellaneous foods. This suggested that the greater prevalence of high energy and nutrient intakes among boys was due to greater prevalence of high intakes of all food categories, especially the dairy, meat and cereal categories.
Among girls, various EV were dominant f o r the 75th percentile
Among girls, a dominant EV was identified for only five nutrients. Results are summarized in Table 1.
(1) Body size was dominant for three components. For niacin-equivalent, the dominant
EV was the contrast between ‘plump’ and other girls (Fl); this EV had a moderate impact on the 75th percentiles of miscellaneous and meat intakes as well. For iron and carbohydrate, the dominant EV was W1, the contrast between ‘light’ and other girls; it did not influence intakes of any food category.
Among the ‘light’ girls, the age-based EV A1 (the contrast
<
12 years v. 3 13 years) was dominant for Fe intakes. Those light girls who were 12 years or less (48% of the light girls) had a 75th percentile for Fe of 15.7 mg, compared to 18.0 mg for older light girls. However, the EV A1 did not have a significant impact on any food category.(2) Social background was dominant for calcium and thiamin. The dominant EV were
FS1 (the contrast between small and other families) and ST3 (government v. non-government schools) for Ca and thiamin respectively. Neither of these EV influenced any of the food categories.
328
D. R. W O O D W A R D
Table 2. The 75th percentile of energy and nutrient intakes among boys in Tasmanian
high schools
(Boys aged
<
12 years comprised 25% of boys, those<
13 years 49%, those<
14 years 72%. Boys who had drunk more than five glasses of alcoholic beverages in the preceding week comprised 14% ; those who exercised more than 2 h/d 16% ; those whose mother had post-secondary education 31 % . Where an explanatory variable (EV) appears in parentheses, it was dominant for that substance in that distinctive group)75th percentile of intakes among
Dominant EV Boys Distinctive groups of boys
<
12 years 3 13 years Energy (MJ) A l * 14.8 12.1 15.7 Protein (g) A t * 125 107 131 Carbohydrate (g) A l * 442 376 465 Riboflavin (mg) A l * 4.7 3.7 5.0 Niacin-equivalent (mg) A2*** 53.0 46.4 57.9<
13 years 3 14 yearsThiamin (mg) A2** 2.59 2.27 (A1 *) 3.00
Q 14 years
Not ‘heavier’ ‘Heavier’
drinkers drinkers
Not vigorous Vigorous
3 15 years
Iron (mg) A3*** 21.0 19.9 (Al**) 24.4
Fat (g) DR3*** 159 152 (H2*) 190 exercisers exercisers Calcium (g) EX4* 1.50 1.49 1.55 Well-educated Less-educated mother mother Vitamin A (mg) EM2* 1.61 1.46 1.71
A l , Q 12 years v. 3 13 years; A2,
<
13 years v.>
I4 years; A3,<
I4 years v. 3 15 years; DR3,<
five glasses of alcoholic beverages in the pevious week v. the rest; EX4,<
2 h exercise/d v. the rest; EM2, mother educated past high-school level v . the rest; H2, > 1.67 m v . the rest.Level of impact of EV: *0.001 < P < 0.01, **0.0001 < P i 0.001, * * * P i 0.0001.
Among boys, various EV were dominant at the 75th percentile
(1) Age-based EV were dominant for energy and six nutrients (Table 2). High intakes became more prevalent as boys became older, but the exact EV identified as dominant varied, being A1 (< 12 v. 3 13 years), A2 ( < 13 v . 3 14 years) or A3 ( < 14 v. 3 15 years) for different dietary components.
To elucidate why the dominant EV varied, graphs of the 75th percentile v. age were examined for each component. Those components for which A1 was dominant, e.g. energy, showed an early sharp increase followed by a relative plateau. Those for which A2 was dominant, e.g., thiamin, showed a fairly steady increase over the age range studied. Fe, for which A3 was dominant, showed a distinctive pattern with two phases of rapid increase separated by an intervening plateau.
To explore the food choices underlying these patterns, the impacts of the three age-related EV (Al, A2 and A3) on the 75th percentiles of the five food categories were tested. The EV A1 influenced intakes of fruits and vegetables and meat, moderately; A2 influenced fruits and vegetables and cereals, both moderately; A3 influenced cereals, strongly. None of the age-related EV influenced intakes of the dairy or miscellaneous categories.
329
Thus, the age-related changes in energy and nutrients were accompanied by changes in three food categories. The increase in the prevalence of high energy, protein, carbohydrate and riboflavin intakes with age seemed linked mainly to changes in meat and fruit and vegetable intakes. The increase in thiamin and niacin-equivalent seemed linked to cereals and fruits and vegetables, and the increase in Fe to cereal intakes.
For thiamin and Fe, an age-related EV (Al) proved dominant among younger boys. It was dominant for thiamin among boys
<
13 years, with values of 2.1 1 mg for those aged<
12 years and 2.49 mg for those aged 13 years; A1 had no impact on any food category among boys<
13 years. It was dominant for Fe among boys<
14 years, with values of 17.9 mg for boys<
12 years and 20.9 mg for boys aged 13-14 years; A1 had a moderate impact on fruits and vegetables among boys<
14 years.(2) An EV based on alcohol consumption (DR3, the contrast between those who drank more than five glasses in the previous week and the remainder) was dominant for the 75th percentile of fat intakes, with a very strong impact. High fat intakes were more prevalent among boys who had drunk more than five glasses of alcoholic beverages in the preceding week. The ‘heavier’ drinkers were also more likely to have high intakes of the meat and miscellaneous categories, the impact of DR3 on those categories being moderate.
Among the heavier drinkers, height (H2, the contrast between the tallest third and the rest) was dominant for fat and also influenced the cereal category; for both, the impact was moderate. (The cereal category included the butter and margarine spread on bread.) Heavier drinkers who were taller than 1.67 m (33% of this group) had a 75th percentile of 185 g, compared with 143 g for their less-tall colleagues.
(3) Exercise (EX4, vigorous v. the rest) was dominant for Ca, but did not influence any food category.
(4) Mother’s educational level (EM2, post-secondary v. the rest) was dominant for vitamin A, but did not influence any food category.
D I S C U S S I O N
Previous papers in this series (Woodward, 1984, 1985) have argued the usefulness of the median and the 25th percentile as summary statistics in dietary surveys. A similar case may be made for the 75th percentile. It is easily calculated and has a simple and obvious interpretation, in that only 25% of individuals have intakes that are higher. Alternatively, one may view it as the average of those with above-average intakes, so that those above it are considered to have high intakes by the standards of the population being examined. Whether such intakes are high in relation to physiological requirements is, of course, a separate question.
Other studies have used the 75th percentile as a convenient summarizing statistic (Samuelson, 1971; van Schaik & Kenter, 1973; United States National Center for Health Statistics, 1979; Darke et al. 1980). The present paper, however, has taken the 75th percentile as the target for detailed statistical analysis, using esssentially the same analytical procedure as was used in earlier papers (Woodward, 1984,1985) for other percentiles. This approach has provided some insight into the types of teenagers who are more likely to have high intakes of energy and nutrients.
InpUences on girls’ intakes
The 75th percentiles of energy and all nutrients studied were above the official Australian recommendations (National Health and Medical Research Council, 197 l), usually substan- tially so.
330
D.
R.
W O O D W A R D
result suggested that high intakes of these dietary components occurred randomly among girls. It is, however, possible that our list of characteristics failed to include some important ones.
Fatter, heavier girls were less likely to have high intakes of carbohydrate, Fe and niacin-equivalent. This appeared to reflect selective avoidance of high meat and cereal intakes. Even allowing for the problems of interpreting cross-sectional information (Wood- ward, 1985), it seems reasonable to infer that as girls developed a more adult shape they tended to avoid high intakes of these foods.
Socio-economic characteristics were dominant for two nutrients. Girls from large families were more likely to have high Ca intakes, and those from non-government schools were more likely to have high thiamin intakes. It was not possible to discern specific food choices responsible for these effects. The effect of family size on Ca might perhaps be linked to a perception of milk as a cheap and nutritious food: large households have an obvious incentive to obtain maximum nutritional return from their food expenditure and may therefore be more likely to emphasize milk in the diet. The effect of school type on thiamin is less-easily explained.
There are no strictly comparable studies in the literature; however, Huenemann (1972) noted lower intakes of Fe among fatter girls and, in the Dutch town of Leeuwarden, girls from large families had high Ca intakes (van Schaik & Kenter, 1973).
Zn$uences on boys’ intakes
The 75th percentiles of energy and nutrient intakes were all above the official Australian recommendations, usually substantially so.
For energy, protein, carbohydrate, Fe, thiamin, riboflavin and niacin-equivalent, the prevalence of high intakes was most affected by age. Age also influenced the prevalance of high intakes of the meat, cereal and fruit and vegetable food categories. However, these changes were asynchronous: some dietary components showed an early rise followed by a relative plateau, some showed a steady rise, and others showed a biphasic rise. While the increase in prevalence of high intakes presumably reflected increasing physiological needs, the asynchrony of the rises suggests a significant peer pressure effect.
Alcohol consumption had the greatest impact on the prevalence of high fat intakes. The results indicate the existence of a cluster of boys who drank fairly consistently and had high fat intakes, resulting from a greater emphasis on meat and miscellaneous foods. The conjunction of two energy-rich components (fat, alcohol) suggested that this cluster of boys could be headed for weight problems: indeed, the ‘heavier’ drinkers had a median Quetelet index of 20.3 kg/m2, significantly above the value of 18-8 for other boys.
The link between vigorous exercise and high Ca intakes might reflect ‘health conscious- ness’. However, it is less easy to explain why sons of well-educated mothers were less likely to have high vitamin A intakes: did these mothers discourage high intakes of fat-rich foods? These findings could be useful in nutrition education and epidemiological studies. There are no readily comparable studies in the literature.
An overview of influences on teenagers’ diets
The present paper and its predecessors (Woodward, 1984, 1985) have presented a mass of detail. It may be useful at this stage to provide a summary.
Sex was the characteristic with greatest impact on all three percentiles of energy and nutrient intakes, with the solitary exception of vitamin C. Values for a given percentile were consistently higher among boys than among girls.
Results within each sex are briefly summarized in Table 3.
331
Table 3. Dominant characteristics f o r the 25th, 50th and 75th percentiles of energy and nutrients among Tasmanian high-school studies
Girls
Percentile. . . 25 50 15
Energy Fatness * - -
Fat School-type * Fatness -
Carbohydrate Fatness * -
Calcium Fatness * Vitamins Family-size
Iron Fatness * Fatness Weight
Thiamin - * Weight School-type
t
t
Niacin- Fatness Weight Fatness
t
- -
Protein Exercise *
t
Weight
t
Riboflavin School-type * Family-size -
Vitamin A School-type * Mother -
equivalent
Boys
Percentile.
.
. 25 50 15Energy Height Age Age
Protein Height Age Age
Carbohydrate Height Age Age
Iron Age Age Age
Thiamin Analgesics * Height Age
Riboflavin Age Age Age
Niacin- Age Height Age
Fat Age Age Alcohol
t
Calcium - * Age Exercise
t
equivalent
Vitamin A Age Age Mother
t
* For this nutrient and sex, the dominant characteristic for the 25th percentile was different from that for the median.
f For this nutrient and sex, the dominant characteristic for the 75th percentile was different from that for the median.
prevalence of high intakes generally appeared to be independent of a girl’s physical behavioural and socio-economic characteristics. Among boys, however, impacts were more evenly spread over the three percentiles studied.
Physical characteristics accounted for a large proportion of impacts in both sexes, and were frequently dominant. Among girls, fatter and heavier girls tended to have lower intakes on average and were more likely to have low intakes; paradoxically, such girls did not appear to avoid high intakes. Our analyses suggested that the stimulus for dietary restraint might be normal physical maturation, rather than frank obesity; more detailed research on this question would nevertheless be very desirable. Among boys, there was a consistent increase at each percentile as boys became older and taller. Our analyses suggested that the stimulus was partly increased physiological needs and partly peer pressures, with the latter stimulus manifesting particularly in relation to food choice. The sex difference in the major physical stimuli presumably reflected the earlier onset of the pubertal growth spurt in girls.
Behavioural characteristics accounted for only a small proportion of impacts in either sex. Among girls, influential behavioural characteristics included exercise and usage of vitamin supplements, both of which might reflect ‘ health consciousness ’. Among boys, there
332
D. R. W O O D W A R D
was a greater variety in influential behavioural characteristics ; one of the more interesting was the link between alcohol intake and raised fat intakes.
Socio-economic characteristics accounted for a substantial proportion of impacts among girls, but for relatively few among boys. The most consistent was the greater frequency of low intakes among girls at government schools, linked mainly to apparent avoidance of cereals; the reasons for this school-based difference are unclear.
A new approach to survey analysis
The major aim of the investigation reported in the present paper and its predecessors (Woodward, 1984, 1985) was to gain some insight into the relative influence of a wide range of physical, behavioural and socio-economic characteristics on the diet of adolescents. Despite the potential usefulness of such information for clinical, educational and epi- demiological purposes, an extensive literature search revealed almost no studies that had attempted to assess simultaneously the effects of a range of characteristics.
After a detailed consideration of various methods, an unfamiliar but simple statistical technique that allowed thorough analysis was applied. By focussing on suitable percentiles, this technique permitted evaluation of influences on average intakes, low intakes and high intakes. (Other percentiles could be used if considered appropriate ; the only restriction is that analysis based on extreme percentiles, e.g. the 10th or 5th, requires a very large sample size (Garn et al. 1977).)
This approach has several advantages. It is simple to perform and to understand, and avoids certain technical problems associated with more conventional methods. Compared with traditional methods of analysis, it offers greater flexibility to the user. As it is not restricted to analysis of average intakes, the user is able to identify the type of person who is likely to have low or high intakes. Such persons are of considerable interest for clinical, epidemiological and educational purposes. Results presented in the present series of papers indicate that the major influences at the upper or lower ends of the spectrum do not always correspond to those operating at the middle of the spectrum of intakes. An analysis based on average intakes may therefore fail to detect influences relevant to under- or overnutrition. This investigation, based on an apparently representative sample of high-school students in one Australian state, has pointed to some previously unreported influences on teenage diets. In the absence of comparable studies, it may be unwise to generalize the conclusions to include other adolescent populations, whether in Australia or other nations. The limited information available, however, does not suggest that the Tasmanian students are markedly unusual in their dietary patterns. It is therefore suggested that it could be both interesting and useful to undertake similar studies in other populations.
The author acknowledges with gratitude the patient and skilled computer programming of Stqv& Andrewartha, and useful discussions with Glen McPherson and Johanna Coy. Financial support for this study was provided by the University of Tasmania and the National Health and Medical Research Council of Australia.
R E F E R E N C E S
Conover, W. J. (1971). Practical Non-Parametric Statistics, pp. 167-172. New York: Wiley. Darke, S. J., Disselduff, M. M. & Try, G. P. (1980). British Journal of Nutrition 44, 243-252.
Garn, S. M., Shaw, H. A,, Wainright, R. L. & McCabe, K. D. (1977). Ecology of Food and Nutrition 6, 153-157. Huenemann, R. L. (1972). Postgraduate Medicine 51, 99-105.
National Health and Medical Research Council (1971). Dietary Allowances f o r Use in Australia. Canberra: Samuelson, G. (1971). Acta Paedialrica Scandinavicu 214, Suppl., 5-44.
United States National Center for Health Statistics (1979). Dietary Intake Source Data 1971-1974. Hyattsville, van Schaik, T. F. S. M. & Kenter, H. A. (1973). Voeding 33, 577-604.
Woodward, D. R. (1984). British Journal of Nutrition 52, 21-32. Woodward, D. R. (1985). British Journal of Nutrition 53, 241-249.
Woodward, D. R., Lynch, P. P., Waters, M. J., Maclean, A. R., Ruddock, W. E., Rataj, J. W. & Lemoh, J. N. Md.: U S . Department of Health, Education & Welfare.
(1981). Australian Paediatric Journal 17, 196201.