© 1988 British Society of Animal Production
SOMATOMEDIN C IN DAIRY COWS RELATED TO ENERGY AND
PROTEIN SUPPLY AND TO MILK PRODUCTION
H. R O N G E ' , J. BLUM'1", C. CLEMENT1, F. JANS2, H. LEUENBERGER' AND H. BINDER4 ^Department of Nutrition Pathology, Institute of Animal Breeding, University of Berne, School
of Veterinary Medicine, 3012 Berne, Switzerland
2
Federal Research Station for Animal Production, Grangeneuve, 1725 Posieux, Switzerland 'Institute of Animal Science, Federal Institute of Technology, 8092 Zurich, Switzerland "Institute of Animal Breeding, University of Zurich, School of Veterinary Medicine, 8057
Zurich, Switzerland
ABSTRACT
Somatomedin C and other hormones, as well as blood metabolites, were measured during the dry period and during lactation in dairy cows, given different amounts of energy and protein, to study metabolic and endocrine adaptations. Somatomedin C, specifically measured by radioimmunoassay after separation from its binding protein, did not exhibit typical diurnal variations, in contrast to somatotropin and insulin, which increased particularly after concentrate intake. Somatomedin C markedly decreased at parturition and reached lowest values around the peak of lactation, while levels of somatotropin, non-esterified fatty acids and ketone bodies were high and those of glucose, insulin, thyroxine and triiodothyronine were low. Thereafter somatomedin C values slowly increased up to the 12th week of lactation and remained elevated. Low energy and protein balances were characterized by particularly low somatomedin C concentrations. An additional protein deficit at peak lactation, when cows were already provided with low amounts of energy, did not further decrease somatomedin C levels. However, when high amounts of energy were given in the form of starch or crystalline fat, somatomedin C increased. Overall, there was a positive correlation of somatomedin C primarily with energy, but also with protein balances and a negative correlation with milk yield. Conversely, somatotropin increased markedly after parturition and was positively correlated with milk production and negatively with protein and energy balances. Thus, somatomedin C levels were paradoxically low in the presence of high circulating somatotropin. Insulin most closely paralleled somatomedin C levels. Therefore the anabolic state of metabolism at the end of pregnancy was characterized by high somatomedin C and insulin and relatively low somatotropin, whereas the catabolic state of early lactation was characterized by high somatotropin, low somatomedin C, insulin and thyroid hormones.
INTRODUCTION Rayssiguier, Mazur and Demigne, 1986; HiGH-yielding dairy cows are usually Chilliard, 1987). Marked endocrine changes characterized by negative energy and protein o c c u r t h a t a r e considered responsible for the balances during the first weeks of lactation s h l f t f r o m a l a rge lY anabolic metabolic state (Moe, 1981; Chilliard, Remond, Sauvant and d u r i nS l a t e pregnancy towards a primarily Vermorel, 1983). During early lactation catabolic state in early lactation (Bauman and metabolism is changed towards enhanced C u r n e' 1 9 8 0^ Tucker, 1981; Hart, 1983; mobilization and utilization of fat whereas C o l h e r' McNamara, Wallace and Dehoff, glucose utilization in organs other than the 1 9 8 4; K u n z a n d B l u m' 1 9 8 5; K u n z< B l u m' mammary gland is reduced (Bennink, H a r t' B i c k e l a n d Landis, 1985; Karg and Mellenberger, Frobish and Bauman, 1972; M ay e r , 1987).
Bauman and Currie, 1980; Remesy, Chilliard, Somatotropin (STH), circulating in blood in relatively high amounts particularly during t To whom correspondence should be addressed. early lactation, decreases lipogenesis, favours
lipolysis and gluconeogenesis, enhances successfully inseminated between the 8th and nitrogen retention and stimulates milk yield 20th week of lactation.
(Hart and Johnsson, 1986; McCutcheon and Feeding. The animals were fed individually Bauman, 1986), although receptors for STH and received hay ad libitum and 2 kg barley, are not present in mammary tissue (Tucker When they produced more than 13 kg milk, and Merkel, 1987). However, several of the concentrates (1 kg/2 kg milk; containing effects of STH are well known to be cereals, soya-bean meal, vitamins and mediated by somatomedin C (SmC). minerals) were fed in addition. The Importantly, receptors for SmC exist in experiment was performed and the animals mammary tissue (Campbell and Baumrucker, were held at the Institute for Animal 1986). Therefore SmC might be responsible Breeding at the University of Zurich (Binder, for STH effects on mammary tissue and 1986). Blood samples were taken every 2nd could mediate, at least in part, STH effects day from 2 to 80 days, and then every 5th on milk yield. Bovine SmC is identical with day up to 300 days,
human SmC and with insulin-like growth
factor I (Klapper, Svoboda and Wyk, 1983; Experiment B
Honegger and Humbel, 1986). It seems Animals. Thirty dairy cows (16 Holstein-mainly to be synthesized by the liver. Friesian, eight Simmental and six Because blood SmC levels are modified in Schweizerisches Braunvieh x Brown Swiss) rats, humans, steers and heifers by variations were divided equally by breed and numbers in protein and/or energy intake (Breier, Bass, of lactation into two groups, each consisting Butler and Gluckman, 1986; Elsasser, Rumsey of 15 animals: group HE was fed high and Hammond, 1986; Underwood, Clemmons, amounts of energy and protein using Maes, D'Ercole and Ketelslegers, 1986) and concentrates; group LE was fed low amounts somatomedin-like activity (determined by of energy and protein by omitting the bioassay) is reduced in lactating cows with concentrates.
insufficient energy intake or high milk The animals were held at the Research production (Falconer, Forbes, Bines, Roy and Station of the Institute of Animal Science, Hart, 1980; Binnerts, Adrichem, Federal Insititute of Technology, Zurich Oudenaarden, Vogt and Wassenaar, 1982), (Leuenberger, Kunz and Michel, 1987). Blood we have studied changes of SmC levels by samples were taken once weekly,
use of a specific radioimmunoassay in high- Feeding. Both groups were fed individually yielding dairy cows, given different amounts a ration of 2/3 grass or hay and 1/3 maize of energy and/or protein. silage. Group HE received concentrates (450 g barley, 200 g wheat, 150 g oats, 175 g maize per kg and vitamins and minerals; supplemented with a soya-bean meal).
MATERIAL AND METHODS
Experimental design and feeding Experiment C
Four studies (A, B, C and D) were Animals. Nineteen animals (one animal had performed: over an entire lactation (A), t o b e treated for ketosis and was eliminated under different feeding conditions from 2 from the experiment) (12 Simmental x Red weeks before to 12 weeks after parturition (B Holstein, and seven Brown Swiss x and C), and as a 24-h experiment during the Schweizerisches Braunvieh) were divided 4th or 5th week of lactation under different equally by breed into two groups: group LD
feeding conditions (D). w a s f e d normally (according to
recommendations), and had a low protein Experiment A d e f i c i t (1 0 animals); group HD received less
Animals. Ten .dairy cows (Schweizerisches protein and therefore had a high protein Braunvieh) in their second lactation were deficit (nine animals).
examined for 300 days. Three of them were Feeding. To 5 kg hay, concentrates (315 g non-pregnant whereas the other seven were barley, 315 g maize, 150 g soya-bean meal,
117 g oats per kg and molasses, minerals and vitamins; group LD additionally received soya-bean meal) and maize silage were given according to the planned deficit of each animal. In group HD an additional protein deficit was planned. Planned daily energy and protein balances, based on net energy lactation (NEL) and absorbable protein from the gut (AP) for the 1st, 2nd and 3rd month were: for LD -22-5, -12-5 and 0 MJ NEL and -125, -25 and 0 g AP; for HD -32-5, -20 and 0 MJ NEL and -500, -325 and 0 g AP. The animals were held and individually fed at the Federal Research Station for Animal Production in Grangeneuve (F. Jans, unpublished). Blood samples were taken once weekly.
Experiment D
Animals. Eighteen dairy cows (nine Simmental x Red Holstein, and nine Schweizerisches Braunvieh purebred or x Brown Swiss) were divided equally by breed into three different groups of six animals each: group LE was given low amounts of energy, group HE received relatively high amounts of energy; group CF received concentrates supplemented with crystalline fat.
Feeding. The animals received hay and maize silage ad libitum. Concentrates (soya-bean meal supplemented with barley, maize, minerals and vitamins) were added as planned. Group CF received 1150 g crystalline fat per day (Alikon ®; Alifet AG, 4922 Biitzberg, Switzerland).
Experiments in the 4th to 5th week of lactation, lasting for 7 days, were carried out at the Swiss Federal Research Station for Animal Production in Grangeneuve (F. Jans, unpublished). Blood samples (39) were taken over a 24-h period (Blum, Jans, Moses, Frohli, Zemp, Wanner, Hart, Thun and Keller, 1985a) at the last day of the experiment.
In experiments B, C and D, energy and protein intake and balances were based on NEL and AP, respectively, and were calculated according to Bickel and Landis (1978) and Landis (1979). Calculations of AP balances were modified by taking milk protein instead of fat-corrected milk (FCM) as a basis (1-5 g AP for l g milk protein).
Calculations of daily requirements were based on:
maintenance: 0-293 MJ NEL per kg M"7S
and 3-25 g AP per kg M"7S
pregnancy (9th month): 18 MJ NEL and 205 g AP
milk: 3-14 MJ NEL per kg FCM and 1-5 g AP per g milk protein.
In experiment A, protein intake was measured based on digestible crude protein.
Blood samples were taken at 14.00 h by jugular venipuncture, using vacutainers (Becton-Dickinson, CH 4142 Miichenstein) or through indwelling catheters (24-h experiments, D), implanted at least 3 h before the start of the studies. Heparinized blood plasma was used for all determinations, except for the determination of ketone bodies, for which blood was deproteinized with equal amounts of ice-cold perchloric acid (0-7 mol/1).
Laboratory methods
Glucose, protein, albumin, urea, non-esterified fatty acids (NEFA), ketone bodies (B-hydroxybutyrate plus acetoacetate), immunoreactive insulin (IRI), thyroxine (T4)
and triiodothyronine (T,) were measured as described before (Blum et al., 1985a).
STH concentrations were determined by radioimmunoassay based on the methods of Hart, Flux, Andrews and McNeilly (1975) with some modifications. STH for standards (USDA-bGH-B-1 AFP-5200) and for iodination (USDA-bGH-I-1 AFP-6500) were obtained from the National Institute of Arthritis, Diabetes and Digestive and Kidney Diseases, Baltimore, MD 21201-3472, USA. Antiserum against bovine rbSTH (bGH 5/15.6.86), raised in a rabbit, was provided by Professor Dr D. Schams, Munich and used at a final dilution of 1:50000. Goat-anti-rabbit-gamma-globulin, purchased from Antibodies Inc., Davis, CA, USA, fraction P4, was used as second antibody to separate
(together with 5% polyethyleneglycol) the bound from free hormone. STH was labelled using the iodogen procedure (Salacinski, McLean, Sykes, Clement-Jones and Lowry, 1981). rbSTH paralleled bSTH standards obtained from hypothalamic extracts. Half-maximal binding was attained with 10 ug STH
per 1 and the sensitivity was below 1 \xg/\. Recovery of bovine STH for 1 and 10 ng added (10 ul) to 1 ml bovine serum was 117 ± 17% and 107 ± 6%, respectively. All samples from one animal were measured within the same assay and each sample was determined in triplicate. Intra-assay coefficient of variation and inter-assay variation were below 0-050.
Somatomedin C was determined in triplicate by radioimmunoassay according to Zapf, Walter and Froesch (1981) with some modifications. SmC (preparation 1/3 and 1/4) used for standards was kindly provided by Professor Dr R. E. Humbel, Zurich, Switzerland. For production of antiserum in a rabbit and for iodination (by the chloramin-T method), recombinant human SmC (rSmC, Mu 14 Fr 25-32 TOP), which has the same structure as bovine SmC or insulin-like growth factor I, was used (rSmC was obtained from Professor Dr Niiesch and Dr Scheibli, Ciba-Geigy A. G., 4002, Basle, Switzerland). All samples were pretreated with acid/ethanol to separate SmC from its binding protein(s), as described by Daughaday, Mariz and Blethen (1980). The samples were neutralized with ammonium hydrogen carbonate, lyophilized and reconstituted in the assay buffer before further use. After incubation for 24 h with antibody and another 24 h with tracer, antibody-bound and free SmC were separated after addition of 1% bovine gamma-globulin and 25% polyethyleneglycol by centrifugation. Half-maximal binding was 1-0 ng per tube. The sensitivity was below 0-1 ng per tube (less than 6-5 ug/1). Recovery was 91 ± 5% and 111 ± 9%, respectively, for 10 and 20 ng rSmC (10 ul) added to 1 ml bovine plasma. The recovery of 12T-labelled rSmC added to bovine plasma was 104 ± 1%. Compared with separation of SmC bound to plasmaprotein(s) by chromatography using a large column (30 x 2 cm, volume 92-5 ml) and acidified buffer, recovery by acid/ethanol extraction was increased by 27 ± 5%. Diluted sera from cattle in different physiological states paralleled the standard curve. Heparin in plasma did not modify the results. Use of an antiserum (115/91177, obtained from Professor J. Zapf, University
of Zurich, Switzerland) raised against extracted human SmC gave the same results as obtained with the antiserum raised against rSmC. The intra-assay coefficient of variation and the inter-assay coefficient of variation were below 0-1.
Statistical analysis
Values are expressed as means and standard errors. Correlations were calculated according to Spearman. They were calculated for each animal separately and are expressed as the mean of individuals. The significance of difference between groups were tested by Wilcoxon-Test (P < 0-05).
RESULTS
Changes of SmC and milk yield during a 300-day lactation period (experiment A)
The day-to-day coefficient of variation was 0-14 and 0-17 for two animals during the first 80 days of lactation (Figure 1). Following a transient decrease after parturition, SmC levels increased up to 150 days of lactation and then remained elevated. In contrast, milk production (FCM) continuously decreased. There were no significant differences between pregnant and non-pregnant cows (not shown). Energy and protein balances never became negative throughout lactation and increased during the first 2 to 3 months after parturition. SmC and FCM were negatively correlated (r = —0-61), whereas there was a positive correlation of SmC with energy and protein balances (r = 0-42 and 0-43, respectively).
Effects of energy and protein supply on food intake, energy and protein balances, milk yield and composition, metabolites and hormones (SmC, STH, IRI, T( and T4) during the dry
period and the first 3 months of lactation (experiments B and C)
Dry-matter intake of basic ration (BR; grass, hay, maize silage) was relatively low during the dry period, then increased particularly during the 1st and 2nd month of lactation, but there were no significant differences between groups LE and HE or LD and HD, respectively (Table 1). Provision
169 n—i i i i—i i i—i—i—n—i—i—r i i—n—i—i—n—n—i—i—i—i I i i i—n—i—i i i i—n—i—i—i
J J L J L J
^ J I J L
12 16 18 24 28Weeks from parturition
32
L
36 40
FIG. 1. Blood levels of somatomedin C measured every 2nd day from 2 to 80 days, and every 5th day up to 300 days; ± s.e. ( ), fat-corrected milk yield (FCM) (- - -), energy (MJ net energy per day • ) and protein (g absorbable protein per day I B ) balances (average calculated for 4 weeks; during a 300-day lactation period (experiment A).
of concentrates (C) was increased during lactation compared with the dry period. Concentrates were not supplied in experiment B to animals of group LE. Concentrate intake in experiment C was lower for group HD, but this difference was not significant.
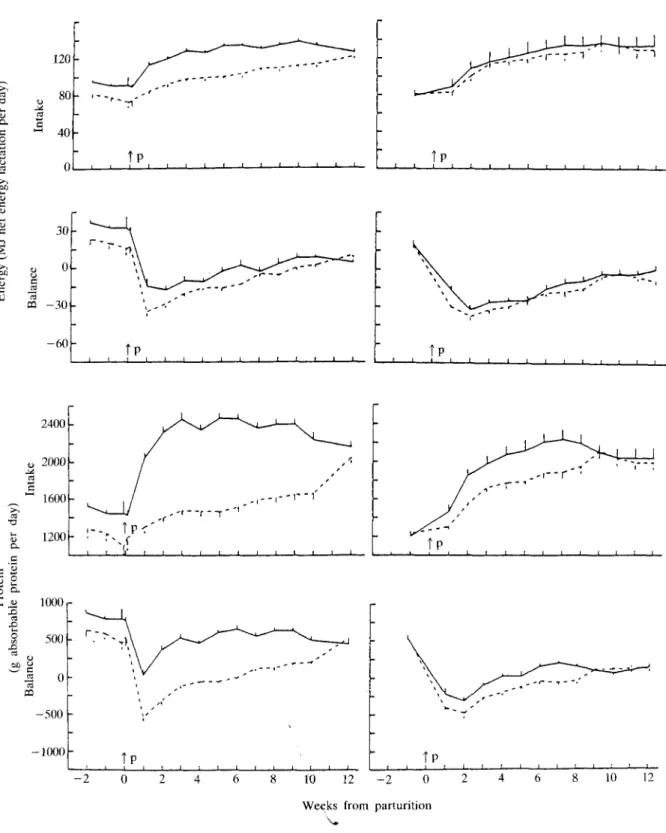
NEL intake was relatively low during the dry period and continuously increased after parturition during the 3 months of the study, but there were significant differences between the groups only in experiment B (Table 1; Figure 2). NEL balances were positive before, but negative after parturition, particularly in early lactation. They were more negative for group LE than for group HE and tended to be lower for group HD than for group LD (P < 0-05 for the 1st month of lactation).
AP intake was relatively low during the dry period. It increased during lactation, in groups HE and LD particularly during the 1st month and there were signficant differences (P < 0-05) between groups LE and HE, as well as between LD and HD (Table 1). AP balances were positive before parturition and became transiently negative during the 1st month of lactation in groups LE and LD and during the first 8 weeks of lactation in group HD. AP balances were significantly lower in
group LE throughout the study than in group HE and in group HD during the first 8 weeks post partum compared with group LD (P < 0-05).
Milk yield (FCM) increased rapidly during the first 2 to 4 weeks and was maximal during the 2nd month of lactation. It was significantly higher during the study in group HE than LE (P < 0-05 for the 2nd and 3rd month of lactation), but comparable in groups LD and HD. Milk fat content decreased during the 1st month of lactation, but was not significantly different between experimental groups. Milk protein content transiently decreased during the 2nd month of lactation, but was lower in group LE than in group HE (P < 0-05 during the 2nd and 3rd month of lactation) and in group HD than in group LD (not significantly). Lactose content was numerically lower during the 1st month of lactation, but there were no significant differences between the groups.
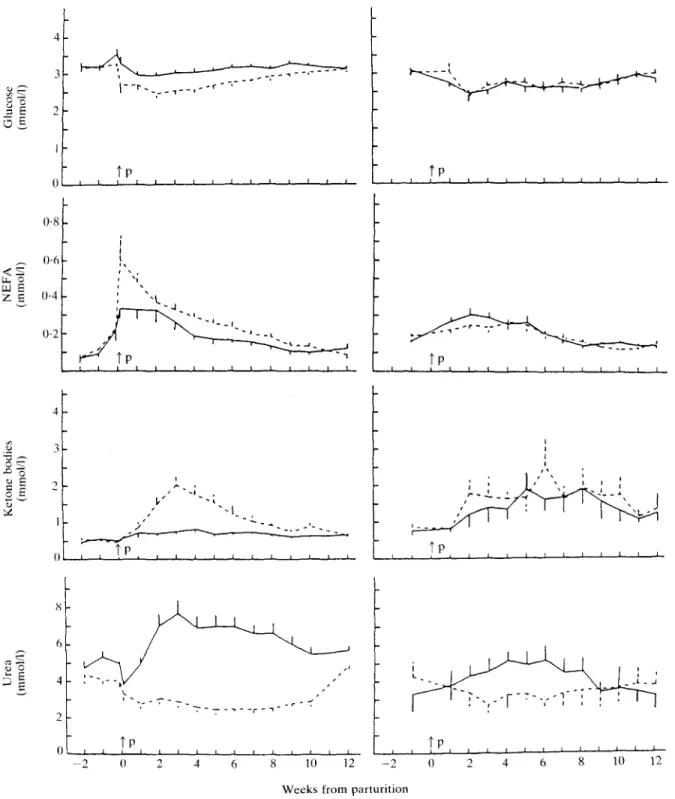
Plasma concentrations of glucose transiently decreased during the 1st month of lactation (Table 2; Figure 3). Glucose levels were significantly lower during the first 2 months of lactation in group LE compared with group HE (P < 0-05). NEFA concentration reversibly increased during the 1st month of
lactation, particularly in group LE, with significant differences between groups HE and LE for the first 2 months of lactation. Ketone bodies (acetoacetate plus (3-hydroxybutyrate) increased after parturition. The increase was highest and significantly greater in group LE than in group HE (P < 0-05 for the first 2 months of lactation), but only numerically greater for group HD than for group LD.
Plasma concentrations of protein were higher during lactation than during the dry period in experiment B, but not in experiment C and levels were significantly higher in group HE than in group LE during the whole study (Table 2, P < 0-05). Albumin was increased during lactation
compared with the dry period. Levels were significantly lower in group LE than in group HE for the first 2 months of lactation (P < 0-05). Urea transiently decreased in group LE and in group HD (P < 0-05), but increased in groups HE and LD (P < 0-05) during lactation. Levels were lower in group LE than in group HE (P < 0-05) and in group HD than in group LD (P < 0-05 for the first 8 weeks after parturition).
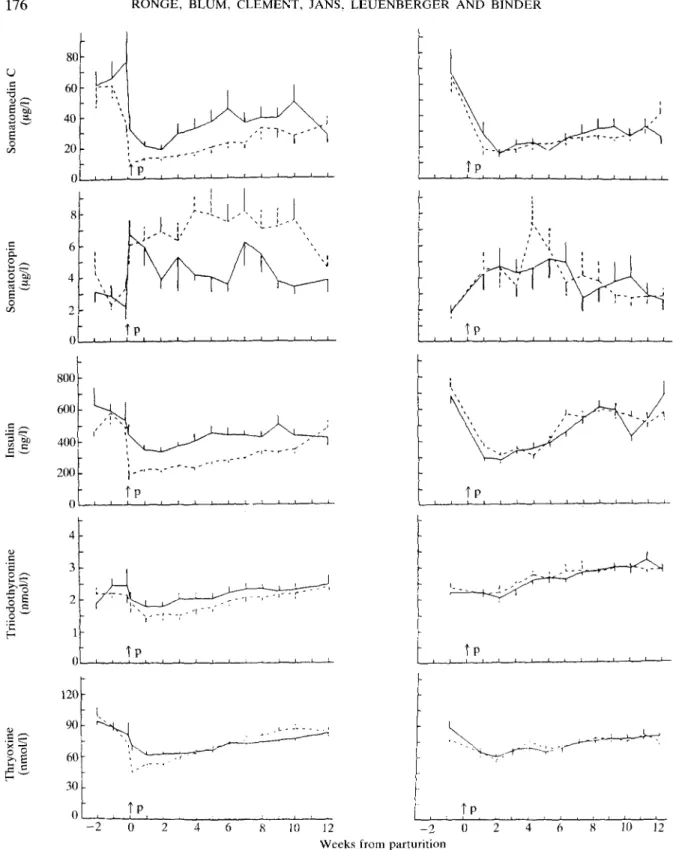
Levels of SmC were highest during the dry period (Table 2; Figure 4). SmC sharply decreased at parturition and remained lowest during the 1st month of lactation in all experimental groups and then slowly increased again. SmC concentrations were always lower
TABLE 1
Dry matter (DM) (basic ration (BR) and concentrates (C)), net energy lactation (NEL) and crude protein (CP) intakes and absorbable protein (AP) intakes and balances, fat-corrected milk yield (FCM) and milk composition during the dry period (last 2
weeks before parturition) and during the first 3 months of lactation.
No of animals Body weight (kg) DM intake BR (kg/day) DM intake C (kg/day) NEL intake (MJ/day) NEL balance (MJ/day) CP intake (g/day) AP intake (g/day) AP balance (g/day) FCM (kg/day) Milk fat (g/1) Milk protein (g/0 Milk lactose (g/1) HE LE HE LE HE LE H E LE HE LE H E LE HE LE HE LE HE LE HE LE HE LE HE LE HE LE Dry period 15 15 Mean 711 681 12-7 13-2 2-6 0* 93 75* 34 18* 2083 1735* 1480 1167* 828 529* s.e. 11" 19" 0.5" 0-9" 0-1" 0 3" 4" 3" 4" 64a 94" 45" 70" 44" 66" 1 to 15 15 Mean 640 592* 15-1 15-7 3-7 0* 117 92* - 7 - 2 3 * 3514 1984* 2171 1392* 400 -209* 27-0 24-9 42-4 44-2 34-0 33-7 49-6 48-9 Experiment 4 s.e. 10" 18" 0-6" 0-6" 0-3" 0 2" 3" 3" 3" 86bd 71"" 43" 48" 39" 39" 1-2 1-0 1-3 1-3" 0-8" 0-6a 0-4 0-4 B Weeks 5 Mean 617 566* 17-9 17-6 3-3 0* 132 105* 0 - 1 0 3643 2101* 2419 1548* 613 49* 30-6 25-7' 40-0 40-4 30-5 29-1" 50-8 50-0 of to 15 15 lactation 8 s.e. 10c 16C 0.6c 0-7c 0-3" 0 2C 4C 3" 2C 96bc 81" 53C 6T 27C 28C 1-3 1-0 1-1 0-6" 0-5" 0-3" 0-4 0-4 9 to 15 15 Mean 614 562* 18-3 18-9 2-6 0* 132 115* 7 4 3278 2630* 2253 1776* 518 301* 28-1 24-5* 40-2 40-3 31-6 29-9* 50-5 49-8 12 s.e. I T 16d 0-5c 0-6c 0-4"b 0 3C 4C r 2d 94d 69C 63" 58d 44d 33b t 1-1 11 1-0 0-8" 0-5" 0-3c 0-3 0-3
171 No of animals Body weight (kg) DM intake BR (kg/day) DM intake C (kg/day) NEL intake (MJ/day) NEL balance (MJ/day) CP intake (g/day) AP intake (g/day) AP balance (g/day) FCM (kg/day) Milk fat (g/1) Milk protein (g/1) Milk lactose (g/1) a b c Different s LD HD LD HD LD H D LD H D LD HD LD HD LD HD LD HD LD HD LD HD LD HD LD HD LD HD iUDerscr Dry Mean 742 791 11-5 11-8 1-3 1-3 79 81 20 19 1585 1618 1200 1233* 534 545 period 10 9 s.e. 18a 16" 0.4a 0-4" 0-1" 0-la 3a T 3a 2" 70" 37a 50" 26a 45a 28a
iDts indicate sienific;
1 to 4 10 9 Mean 671 707 12-8 13-2 4-2 3-2 109 104 - 2 5 - 3 2 * 2590 2099* 1843 1588* - 1 5 5 - 3 4 2 * 30-4 30-7 42-7 42-6 36-2 33-6 49-2 49-4 »nt differences E x p e r i m e n t s.e. 18b 12b 0-4b 0-6a b 0-4b 0-4" 2b 2b 2b 2h 92b 46b 51b 20b 17b 29b 1-3" 0-9 1-4" 1-6 0-9a 0-7a 0-5 0-7 between d: C W e e k s 5 M e a n 663 698 13-5 14-2 6-5 5-0 132 125 - 1 5 - 1 8 3029 2444* 2188 1876* 128 - 7 1 * 34-5 33-0 40-2 41-1 31-6 30-6 50-5 50-6 rv oerii of to 10 9 3d. lactation 8 s.e. 17b 14" 0.5b 0-6b 0-9b 0-7b c T 2C 2C 2C 143C 89C 29C 47C 19C 10c 0-6h 11 0-9b 1-8 0-4b 0-6" 0-3 0-3 week 1 to 9 Mean 666 694 13-7 13-8 6-7 6-5 136 134 - 2 - 5 2671 2656* 2052 2030 95 110 31-6 31-6 40-9 41-4 32-7 31-5 49-7 50-3 4, week to 10 9 . 5 12 s.e. 18" 14" 0-4a" 0-4b 0-9b 0-8c 3C 3C ld ld 135b t 102c 42d 49C 18C 17d 0-7a 1-1 l - 0a b 2-1 0-7" 0-7a b 0-3 0-4 to 8 or to 12 of lactation (P < 0-05).
Significant difference between groups L E and H E and L D and H D (P < 0 0 5 ) .
in group LE than in group HE (P < 0-05 for the dry period and the 1st month of lactation), but similar in groups LD and HD.
In contrast to SmC, STH increased after parturition, with highest levels reached during the 1st month of lactation (F < 0-05). STH was significantly higher in group LE than in group HE during lactation (P < 0-05), but similar in groups LD and HD.
Levels of IRI, as those of SmC, were highest during the dry period and rapidly decreased after parturition, remained low during the 1st month of lactation and then increased again. IRI levels were lower in group LE than in group HE (P < 0-05 during the first 2 months of lactation), but similar in groups HD and LD.
Concentrations of T-, transiently decreased after parturition in experiment B, particularly
in group LE, while they increased continuously in experiment C. Levels of T, were always lower in group LE than group HE (not significantly), but comparable in groups LD and HD. T4 levels transiently
decreased in all groups after parturition, but there were significant differences only for the 1st month of lactation between groups HE and LE.
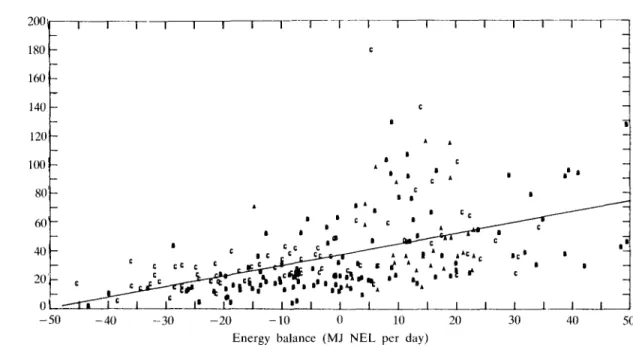
SmC showed highest positive correlations (P < 0-05) with energy (Figure 5) and protein balances, with glucose, IRI, T4 and T, in both
experiments (Table 3). Negative energy balances were related to low concentrations of SmC. Elevated SmC values were found if energy balances were positive. Correlations with AP balances were higher in experiment C. Energy and protein balances were closely related in both experiments (r = 0-83), but
partial correlations revealed only negligible effects of AP balance (not shown). There were negative correlations of SmC with FCM, ketone bodies and STH.
Effects of different energy and protein intake and of crystalline fat on energy and protein balances, milk yield and composition, metabolites and hormones (SmC, STH, IRI, T, and T4) during a 24-h period (experiment
D)
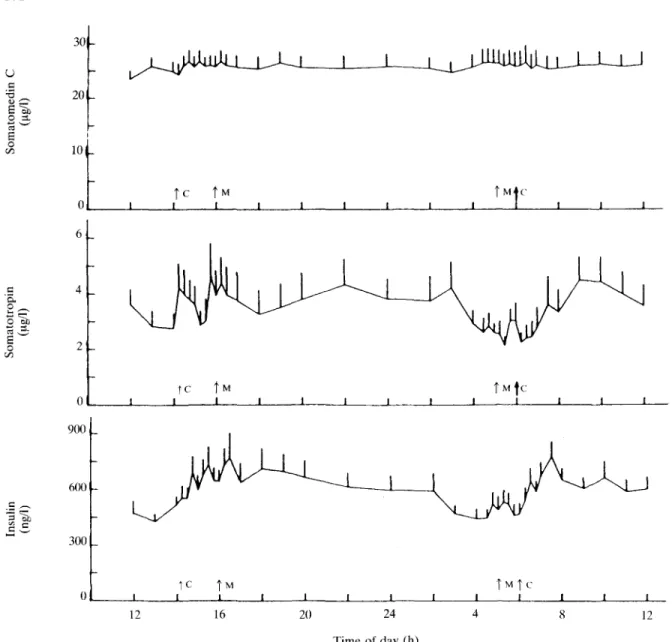
Levels of SmC did not change during the 24-h period (Figure 6). In contrast, IRI and STH exhibited marked diurnal variations, mainly due to an increase in response to concentrate feeding (at 06.00 h and 14.30 h).
Body weight tended to be higher in groups HE and CF than in group LE (Table 4).
Intake of BR was similar, whereas C, NEL and AP intake were lowest in group LE and highest in group CF. NEL and AP balances were most markedly negative in group LE, but positive in group CF.
FCM and milk lactose were similar in groups LE, HE and CF, whereas milk fat and protein were highest in group LE and lowest in group CF (P < 0-05).
Glucose levels were lowest in group LE and highest in group CF, whereas the reverse was found for NEFA, ketone bodies and urea, while protein and albumin levels were not consistently changed.
SmC, IRI, T, and T4 were numerically or
significantly lower in group LE than in groups HE or CF. In contrast, STH was highest in group LE and lowest in group CF.
TABLE 2
Blood metabolites and hormones during the dry period (last 2 weeks before parturition) and during the first 3 months of lactation
Glucose (mmol/1) Non-esterfied fatty acids ((unol/1) Ketone bodies (nmol/1) Protein (g/1) Albumin (g/1) Urea (mmol/1) Somatomedin i (ng/i) Somatotropin (ng/i) HE LE HE LE HE LE HE LE HE LE HE LE C H E LE HE LE Immunoreactive insulin (ng/1) HE LE TriiodothyronineHE (nmol/1) Thyroxine (nmol/1) LE HE LE Dry Mean 3-25 3-23 121 178 545 485 75-0 70-6* 35-4 33-9 5-24 4-03 69-7 45-6* 2-62 2-98 573 517 2-44 2-17 88-9 81-2 period s.e. 0-09" 0-10a 26ac 34ac 32a 13" 1-3 1-1" 0-7 0-4a 0-26" 0-24a 8-5" 6-5" 0-46a 0-36a 50" 35" 0-24 0-18" 4-3a 5-0" 1 to Mean 3-02 2-56* 283 375* 722 1493* 81-1 75-0* 35-9 33-8* 6-21 2-93* 27-3 13-7* 4-96 6-91* 375 228* 1-92 1-58 64-6 57-4* Experiment 4 s.e. 0-10" 0 1 1b 36" 29h 53b 157" 1-4 l-2b 0-6 0-5" 0-43ab 0-24" 4-0b 1-6" 0-64" 0-77" 24b 9b 0-15 0-16b 2-3b 2-lb B Weeks of 5 to Mean 3-12 2-78* 154 217 701 1176* 84-6 77-1* 37-0 34-7* 6-84 2-54* 41-8 24-2 4-78 7-62* 433 297* 2-23 1-97 72-7 75-4 lactation 8 s.e. 0-07ab 0 - l lb 18C 24C 38" 135" 1-1" 1-4" 0-6 0-6ab 0-49" 0-18" 8-0" 4-4c 0-73" M 4b 29b 18C 0-15 0-16"" 2-8c 2-6a 9 to Mean 3-19 3-03 109 117 635 750 84-0 76-9* 37-0 35-9* 5-74 3-54* 42-7 30-5 3-73 6-74* 450 380 2-38 2-25 80-2 86-4 12 s.e. 0-08ab 0-09" 15" 16" 27b 54C l-4b l lb 0-6 0-5b 0-28ab 0-19" 8-7b 5-2c 0-50ab 0-97" 30b 27d 0-20 0-14" 3-la t 3-6"
Glucose (mmol/1) Non-esterfied fatty acids (nmol/1) Ketone bodies (nmol/1) Protein (g/1) Albumin (g/1) Urea (mmol/1) Somatomedin C (ng/D Somatotropin (ug/1) Immunoreactive insulin (ng/1) HE LE H E LE HE LE HE LE HE LE H E LE : H E LE HE LE HE LE TriiodothyronineHE (nmol/1) Thyroxine (nmol/1) LE HE LE Dry Mean 3-08 3-03 165 189 760 849 70-6 69-0 34-9 35-3 3-32 4-27 67-2 64-5 1-87 1-90 681 737 2-22 2-37 77-6 89-6 period s.e. 0-09a 0-05a 17a c 21a 81" 96a 2-2 1-5 0-9a 0-3a 0-33a 0-29" 16-2a 11 -2a 0-33a 0-32a 144" 152a 0-09a 0-17a 3-6ac 6-la 1 to Mean 2-62 2-71 280 244 1191 1469 69-9 69-8 36-9 37-4 4-46 3-24* 22-2 19-2 4-46 4-98 318 336 2-29 2-41 66-7 66-3 Experiment 4 s.e. 0-05b 0-08b 17b 24a 138b 159b 0-9 0-6 0-3" 0-3" 0-16" 0 - Ub 2-7b 1-5" 0-35" 0-27b 27b 34" 0-06a 0-10ac 2-3b l-2b C Weeks of 5 to Mean 2-61 2-68 193 197 1757 1924 71-9 70-0 38-1 37-3 4-77 3-25* 26-3 25-5 4-03 4-34 497 527 2-75 2-81 74-2 72-7 lactation 8 s.e. 0-09b 0-06" 16" 19a 187b 268b 1-0 0-5 0-3b 0-3" 0-09" 0-13b 2-3" 1-6C 0-43b 0-59bc 44" 58a 0-04" 0-13b c l-4a 1-7° 9 to Mean 2-84 2-86 148 135 1271 1460 71-6 70-5 37-9 38-3 3-37 3-67 30-7 32-5 3-34 2-84* 559 552 3-01 2-95 79-4 80-8 12 s.e. 0-04c 0-06" 6C 9b 175b 132" 0-9 0-7 0-3" 0-3" 0 - l la 0-lla 2-9" 2-0d 0-31" 0-28a 47a 49" 0-09c 0-06" 1-8C 1-5" Different superscripts indicate significant differences between dry period, week 1 to 4, week 5 to 8 or 9
to 12 of lactation (P < 0 0 5 ) .
* Significant difference between groups LE and HE and LD and HD (P < 0 0 5 ) .
DISCUSSION
In the study lasting over the entire lactation, energy and protein balances were always positive, because of a relatively low milk yield. In further experiments, in which high-yielding cows were used, energy and protein balances became markedly negative in the first months of lactation, even when given high amounts of concentrates. Only with the feeding of crystalline fat were calculated energy and protein balances positive after parturition.
FCM yield was either unaffected or only slightly reduced in cows consciously underfed with energy and protein. Marked energy deficiency was associated with decreased milk protein and in part with increased milk fat, marked protein deficiency with decreased milk protein. Feeding high amounts of crystalline fat as in this study caused lowered milk fat and protein concentration.
As shown previously (Blum et al., 1985a; Kunz et al, 1985; Mills, Beitz and Young, 1986), negative energy balances were typically characterized by low glucose and high NEFA and ketone body levels, suggesting insufficient gluconeogenesis, enhanced fat mobilization and ketogenesis. Negative protein balances were typically characterized by low urea concentrations, whereas an oversupply of protein when energy balances were negative was followed by elevated urea concentrations. Combined low energy and protein intake led to low circulating urea, partially low albumin and protein and high NEFA and ketone body concentrations (Oldham, Broster, Napper and Siviter, 1979; Oltner and Wiktorsson, 1983; Clement, 1988). On the other hand, feeding crystalline fat improved energy supply and was characterized by relatively high blood glucose, relatively low levels of NEFA and ketone bodies (Blum et al., 1985a).
120 80 40 -0 TP I ' ' i_ LUULU TP - i — i — i — i — i i i • • « • • • • 30 0 -CO - 3 0 60 -TP TP • I I I —J 1 l _— 1 1 1 1 _ _ L _ 2400 -500 -1000 TP TP - 2 10 12 - 2 0 2
Weeks from parturition
10 12
FIG. 2. Energy and protein intake and balances of experiments B and C (on left and right side, respectively). Each point represents the mean ± s.e. of a 7-day period. , groups HE and LD, respectively , groups LE and HD, respectively. P = parturition.
175
5 1
o i i 4-II
u S o E TP i i i i i I.' TP i -J I I ' ' ' • , - -r , -TP TP TP ' • ' TP • • I 1 -8 10 12 - 2 0 Weeks from parturition8 10 12
FIG. 3. Blood levels of glucose, non-esterified fatty acid (NEFA), ketone bodies and urea (experiments B and C). For further details see legend to Figure 2.
o
ii
O "ailI
3 oi) .S 'S o ^^• § 1
o 800- 600- 400200 0 -4 3 2 1 0 TP TP 120 90 r-60 30 0 TP - 2 0 2 4 6 8 10 12 - 1 1 ' • ' r t , TP TP TP TP - 2 0 2 4 6 8Weeks from parturition
FIG. 4. Blood levels of somatomedin C, somatotropin, immunoreactivc insulin, triiodothyronine and (experiments B and C). For further details see legend to Figure 2.
10 12
E o 3 o C/3 180 160 140 120 100 80 60 40 20 0 1 1 -_ -— c I I I I 1 1 1 1 1 C A 1 ' IB 1 lc 1 ' *• 1 1 •• 1 1 * 1 1 a s • A 1 C — • ' A 1 1 c A 1 ' c' c • 1 1 A I 4] A 1 A ! * * A i i A C A cc T ** • 1 1 1 • 1 1 c c 1 1 1 - - — ' c I 1 1 1 -— _ -r~~~~ _ • -1 -1 -1 - 5 0 - 4 0 - 3 0 - 2 0 - 1 0 0 10 20
Energy balance (MJ NEL per day)
30 40 50
FIG. 5. Relationship between somatomedin C and energy balances from the dry period (2 weeks approx.) up to the 12th week of lactation. Each point represents the mean of 4 weeks for each animal from experiments A, B and C.
TABLE 3
Experiments B and C: correlation^ somatomedin C with various measurements
Experiment
of
Net energy lactation intake
balance
Absorbable protein intake
balance
Fat-corrected milk yield Glucose
Non-esterified tatty acids Ketone bodies Protein Albumin Urea Somatotropin Immunoreactive insulin Triiodothyronine Thryoxine B -0-09 0-64* -0-04 0-48* -0-47* 0-38* -0-49* -0-59* 0-04 0-24* 0-28* -0-58* 0-66* 0-34* 0-45* C -0-52 0-67* -0-55* -0-61* -0-68* 0-54* -0-09 -0-51* -0-09 -0-45* -0-15 -0-35* 0-27* -0-10 0-39* B and C -0-25* 0-61* -0-23* 0-47* -0-51* 0-38* -0-28* -0-46* -0-07 0-02 0-15* -0-50* 0-48* 0-22* 0-43* t Correlations are calculated for each experiment over
periods and animals. Degrees of freedom were: 74 for B, 118 for C and 194 for B and C.
Somatomedin C was very stable during the 24 h studied (Figure 6). In particular, SmC levels did not change in response to food intake. This is in accordance with studies in pigs (Sillence and Etherton, 1987). Thus, a single blood sample during the course of the day seems to be sufficient to characterize the SmC status. In contrast, Binnerts et al. (1982) and Falconer et al. (1980) reported diurnal variations of somatomedin-like activity which is, however, not identical with the specifically and radioimmunologically measured SmC in our investigation. The considerable stability of SmC levels over a 24-h period is likely to be the consequence of SmC binding to specific blood plasma proteins (Zapf, Hauri, Waldvogel and Froesch, 1986). One important consequence is a half-life of SmC in the circulation of several h (Froesch and Zapf, 1985). In addition, protein binding markedly reduces acute biological effects of SmC and is thought to be responsible for absence in vivo of most insulin-like effects found in vitro
"3 "So 30 u c '•3 ^ o i
1
opi n o "oil o 1/5 20 10 0 6 4 2 Tc J L \ M 4 C J L |C f M _1 J_ J I J I 1 L J L 900 _ 600 300 TC J _ _L T M t C I 12 16 20 24 Time of day (h) 12FIG. 6. Blood levels of SmC, STH and IRI during a 24-h period (mean ± s.e. of all 18 animals of experiment D). Animals received concentrate at 06.00 and at 14.30 h (C) and were milked at 05.15 h and at 16.00 h (M).
(Zapf et al., 1986). IRI consistently increased (Bines, Hart and Morant, 1983) and STH appeared to rise only marginally after the intake of concentrates (irregularly also after milking), and thus are probably more important for rapid regulation of metabolism than SmC.
Our study clearly demonstrates a negative
correlation between levels of specifically measured SmC and milk yield. Somatomedin-like activity behaved similarly (Binnerts et al., 1982). In accordance, Falconer et al. (1980) found lower somatomedin-like activity in high, compared with low, yielding cows. Our data also indicate that the presence of a foetus, i.e. pregnancy per se (up to the 7th month of
TABLE 4
Body weight, dry matter (basic ration (BR) and concentrates (C)), net energy lactation (NEL) and crude protein (CP) intakes and absorbable protein (AP) intakes and balances, fat-corrected milk yields (FCM), milk composition, blood metabolites and hormones in
lactating cows given different amounts of protein and energy (experiment D)~\
Group
Body weight (kg) BR-intake (kg/day) C intake (kg/day) NEL intake MJ/day) NEL balance (MJ/day) CP intake (g/day) AP intake (g/day) AP balance (g/day) FCM (kg/day) Milk fat (g/1) Milk protein (g/1) Milk lactose (g/1) Glucose (mmol/1)
Non-esterified fatty acids (u.mol/1) Ketone bodies (nmol/1) Protein (g/1) Albumin (g/1) Urea (mmol/1) Somatomedin C ([ig/1) Somatotropin (|J.g/l) Immunoreactive insulin (ng/1) Triiodothyronine (nmol/1) Thyroxine (nmol/1) Mean 596 11-3 2-7 88 - 4 0 2188 1489 - 2 8 8 30-4 47-8 34-0 52-7 3-25 257 1872 78-7 42-3 5-42 17-1 6 0 6 361 1-68 53-8 LE s.e. 15 0-5a 0-2" 4a 4" 85a 59a 65" 1-5 2-7a 0-8a 1-1 0-19 63a b 363a 2-0 0-7 0-47ab 3-1 0-63a 39a 0-12" 5-0 NE Mean 632 11-6 6-6 120 - 1 9 2630 1895 - 4 1 31-0 37-7 32-0 50-7 3-46 145 995 81-1 43-6 3-90 23-9 2-67 713 2-58 68-7 s.e. 11 0-5ab 0-0" 3b lb 60" 44b 39b 1-3 1-1" Ma h 1-5 0-03 6a 104ab 3-7 1-0 0-39a 2-2 0-56" 98b 0-24b 6-6 CF Mean 650 13-0 4-6 128 1 2648 1994 71 29-3 32-2 30-3 50-5 3-60 208 852 76-4 44-1 6-01 27-3 1-44 718 2-28 58-7 s.e. 22 0-6b 0-()c 4b 4C 62b 45b 46" 2-2 2-2" 0-3b 0-7 0 0 9 13" 51" 2-8 1-3 0-71b 4-8 0-24" 83" 0-15b 4-3 b c
Different superscripts indicate significant differences between LE, HE and CF (P < 0-05). Values are expressed as mean ± s.e. of 24 h (39 samples).
pregnancy), does not measurably modify SmC balances were always positive in this levels compared with non-pregnant cows, experiment, because milk production was low. Somatomedins other than SmC, such as The fall of SmC levels after parturition was insulin-like growth factor II, are considered more marked in cows consciously important for foetal development (Underwood undersupplied with energy, whereas an and D'Ercole, 1984; Gluckman, 1986). additional protein deficiency did not further Energy and/or protein intake and lower SmC levels. High energy intake in the consequent changes of blood levels of various form of crystalline fat led to increased SmC hormones are known to be determining levels. Moreover, energy balances were factors of SmC levels (Breier et al., 1986; significantly and positively correlated with Elsasser et al., 1986; Underwood et al., SmC levels. Thus, energy supply seemed 1986). The experiment lasting over the entire greatly and dominantly to influence circulating lactation demonstrated a positive correlation SmC, whereas protein supply appeared to be between SmC levels and energy and/or of rather secondary importance. In protein balance. Interestingly, such a accordance, in heifers during fasting for 3 relationship was observed even though days, SmC levels rapidly decreased and
returned to the normal range within 5 days of refeeding (H. Ronge and J. Blum, unpublished observations). Nevertheless, it has been shown that protein intake in growing steers has decisive effects on SmC levels (Elsasser et al., 1986) and we also found a positive correlation between SmC and protein balance. However, energy and protein balances were strongly correlated in our experiments and thus the effects of energy and protein intake and balance are difficult to separate. Microbial protein synthesis in the rumen is greatly dependent on energy supply and there are important interactions between intermediary energy and protein metabolism (Macrae and Lobley, 1984).
Concentrations of STH increased after parturition, as shown previously (Hart, Bines, Morant and Ridley, 1978; Kunz and Blum, 1985). The increase was more marked the greater the degree of energy deficiency and tended to be elevated in cows undersupplied with protein and/or nitrogen, whereas very low STH levels were found in cows given high amounts of energy in the form of crystalline fat, indicating that STH is inversely related to energy intake (Blum et al., 1985a). This is in accordance with other studies in lactating and non-lactating cattle (Hart et al., 1978; Blum, Schnyder, Kunz, Blom, Bickel and Schiirch, 1985b) and in other species. STH inhibits lipogenesis and favours lipolysis, enhances gluconeogenesis, stimulates protein deposition and retention of certain minerals and causes insulin resistance (Hart and Johnnson, 1986). Thus, STH is involved in regulation of metabolic changes seen in high-yielding dairy cows particularly in early periods of lactation or during energy and protein deficiency. The stimulation of milk production by STH during established lactation is thought to be largely the consequence of enhanced availability of substrates (particularly glucose) to the mammary gland for milk synthesis, in part indirectly due to stimulation of blood flow through the udder, whereas a direct effect on mammary tissue has not yet been demonstrated (Hart and Johnsson, 1986; Karg and Mayer, 1987). How STH enhances the synthetic capacity of individual alveolar cells, which is expected to be a prerequisite for
enhanced milk formation, is unclear. However, specific SmC binding to bovine mammary tissue has been found (Baumrucker, 1986a and b). Thus, SmC could be important for mammary gland growth and alveolar cell regeneration, especially during the dry period. This is partially supported by much higher SmC levels during the 1st day post partum in colostrum than in blood (H. Ronge and J. W. Blum, unpublished observations). It remains to be shown whether SmC is produced locally in the mammary gland, is regulated and has effects distinct from SmC produced in the liver, i.e. 'systemic' SmC. Because we found low circulating SmC levels in early lactation, blood SmC effects on mammary tissue may be negligible during this time period.
Somatotropin is well known to enhance the production of SmC in liver, although a direct effect on SmC production in bovine liver cells has to our knowledge not yet been demonstrated. Furthermore, SmC levels increased during administration of STH in cattle (Davis, Gluckman, Hart and Henderson, 1987). Therefore, low levels of SmC in the presence of high concentrations of STH, i.e. a negative correlation between SmC and STH, as found in this study particularly in the first period of lactation, was unexpected. Several causes could be responsible for this paradoxical situation. Because SmC is markedly decreased in fasted animals, including cattle (H. Ronge and J. W. Blum, unpublished observations), the low energy (and protein) supply and hence decreased availability of energy yielding substrates and amino acids, in early lactation could be a primary link. Furthermore, SmC producing liver cells may be less sensitive or responsive to STH during energy and protein deficiency, as found in the rat (Maes, Underwood and Ketelsleger, 1984). Thus, SmC responses to exogenous STH are greatly decreased in heifers after 3 days of fasting and in high-yielding lactating cows in early lactation, as compared with the dry period (H. Ronge and J. W. Blum, unpublished observations). Similarly, SmC responses to STH were reduced in humans during starvation (Merimee, Zapf and Froesch, 1982). Low circulating insulin and thyroid
181
hormone levels, as found in this study, may contribute to a smaller effect of STH on SmC production because the presence of these hormones is known to be essential for, STH to induce its effect in liver tissue and other hormones, such as cortisol, may directly decrease SmC production (Spencer, 1985). In addition, disturbed functioning of liver cells, including SmC producing cells, as a consequence of energy deficiency (Mills et al., 1986), may also cause reduced SmC synthesis.
High circulating STH and relatively low blood levels of SmC and insulin in early lactation should change metabolism in a direction favouring high milk yield by mobilization and enhanced oxidation of fat, but reduced oxidation of glucose, which is preferentially needed for lactose synthesis. On the other hand, high SmC and insulin together with normal STH concentrations during the recovery period of lactation and during the dry period can be expected to stimulate deposition of body tissues, such as fat, muscle and bone. The typical changes of T4 and T, seen also in this study during the
lactation cycle seems to be primarily associated with shifts in energy metabolism, especially heat production (Blum, Kunz, Leuenberger, Gautschi and Keller, 1983; Blum et al., 1985a; Kunz and Blum, 1985; Kunz et al., 1985). They are known to modify the sensitivity of various tissues such as the liver to STH (Spencer, 1985) or other hormones. We have also proposed that low T4 and T, concentrations in early lactation
could help to conserve muscle mass (Blum et al., 1985a). This is thought to be an important effect also of STH, but only when insulin circulates in normal amounts (Bines, Hart and Morant, 1980).
In conclusion, the changes of SmC seen in these experiments seem to be primarily regulated by energy balance and secondly by protein balance. The reduced production of SmC, while STH is elevated, might additionally be influenced by low insulin, T, and T4, as a consequence of the negative
energy balances. Thus, rather than a single endocrine factor, only a well orchestrated interplay of various endocrine systems will enable cows finally to produce high amounts of milk.
ACKNOWLEDGEMENT
This study was supported by a grant of the 'Schweiz. Vcrband fur Kiinstliche Besamung'. We thank Dr P. Kunz (Institute of Animal Science, Federal Insitituc of Technology, 8092 Zurich) for providing us with the data of glucose, nonesterified fatty acids, ketone bodies and urea of experiment B. Prof. J. Zapf and Mrs I. Einschenk (Laboratory of Metabolism, Department of Internal Medicine, University Hospital of Zurich) are particularly thanked for their great help in development of the radioimmunoassay for the determination of SmC. The technical assistance of Miss C. Morel, Mrs V. Neuhaus, Mr Barman and Mr W. Moses is greatly appreciated.
REFERENCES
BAUMAN, D. E. and CURRIE, W. B. 1980. Partitioning
of nutrients during pregnancy and lactation: a review of mechanisms involving homeostatis and homeorhesis.
Journal of Dairy Science 63: 1514-1529.
BAUMRUCKER, C. R. 1986a. Insulin-like growth factor I (IGF-I) and insulin stimulates lactating bovine mammary tissue DNA synthesis and milk production in vitro. Journal of Dairy Science 69: Suppl. 1, p. 120 (Abstr.).
BAUMRUCKER. C. R. 1986b. Insulin-like growth factor I (IGF-I) and insulin stimulates DNA synthesis in bovine mammary tissue explants obtained from pregnant cows.
Journal of Dairy Science 69: Suppl. 1, p. 120 (Abstr.). BENNINK, M. A., MELEENBERGER, R. W., FROBISH,
R. A. and BAUMAN, D. E. 1972. Glucose oxidation and entry rate as affected by the initiation of lactation.
Journal of Dairy Science 55: 712 (Abstr.).
BICKEL, H. and LANDIS, J. 1978. Das neue System der
encrgetischen Bewertung von Wiederkiiuerfutter.
Schweizeizerische Landwirtschafiliche Monatshefle 56:
280-292.
BINDER, H. 1986. Verlauf der peripheren Scxualhormonkonzcntrationen und der Laktationskurve bei traechtigen und untraechtigen Kuehen. Thesis in
Veterinary Medicine, University of Zurich.
BINES, J. A., HART, I. C. and MORANT. S. V. 1980.
Endocrine control of energy metabolism in the cow: the effect on milk yield and levels of some blood constituents of injecting growth hormone and growth hormone fragments. British Journal of Nutrition 43:
179-189.
BINES, J. A., HART, I. C. and MORANT, S. V. 1983.
Endocrine control of energy metabolism in the cow: diurnal variations in the concentration of hormones and metabolites in the blood plasma of beef and dairy cows. Hormone and Metabolic Research 15: 330-334.
BINNERIS, W. T.. ADRICHEM P. W. M. VAN, OlJDENAARDEN, C . P . J . , VoGT. J . E . a n d
WASSENAAR. J. E. 1982. Plasma somatomedin in dairy cows: effect of management and feeding levels.
Netherlands Milk and Dairy Journal 36: 149-152. BLUM, J. W., JANS, F., MOSES, W., FKOHEI, D., ZEMP.
M.. WANNER, M., HART, I. C , THUN, R. and
hormone and metabolite concentrations in high-yielding dairy cows: effects of feeding low or high amounts of starch, or crystalline fat. Zentralblatt fur
Veterindrmedizin 32: 401-418.
BLUM, J. W., KUNZ, P., LEUENBERGER, H., GAUTSCHI,'
K. and KELLER, M. 1983. Thyroid hormones, blood plasma metabolites and haematological parameters in relationship to milk yield in dairy cows. Animal
Production 36: 93-104.
BLUM, J. W., SCHNYDER, W., KUNZ, P. L., BLOM,
A. K., BICKEL, H. and SCHURCH, A. 1985b. Reduced
and compensatory growth: endocrine and metabolic changes during food restriction and refeeding in steers.
Journal of Nutrition 115: 417-424.
BREIER, B. H., BASS, J. J., BUTLER, J. H. and
GLUCKMAN, P. D. 1986. The somatrophic axis in young steers: influence of nutritional status on pulsatile release of growth hormone and circulating concentrations of insulin-like growth factor I. Journal
of Endocrinology 111: 209-215.
CAMPBELL, P. G. and BAUMRUCKER, C. R. 1986.
Characterization of insulin-like growth factor-1/somatomedin C receptors in the bovine mammary gland. Journal of Dairy Science 69: Suppl. I, p. 163 (Abstr.).
CHILLIARD, Y. 1987. [Literature survey: body composition and lipid metabolism in adipose tissues and liver during pregnancy and lactation. 2. In the ewe and the cow].
Reproduction, nutrition, Developpement 27: 327-398.
CHILLIARD, Y., REMOND, B., SAUVANT, D. and
VERMOREL, M. 1983. Particularity du metabolisme energetique des hautes productrices do lait. Bulletin
Technique Centre de Recherches Zootechniques et Veterinaires de Theix, INRA 53: 37-64.
CLEMENT, C. 1988. Adaptations mctaboliques et endocrinologiques a differents deficits proteiques chez des vaches a hautes productions laitieres. Thesis in
Veterinary Medicine, University of Berne.
COLLIER, R. J., MCNAMARA, J. P., WALLACE, C. R.
and DEHOFF. M. H. 1984. A review of endocrine regulation of metabolism during lactation. Journal of
Animal Science 59: 498-510.
DAUGHADAY, W. H., MARIZ, I. K and BLLIHEN, S. L.
1980. Inhibition of access of bound somatomedin to membrane receptor and immunobinding sites: a comparison of radiorcccptor and radioimmunoassay of somatomedin in native and acid-ethanol-extractcd serum. Journal of Clinical Endocrinology and
Metabolism 51: 781-788.
DAVIS, S. R., GLUCKMAN, P. D., HART. I. C. and
HENDERSON, H. V. 1987. Effects of injecting growth hormone or thyroxine on milk production and blood plasma concentrations of insulin-like growth factor I and II in dairy cows. Journal of Endocrinology 114: 17-24.
EI.SASSER, T. H.. RUMSEY, T. S. and HAMMOND, A. C.
1986. Dietary regulation of plasma somatomedin C in beef cattle. American Journal of Clinical Nutrition 43/6: 149 (Abstr.).
FALCONER, J., FORBFS. J. M., BINES, J. A., R O Y ,
J. H. B. and HART, I. C. 1980. Somatomedin-like
activity in cattle: the effect of breed, lactation and time of day. Journal of Endocrinology 86: 183-188.
FROESCH, E. R. and ZAPF, J. 1985. Insulin-like growth
factors and insulin: comparative aspects. Diabetologia 28: 485-493.
GLUCKMAN, P. D. 1986. The regulation of fetal growth. In Control and Manipulation of Animal Growth (ed. P. J. Buttery, D. B. Lindsay and N. B. Haynes), pp. 85-104. Butterworths, London.
HART, I. C. 1983. Endocrine control of nutrient partition in lactating ruminants. Proceedings of the Nutrition
Society 42: 181-194.
HART, I. C , BINES, J. A., MORANT, S. V. and RIDLEY,
J. L. 1978. Endocrine control of energy metabolism in the cow: comparison of the levels of hormones (prolactin, growth hormone, insulin and thyroxine) and metabolites in the plasma of high- and low-yielding cattle at various stages of lactation. Journal of
Endocrinology 11: 333-345.
HART, I. C , FLUX, D. S., ANDREWS, P. and MCNEILLY,
A. S. 1975. Radio-immunoassay for ovine and caprine growth hormone: its application to the measurement of basal circulating levels of growth hormone in the goat.
Hormone and Metabolic Research 7: 35-40.
HART, I. C. and JOHNSSON, I. D. 1986. Growth hormone
and growth in meat producing animals. In Control and
Manipulation of Animal Growth (ed. P. J. Buttery,
D. B. Lindsay and N. B. Haynes), pp. 135-159. Butterworths, London.
HONEGGER, A. and HUMBEL, R. E. 1986. Insulin-like
growth factor I and II in fetal and adult bovine serum.
Journal of Biological Chemistry 261: 569-575.
KARG, H. and MAYER, H. 1987. Manipulation der
Laktation. Uebersichten zur Tierernahrung 15: 29-58.
KLAPPER, D. G., SVOBODA, M. E. and WYK, J. J. VAN.
1983. Sequence analysis of somatomedin C: confirmation of identity with insulin-like growth factor I. Endocrinology 111: 2215-2217.
KUNZ, P. and BLUM, J. W. 1985. Relationships between
energy balances and blood levels of hormones and metabolites in dairy cows durittg late pregnancy and early lactation. Zeitschrift fur Tierphysiologie,
Tierernahrung und Futtermittelkunde 54: 239-248.
KUNZ, P. L., BLUM, J. W., HART, I. C , BICKEL, H.
and LANDIS, J. 1985. Effects of different energy intakes before and after calving on food intake, performance and blood hormones and metabolites in dairy cows. Animal Production 40: 219-231.
LANDIS, J. 1979. Die Energie- und Proteinversorgung der Milchkuh. Schweizerische Landwirtschaftliche
Monatshefte 57: 381-390.
LEUENBERGER, H., KUNZ, P. and MICHEL, A. 1987. Die
Fiitterung der Milchkuh ohne Kraftfutter. Schriften der
Schweizerischen Vereinigung fur Tierzucht 68: 47-62.
MCCUTCHEON, S. N. and BAUMAN. D. E. 1986. Effect
of pattern of administration of bovine growth hormone on lactational performance of dairy cows. Journal of
Dairy Science 69: 38-43.
MACRAE, J. C. and LOBLEY. G. E. 1984. Interactions
between energy and protein. In Control of Digestion
and Metabolism in Ruminants (ed. L. P. Milligan,
W. L. Grovum and A. Dobson), pp. 367-385. Reston Books, New Jersey.
MAES, M., UNDERWOOD. L. E. and KETELSLFGFR. J.-M.
183
relationship with changes in liver somatogenic and lactogenic binding sites. Molecular and Cellular
Endocrinology 37: 301-309.
MERIMEE, T. J., ZAPF, J. and FROKSCH, E. R. 1982.
Insulin-like growth factors in the fed and fasted states.
Journal of Clinical Endocrinology and' Metabolism 55:
999-1002.
MILLS, S. E., BEITZ, D. C. and YOUNG, J. W. 1986.
Characterization of metabolic changes during a protocol for inducing lactation ketosis in dairy cows. Journal of
Dairy Science 69: 352-361.
MOE, P. W. 1981. Energy metabolism of dairy cattle.
Journal of Dairy Science 74: 1120-1139.
OLDHAM, J. D., BROSTER, W. H., NAPPER, D. J. and
SIVITF.R, J. W. 1979. The effect of a low-protein ration on milk yield and plasma metabolites in Friesian heifers during early lactation. British Journal of
Nutrition 42: 149-162.
OLTNER, R. and WIKTORSSON, H. 1983. Urea
concentrations in milk and blood as influenced by feeding varying amounts of protein and energy to dairy cows. Livestock Production Science 10: 457-467.
RF.MESY, C , CHILLIARD, Y., RAYSSIGUIKR, Y., MAZUR,
A. and DEMIGNE, C. 1986. Le metabolisme hepatique des glucides ct des lipides chez les ruminants: principales interactions durant la gestation et la lactation. Reproduction, Nutrition, Developpement 26: 205-226.
SALACINSKI, P. R. P., MCLEAN, C , SYKES, J. E. C , CLEMENT-JONES, V. V. and LOWRY, P. J. 1981.
lodination of proteins, glycoproteins, and peptides using a solid-phase oxidizing agent, l,3,4,6-tetrachloro-3, 6-diphenyI glycoril (Iodogen). Analytical Biochemistry 117: 136-146.
SILLENCE, M. N. and ETHERTON, T. D. 1987.
Determination of the temporal relationship between porcine growth hormone, serum IGF-I and cortisol concentrations in pigs. Journal of Animal Science 64: 1019-1023.
SPENCER, G. S. G. 1985. Hormonal systems regulating growth. A review. Livestock Production Science 12: 31-46.
TUCKER, H. A. 1981. Physiological control of mammary growth, lactogenesis and lactation. Journal of Dairy
Science 64: 1403-1421.
TUCKER, H. A. and MERKEL, R. 1987. Applications of
hormones in the metabolic regulation of growth and lactation in ruminants. Federation Proceedings 46: 300-306.
UNDERWOOD, L. E., CLEMMONS, D. R., MAES, M., D'ERCOLH, A. J. and KBTELSLEGERS, J.-M. 1986.
Regulations of somatomedin-C/insulin-like growth factor I by nutrients. Hormone Research 24: 166-176.
UNDERWOOD, L. E. and D'ERCOLE, A. J. 1984. Insulin
and insulin-like growth factors/somatomedins in fetal and neonatal development. Clinics in Endocrinology
and Metabolism 13: 69-89.
ZAPF, J. HAURI, C , WALDVOGEL, M. and FROESCH,
E. R. 1986. Acute metabolic effects and half-lives of intravenously administered insulin-like growth factor I and II in normal and hypophysectomized rats. Journal
of Clinical Investigation 77: 1768-1774.
ZAPF, J., WALTER, H. and FROESCH, E. R. 1981.
Radioimmunological determination of insulin-like growth factor I and II in normal subjects and in patients with growth disorders and extrapancreatic tumor hypoglycemia. Journal of Clinical Investigation 68: 1321-1330.