HAL Id: hal-02870529
https://hal-cnam.archives-ouvertes.fr/hal-02870529
Submitted on 17 Jun 2020HAL is a multi-disciplinary open access archive for the deposit and dissemination of sci-entific research documents, whether they are pub-lished or not. The documents may come from teaching and research institutions in France or abroad, or from public or private research centers.
L’archive ouverte pluridisciplinaire HAL, est destinée au dépôt et à la diffusion de documents scientifiques de niveau recherche, publiés ou non, émanant des établissements d’enseignement et de recherche français ou étrangers, des laboratoires publics ou privés.
Are French Football Fans Sensitive to Outcome
Uncertainty
Luc Arrondel, Richard Duhautois
To cite this version:
Luc Arrondel, Richard Duhautois. Are French Football Fans Sensitive to Outcome Uncer-tainty. Economie et Statistique / Economics and Statistics, INSEE, 2020, pp.5-26. �10.24187/eco-stat.2019.513.2001�. �hal-02870529�
Uncertainty?
Luc Arrondel* and Richard Duhautois**
Abstract – The idea that competitive balance increases the utility of fans, and therefore their spending and the revenue of professional clubs, lies at the heart of sports economics in general and the economics of football in particular. This notion of competitive balance is often invoked to explain the decisions of professional leagues to change the rules of competitions or the dis‑ tribution of TV rights. However, the empirical literature shows that the relationship between competitive balance and fan demand is far from obvious. In this paper, we examine the idea of competitive balance as perceived by football fans. In the case of Ligue 1, it is mainly explained by medium‑ and long‑term uncertainty, while in the case of the Champions League it is more a matter of long‑term suspense. But uncertainty over the outcome is far from being the only factor explaining the demand for football since around 30% of fans report that they would always be willing to attend or watch games even in the hypothetical case that there is no suspense left. JEL Classification: D12, L83
Keywords: competitive balance, uncertainty of outcome hypothesis, demand for football
* CNRS, PSE (luc.arrondel@ens.fr) ; ** CNAM (richard.duhautois@lecnam.net)
The authors are particularly grateful to Jean Le Bail of the sports newspaper L’Équipe, without whom the survey used in this paper would not have been possible. The comments of two anonymous reviewers were particularly helpful.
Received on 22 July 2018, accepted after revisions on 12 July 2019.
Translated from: “Les supporters français de football sont‑ils sensibles à l’incertitude du résultat ?”
Citation: Arrondel, L. & Duhautois, R. (2019). Are French Football Fans Sensitive to Outcome Uncertainty? Economie et Statistique / Economics and Statistics, 513, 5–26. https://doi.org/10.24187/ecostat.2019.513.2001
Reminder:
The opinions and analyses in this article are those of the author(s) and do not
necessarily reflect their institution’
s or Insee’
T
he uncertainty of outcome hypothesis (UOH) has been a central hypothesis in sport economics since the 1950s (Rottenberg, 1956) in attempts to explain sport spectator “consumption” behaviour. The idea is that championships with unbalanced competitions – for example, where one team is superior to all the other teams – have a negative effect on fan “demand”, leading to a drop in stadium atten ‑ dance and television ratings and, consequently, to a drop in club revenue. The notion of balance in competitions is termed “competitive balance”. Neale (1964) distinguished between the uncer‑ tainty of the outcome at the match level (the Louis‑Schmeling paradox1) and the uncertainty of the outcome of a competition (e.g. the French Ligue 1 football championship), which he terms the “League Standing effect”: if teams in a league are of equal strength, there will be regu‑ lar changes in the standings, thereby increasing spectator interest and, therefore, revenues. However, most empirical studies of professional football have found no relationship betweenoutcome uncertainty and fan demand (see in Appendix 1 an annotated list of relevant studies). Thus, for example, research shows that stadium attendance is high in England and Germany but relatively low in France and Italy, without there being any evidence of a relationship with the competitive balance of the championships since the French league was associated with the highest level of uncertainty until the takeover of Paris Saint‑Germain Football Club (PSG) by Qatar (Andreff, 2014, 2018).1
The first reason is that the attractiveness of competitions depends on how they are run (see Box 1). An important distinction is between open leagues based on a promotion and relega‑ tion system (such as European football leagues) and closed leagues with no such system (such as North American leagues). In closed leagues, the
1. The idea behind the paradox is based on the following events: when, after a series of crushing victories, boxer Joe Louis suffered the first defeat of his professional career against Max Schmeling in 1936 (after 23 conse‑ cutive victories), interest in the American boxer paradoxically increased rapidly, as did his earnings.
Box 1 – The Organisation of Football in France and Europe
France’s national football leagues – in common with all European leagues – are based on a pyramidal struc‑ ture. One of their key characteristics is the system of promotions (with teams moving up to the league above) and relegations (teams moving down to the league below). Competitions based on this model are known as “open leagues”, in contrast to the North American “closed league” model, where the promotion and relega‑ tion system does not apply. Closed leagues are based instead on the salary cap and draft systems, which allow teams to be rebalanced from one season to the next. Although the salary cap and draft systems are associa‑ ted with specific rules in different sports, their goal is invariably to ensure, first, that each franchise (i.e. team) has the same wage bill and, second, to ensure that the bottom‑ranked team gets to select the best players. The number of promoted and relegated teams in the various European leagues varies in each division and has changed many times over the years. In France’s two highest divisions (Ligue 1 and Ligue 2), all clubs are required to be professional: most are sociétés anonymes
sportives professionnelles (professional sports limited
company, or SASP), a status introduced at the end of the 1990s allowing, among other things, for dividends to be distributed. In the major European championships, the first and second divisions are generally the profes‑ sional divisions. In England, the top four leagues are professional, and most clubs have been companies since the first professional league was formed in 1888.
Next come the amateur football divisions, with clubs operating as associations with non‑professional players. Since the 2017‑2018 season, France’s national ama‑ teur divisions have been called the “National 1” league, the “National 2” league (formerly the French Amateur Championship, or CFA) and the “National 3” league (formerly CFA 2). Most of the teams that play in these leagues are amateur clubs. Clubs that move down from
Ligue 2 to National 1 are entitled to remain professio‑
nal for a period of two years. Clubs return to amateur status if they fail to make it back into Ligue 2 after two seasons. Below the national level, competitions are held at the regional level, managed by the leagues of each region, and at the departmental level, managed by departmental “districts”. A reform of the existing system was completed during the 2018‑2019 season. International (i.e. European) competitions – the Champions League and the Europa League – are reser‑ ved for teams from the various national leagues that have met certain sporting criteria, either as winners of their league and national cups or as the top‑ranked teams in the league (the number varies from country to country). Because of the large number of teams, there are preli‑ minary rounds before the final stages. The final stages involve two phases: first, a mini championship involving groups of four teams (each team plays six matches, at home and away from home) and then, for the first two in each group, knockout matches (at home and away from home), from the round or sixteen or thirty‑two.
geographical proximity of teams from the same city in competing leagues allows consumers to switch stadiums if outcome uncertainty decreases. In European football, there tends to be less competition between national leagues precisely because they are split into separate ranked divisions (Ligue 1, Ligue 2, National, etc.). Above all, the rivalry between European teams based in the same city has often emerged along class or religious lines, which “morally” prohibit fans from “switching” clubs (Kuper & Szymanski, 2018). The second reason is that fan demand in football is not simply a matter of consumer behaviour. Fans prefer to see their favourite club win (Buraimo & Simmons, 2008) and to watch a famous team play even if it is a far superior team (Pawlowski & Anders, 2012).
Generally speaking, aside from uncertainty, the literature has identified five potential factors influencing the demand for football (Caruso et al., 2019):
(1) Sporting performance: the better the team performs, the higher the level of attendance at the stadium.
(2) The quality of matches: the greater the quality of the two teams, the greater the number of spec‑ tators. Thus, the lower the team’s ranking in the league table, the lower stadium attendance tends to be.
(3) Comfort: the newer the stadium, the greater the likelihood of supporters travelling to watch games; supporters are also sensitive to weather conditions and match schedules.
(4) Price, although fans’ sensitivity to ticket prices depends on which teams are playing. (5) Television broadcasting of matches: while broadcasting can compete with stadium atten‑ dance, overall demand has increased sharply since the massive increase in match broadcasting in the 1990s.
One of the key features of all studies devoted to the effect of uncertainty on football demand is that uncertainty is invariably measured by a priori match and team data rather than fan perceptions (see Box 2). Such an approach requires data, but surveys on the “consumption” of football are long and difficult to administer. For example, Pawlowski (2013) conducted around 1,000 interviews over a period of two months in six stadiums and several bars in Germany using a limited number of questions. Outcome uncertainty is thus measured subjectively, i.e. as perceived by fans. The results of Pawlowski’s study show that fans are sensitive to uncertainty and believe that Germany’s top‑flight football league is sufficiently balanced to justify con ‑ tinuing to attend or watch games.
An original survey was conducted for the purposes of the present study at the end of the 2015‑2016 season to better understand the behaviour of football fans in France. The questionnaire was published online at the end of May on the website of the sports newspaper L’Équipe (lequipe.fr), generating more than 22,000 responses. Drawing on the information collected as part of the survey, an analysis, based for the first time on French data, is conducted of the factors that account for competitive balance as perceived by fans.
Box 2 – The Different Measures of Uncertainty
Competitive balance (CB) and the uncertainty of out‑ come hypothesis (UOH) are closely related and are often treated as interchangeable, with a few diffe‑ rences. UOH is treated as a forward‑looking ex ante concept, defined in terms of the probability distribu‑ tion of possible outcomes. By contrast, measures of CB are generally retrospective. However, the main difference between the two notions lies in the short term, with a more pronounced dimension on the uncertainty of the matches as well as uncertainty during the season.
As noted above, different time dimensions are relevant to measuring outcome uncertainty: the short term, the medium term and the long term.
Short‑term uncertainty is the most commonly studied
dimension. ST uncertainty is measured using two main sources of information: statistics on the relative per‑ formance of the two teams before a match and sports betting odds (see Appendix 1).
Medium‑term uncertainty is the degree of uncertainty
within the championship, i.e. winning the champion‑ ship, qualifying for European competitions and rele‑ gation. MT uncertainty is measured using indicators of concentration such as the Gini index.
Long‑term uncertainty refers to the long‑term dominance
of one team or of a small number of teams. LT uncertainty is measured using indicators such as the Herfindahl‑ Hirschman index, the variation of Gini indices, etc.
Competitive balance may relate to the short term (e.g. the outcome of a match), the medium term (e.g. the outcome of a championship in a given season) or the long term (e.g. repeat winners). The results show:
‑ That fans believe the suspense of champion‑ ships varies depending on the competition; ‑ That without any uncertainty, approximately 30% of respondents would still continue to attend or watch games;
‑ That the perceived competitive balance of Ligue 1 is explained as much by medium‑ and long‑term uncertainty as that of the Champions League is explained primarily by long‑term uncertainty, i.e. about who wins the competition each year.
1. The Relationship between
Uncertainty and the Demand
for Football: A Literature Review
To estimate the relationship between fan demand and UOH, many studies have related stadium attendance to measures of competitive balance based on inequality indicators applied to league rankings. The earliest studies in this area were conducted on the English, Scottish and German leagues, while the most recent research has focused on other leagues (Brazilian, Portuguese, etc.). Falter & Pérignon (2000) and Falter et al. (2008) examined the French first division, although their core focus was not the effect of uncertainty but rather the determinants of football demand. For example, the regional economic environment is a key factor: the lower the wages and the higher the unemployment rate, the more likely people are to go to the stadium, reflecting the popularity of football.
Studies in this area initially focused on stadium attendance, while later studies have tended to concentrate on television audience demand following the increase in football broadcasting.2 Meanwhile, other studies have sought to assess the possible substitution between stadium atten‑ dance and television broadcasting.
1.1. The Effects of Uncertainty on Stadium Attendance
Hart et al. (1975) examined the effect of the difference in rankings on stadium attendance among four teams in the English league between
1969 and 1972. The authors found no significant effect, a conclusion often reached in subsequent studies. Two studies of the Scottish Football League (Jennett, 1984; Cairns, 1987) found that outcome uncertainty positively influences stadium attendance, in line with the results of Rottenberg (1956) and American sports. The measures of uncertainty used include the difference in team rankings and the number of points needed to win the championship, i.e. short‑ and medium‑term uncertainty. Jennett (1984) in particular showed that if a team still has a chance of winning the league, it will attract more people. Wilson & Sim (1995) reached the same conclusion using data from the Malaysia Premier League. Baimbridge et al. (1996) found no relationship between uncertainty variables and stadium attendance in examining the case of England. Simply put, they show that attendance gradually falls until the middle of the season before subsequently rising. Peel & Thomas (1988, 1992) examined the effect of uncertainty on stadium attendance in England’s four professional divisions using the a priori probability of home team success based on sports bets. Their results show a positive relationship between the probability of winning and stadium attendance, meaning that what drives fans is not uncertainty but the fact of seeing their team win. What fans want to see above all else are goals. Peel & Thomas (1996) further examined the effect of uncertainty by focusing on the top three Scottish divisions. One of the interesting points about these championships is that teams play against each other several times at home (in repeat fixtures) during the same season. This provides a degree of control over match charac‑ teristics. Their results support the findings of Peel & Thomas (1992): the relationship between stadium attendance and home team probability of success is a U‑shaped curve, with fans being driven primarily by an easy win or a feat. Buraimo & Simmons (2008, 2009) examined the top divisions in England and Spain respectively and found the same U‑shaped relationship.2 Finally, establishing the actual demand for foot‑ ball is no easy task because of stadium capacity constraints. Czarnitzki & Stadtmann (2002) and Benz et al. (2009) examined the German premier league by seeking to take this constraint into account, but arrived at the same result, finding
2. Until 1983 in England and 1984 in France, league matches were not broadcast live on television. Football stakeholders feared that the compe‑ tition generated by broadcasting might adversely impact stadium atten‑ dance. Some cup matches (European Cups, World Cups, Euros, National Cups, etc.) have been broadcast live since 1937, the year the first match was broadcast live (English Cup Final).
no effect of uncertainty on stadium attendance. The most recent studies in this area (Anders & Pavlowski, 2012; Cox, 2015; Bedina & Pershakov, 2017) also point in this direction. However, the study by Jang and Lee (2015) is worth noting, with the authors concluding that uncertainty has an effect in the South Korean league. 1.2.
Does Broadcasting Games
on Television Have an Effect on Stadium Attendance?
Today, the demand for football can no longer be reduced to stadium attendance. Since the late 1980s, the number of football matches – and indeed many other competitions – broadcast on television has sky‑rocketed. For this reason, broadcasting rights have become the main source of funding for professional football, enabling the major European clubs in particular to buy the best players at a premium price and to fill stadiums. The fact that all league games are broadcast on television can have a negative effect on stadium attendance but has a positive effect on overall demand. Garcia & Rodriguez (2002) examined the variables accounting for stadium attendance in the Spanish league between 1993 and 1996. Their results show that matches broadcast on television and midweek games attract the smallest audiences. The evidence shows that the effect of broad‑ casting is greater when matches are broadcast on a free channel. Buraimo & Simmons (2009) reached the same conclusion using data from Spain’s top division. Forrest et al. (2004) found a similar relationship in their study of England’s top division between 1992 and 2001 and showed that weekend matches are not necessarily associ‑ ated with a drop in stadium attendance. Rather, attendance was again found to be dependent on the type of channel broadcasting the match (i.e. free or paid). Buraimo & Simmons (2008) found the opposite effect: in the same championship between 2001 and 2006, matches broadcast at weekends led to a slight drop in stadium attendance, while those broadcast midweek had no effect. Buraimo et al. (2006) examined the determinants of stadium attendance in the English second division between 1998 and 2004. The authors showed that broadcasting a match on a free channel reduces stadium attendance by more than 20% (5% on a pay channel). They also found that when “higher‑end” matches – i.e. either matches involving the best top‑flight teams or international matches – are held at the same time, spectators tend to travel less. Allan & Roy (2008) drew a distinction between three categories of
spectators: season ticket holders, occasional (“pay‑at‑the‑gate”) home team supporters and pay‑at‑the gate visiting team supporters (who may of course be season ticket holders at the visiting team’s stadium). Unsurprisingly, the evidence showed that season ticket holders do not change their habits and continue to go to the stadium even if the match is broadcast on television, as do visiting team supporters, who are highly motivated, while stadium attendance by pay‑at‑the gate spectators falls by around 30%. 1.3.
Uncertainty Has a Greater Effect on Television Audience Demand
While the effect of uncertainty on stadium atten‑ dance is rarely significant, its effect on television audience demand appears to be slightly greater. Forrest et al. (2005) showed that outcome uncer‑ tainty has a positive effect on TV audiences in the case of top‑flight English matches. Buraimo (2008) found no significant effect of uncertainty but a positive effect of star quality and the number of spectators in the stadium. Buraimo & Simmons (2015) studied the English league seasons over the 2000s decade and showed that uncertainty only had a positive effect in the first two seasons, confirming the idea that the biggest draw for TV viewers is watching the best players in the world. By contrast, Buraimo & Simmons (2009) found a significant relationship between television viewers and outcome uncertainty in their study of the Spanish league. Alavy et al. (2010) examined the minute‑by‑minute tele‑ vision behaviour of viewers of English league matches and found that viewers tend to switch channels when a draw looks likely. Schreyer et al. (2016, 2017) showed that uncertainty has a positive effect on TV viewers during high‑stakes games in major international competitions and during league matches but has no significant effect during national cup matches. Lastly, Caruso et al. (2019) examined the Italian league and concluded that what attracts fans are stars and winning teams. Thus, a 1% increase in the wage bill of teams that play each other increases the number of TV viewers by around 0.75%, while a 1% increase in average points increases the number of viewers by around 0.7%.
2. Surveying and Measuring
the “Suspense” of Competitions
An original questionnaire containing approx ‑ imately 100 questions (including on the socio‑
demographic characteristics of the respondents) was used to study the effects of uncertainty on football consumption in France. The survey 'Quel supporter êtes-vous?' (What kind of fan are you?) was made available online in late May, at the end of the 2015‑2016 season, for a period of three days on the website of the French sports newspaper L’Équipe (lequipe.fr). The final database contains 21,716 observations, some with missing values. The questionnaire took approximately twenty minutes to complete. Since this is the first fan survey of this kind, it is difficult to determine how representative it is. According to Nielsen Sport (2018), 50% of the French over the age of sixteen claim to be “interested” or “very interested” in football. Of the 50% with an interest in football, approxi‑ mately 85% appear to be “fans” of at least one Ligue 1 team. According to Statista (2018), the fan population is predominantly male (63%) and significantly younger than the total population (with the over 65s being half as represented, i.e. 8% compared to 16%). The definition of “supporter” can be narrowed even further by distinguishing between “ardent fans”, “enthusi‑ asts” and “fans”, i.e. those who “systematically or almost systematically” follow football competitions and news.
In all likelihood, the “football enthusiast” sub‑group was the key population that responded to the survey on the L’Équipe website (see Table 2): members of the sub‑group are clearly younger than the general population of supporters (less than 2% are aged over 60) and women appear to be largely underrepresented (less than 5%). In relation to usual visitors to the website of the sports newspaper, the repre‑ sentativeness biases tend in the same direction. To take into account the specificities of the sample used, the study involved specific processing operations based on age (18‑26 age group as compared to those aged over 26) to confirm the main findings (see Appendix 2).
Table 1 summarises the distribution of variables reflecting interest in and consumption of foot‑ ball and the socio‑demographic characteristics of the respondents. Unsurprisingly, almost all the respondents were found to be very inter‑ ested in the various European competitions – except for Ligue 2, in which only a minority of ardent fans have an interest – and to be avid consumers of football, both on television and at the stadium. Most were men (96.5%), young (almost 85% were aged under 40) and living alone (55.2%) relatively far from stadiums (the
median distance between the place of residence and the stadium was 75 kilometres). Most of the respondents were in the labour market (63.1%) and almost 20% earned more than 30,000 euros per year. Lastly, 25% lived in the Paris region, 97% were French and two‑thirds had no children.
The initial focus was on the level of uncertainty as perceived by fans in the main professional football leagues in both France (Ligue 1 and Ligue 2) and Europe (Champions League and Europa League). The following question was asked about each league: “Over the last few seasons, how would you rate the ‘suspense’ of [the competition in question] (on a scale of 0: no suspense at all to 10: a lot of suspense)?” Figures I and II show the distribution of responses to these questions. In the case of Ligue 2, the Champions League and the Europa League, the results were roughly identical: the mode was 8 (relatively high suspense), the median 7 and the mean 6.64, 7.02 and 6.96 respectively. Pawlawski (2013) found similar results for the German league, with a mode of 8 but a slightly higher mean (slightly above 8) and a distribution highly concentrated around high values. This result may seem surprising for a league that has been dominated since the 1970s by Bayern Munich. On the other hand, in the case of Ligue 1, fans have incorporated the dominance of Paris Saint‑Germain since 2011 and its takeover by Qatar into their perception of suspense, with a mode of 0 (no suspense at all), a median of 3 and a mean of 3.36.
The appendix includes additional processing operations according to age and the teams supported. Although there are small percentage differences between “young” and “old”, the distributions have similar characteristics (see Figure A2‑I in Appendix). At most, there is a slight positive effect of young people on the perceived competitive balance of the Champions League.
Figure A2‑II shows the level of perceived suspense depending on the team supported. Four categories were selected (see Table A2‑1 in Appendix 2 on the season’s standings): the league champion (PSG, who finished 31 points ahead of the runner‑up), the teams qualified for European competitions (those ranked 2nd to 6th), those in the middle of the table (ranked 7th to 16th) and, lastly, those fighting to avoid relegation right up until the last match of the season (ranked 17th to 20th). The results show that those who support teams vying for
European qualification or fighting to avoid rele‑ gation perceive the highest level of suspense, unlike teams in the middle of the table, i.e. unchallenged clubs. PSG fans rate the level of suspense as neither high nor low. In other words, the competitive balance of Ligue 1 as perceived by fans is a highly subjective notion that appears to depend heavily on the ranking of the team supported. However, the individual perception of competitive intensity is a factor that must be taken into account when seeking to explain the “demand” for football.
3. Suspense and Fan Interest
in Football Competitions
To measure the effect of suspense on football consumption intentions, the following questions were asked about Ligue 1 and the Champions League, the two flagship competitions followed by fans living in France:
(1) “At what minimum level of suspense (on a scale of 0: no suspense at all to 10: a lot of suspense) would you be likely to lose interest in [the competition in question]?”
Table 1 – Respondent characteristics (N = 21,716) and variables of interest (%)
Interest in football (7‑10; 4‑6; 0‑3) (93.1; 5.8; 1.1) Interest in Ligue 1 (interested; not interested) (95.2; 4.8) Interest in Ligue 2 (interested; not interested) (44.7; 55.3) Interest in the Coupe de France (interested; not interested) (74.8; 25.2) Interest in the Champions League (interested; not interested) (96.3; 3.7) Interest in the Europa League (interested; not interested) (81.8; 18.2) Interest in the English Premier League (interested; not interested) (84.0; 16.0) Interest in the Spanish Liga (interested; not interested) (79.3; 20.7) Interest in the German Bundesliga (interested; not interested) (59.0; 41.0) Interest in the Italian Serie A (interested; not interested) (51.8; 48.2) Interest in other leagues (interested; not interested) (19.8; 80.2) Supporters club (no; yes) (82.5; 17.5)
Season ticket (no; yes) (83.8; 16.2)
Number of teams supported (none or one team; several teams) (79.4; 20.6) Degree of attachment to a team (7‑10; 4‑6; 0‑3) (93; 6; 1) Distance (in km) from your favourite team’s stadium (Q1; median; Q3) (19; 75; 450) Visiting sports websites online (no; yes) (12.9; 87.1) Reading written sports press (never; once a week; more than once a week) (16.7; 42.9; 40.4) Sports channel subscription (no; in the past; yes) (26.1; 12.1; 61.8) Plays or has played football (no; in the past; yes) (15.8; 51.8; 32.5) Football culture (non‑existent; low; medium; high; very high) (0.5; 0.9; 16.3; 54.8; 27.5) Having a father and/or mother who play(s)/used to play football (don’t know; no; yes) (2.5; 58.3; 39.2)
Gender (male, female) (96.5; 3.5)
Age (<26; 26‑40; 41‑60; >60) (44.8; 38.7; 14.6; 1.9) Nationality (French; other) (97.1; 2.9) Education (higher; secondary) (58.8; 41.2) Relationship status (single; in a relationship) (55.2; 44.8) Annual net wage (no income; <€30,000; >€30,000) (31.7; 48.6; 19.8) Labour market (employed; student or unemployed) (63.1; 36.9) Number of children (0; 1; 2; >2) (64,5; 11,6; 16,4; 7,5) Region (Paris region; province) (25.0; 75.0)
Reading note: 95.2% of respondents reported being interested in Ligue 1. Sources: PSE‑L’Équipe, survey Quel supporter êtes‑vous ? ‑ 2016.
Figure I – Perceived competitive balance in Ligue 1 and Ligue 2 0 5 10 15 20 25 30 0 1 2 3 4 5 6 7 8 9 10 Ligue 1 Ligue 2 %
Notes: 0 = “no suspense” / 10 = “a lot of suspense”. Ligue 1: 21,283 responses, 433 missing values; Ligue 2: 21,045 responses, 671 missing values. Reading note: 18% of fans feel there is no suspense in Ligue 1.
Sources: PSE‑L’Équipe, survey Quel supporter êtes‑vous ? ‑ 2016.
Figure II – Perceived competitive balance in the Champions League and the Europa League
0 5 10 15 20 25 30 0 1 2 3 4 5 6 7 8 9 10
Champions League Europa League %
Notes: 0 = “no suspense” / 10 = “a lot of suspense”. Champions League: 21,604 responses, 112 missing values; Europa League: 21,513 res‑ ponses, 203 missing values.
Reading note: 25% of fans feel there is a lot of suspense (8 out 10) in the Champions League. Sources: PSE‑L’Équipe, survey Quel supporter êtes‑vous ? ‑ 2016.
(2) “At what minimum level of suspense (on a scale of 0: no suspense at all to 10: a lot of suspense) would you be likely to stop going to the stadium to watch [the competition in question]?”
(3) “At what minimum level of suspense (on a scale of 0: no suspense at all to 10: a lot of suspense) would you be likely to stop watching [the competition in question] on TV?”
Figue III – Football consumption intentions
A – Intention not to stop following
0 10 20 30 40 50 60 70 80 90 100 10 Ligue 1 % Champions League 0 1 2 3 4 5 6 7 8 9
Reading note: 70% of fans will remain interested in Ligue 1 and the Champions League if the level of suspense is 4.
B – Intention not to stop attending matches
0 10 20 30 40 50 60 70 80 90 100 Ligue 1 % Champions League 10 9 8 7 6 5 4 3 2 1 0
Reading note: 66% of fans will continue to attend Champions League football matches if the level of suspense is 4.
C – Intention not to stop watching matches on television
0 10 20 30 40 50 60 70 80 90 100 Ligue 1 % Champions League 10 9 8 7 6 5 4 3 2 1 0
Reading note: 70% of fans will continue to attend Champions League football matches if the level of suspense is 4. Notes: 0 = “no suspense” / 10 = “a lot of suspense”.
The first question relates to “total demand”, the second question to “stadium” demand and the third question to “television” demand. Figures III‑A to III‑C summarise the responses to these three questions. The curves were plotted as a survival function using the Kaplan‑Meier estimator. The results obtained from the questions are ranked from highest to lowest (10 to 0) and the number of responses is added together. The proportion of individuals who “survive” after each level of “suspense” is then calculated. Thus, if the uncertainty was at its highest level (value 10), none of the respondents would give up going to the stadium or watching the game on televi‑ sion (Figures III‑B and III‑C). In other words, for 100% of the respondents, the minimum level of suspense that would make them give up is less than 10. On the contrary, if there was no uncertainty (value 0 of the level of suspense), only about 30% of the fans would still go to the stadium (figure III‑B).
The appendix provides the same curves (see Figures A2‑III to A2‑V), with a distinction made between “young” and “old” supporters. In relation to the comments made above, younger supporters appear to be less sensitive to outcome uncertainty than their older counterparts: in general, 30 to 40% of those aged 26 and under would continue to take an interest in competitions even if there were no suspense, compared to just 20% of those aged over 26.
Two important results emerge from these figures. The first is, of course, the similarity of the curves for the different types of demand and compe‑ titions. Finally, intentions to stop following
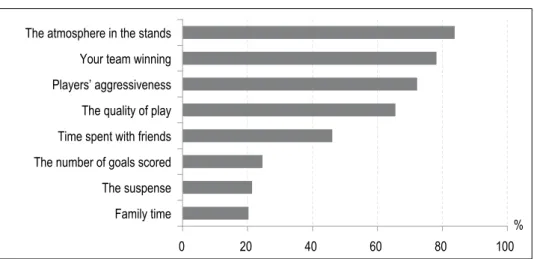
football do not depend on the competition or the method of consumption. The second inter‑ esting finding relates to the absence of any relationship between perceived uncertainty and intention to consume. While the reported level of uncertainty varies widely between Ligue 1 and the Champions League (Figures I and II), the intention to stop following each competi‑ tion shows almost the same profile. This effect is consistent with the literature cited above on professional football, which is inconclusive on the relationship between outcome uncertainty and fan demand. In football, fan demand cannot be reduced to a simple matter of consumer behaviour: fans prefer to see their favourite team win (Buraimo & Simmons, 2008), as is the case in Ligue 1, and to see a top club play even if it is a far superior team (Pawlowski & Anders, 2012), as is the case in the Champions League. This tends to be the spontaneous response of fans who attend games when asked about what they are most sensitive to (Figure IV): the atmosphere (84%), winning (78%) and players’ aggressive‑ ness and fighting spirit (72%) are the factors cited most often, with suspense lagging a long way behind (21%).
Respondents were also asked to comment on seventeen items relating to several types of uncer‑ tainty in Ligue 1 and the Champions League: short‑term uncertainty (ST), medium‑term uncer‑ tainty (MT) and long‑term uncertainty (LT), with four possible answers for each item: “strongly disagree”, “somewhat disagree”, “somewhat agree” and “strongly agree”. Table 2 shows the distribution of responses. Most focus on the two median responses, except for the
Figure IV – At football matches, what are you most sensitive to… (multiple answers possible)
0 20 40 60 80 100
Family time The suspense The number of goals scored Time spent with friends The quality of play Players’ aggressiveness Your team winning The atmosphere in the stands
%
Reading note: 21.4% of fans who attend football matches are sensitive to the “suspense” of the match. Sources: PSE‑L’Équipe, survey Quel supporter êtes‑vous ? ‑ 2016.
following items. In the case of Ligue 1, 45% of respondents “strongly agree” that the fight to stay in Ligue 1 is interesting, while nearly three‑quarters of respondents (72.1%) “strongly disagree” that many different teams win the French Ligue 1. The context here is both PSG’s dominance since 2011 and the fact that three teams were relegated from the French league at the end of every season until the 2015‑2016 campaign.
At the end of the 2016‑2017 season, instead of three Ligue 1 teams being relegated to Ligue 2, the team ranked 18th competed in a play‑off game against the team that finished 3rd in Ligue 2, providing a further opportunity to remain at the highest level and thereby limiting the uncertainty over which teams would remain in the top league. That is why the French Professional Football League (Ligue de football professionnel, or LFP) introduced a system of pre‑play‑off ties in the
Table 2 – Distribution of responses to questions on uncertainty as perceived by fans
Strongly
disagree Somewhat disagree Somewhat agree Strongly agree Missing values Disagree Agree Short Term (ST)
Before a game, there is no way of knowing which team is going to win
Ligue 1 9.8 42.0 39.8 4.9 3.4 51.8 44.7
Champions League 9.8 39.2 38.1 8.9 4.1 49.0 47.0
Teams playing at home have just as much chance of winning as teams playing away from home
Ligue 1 9.7 39.8 40.7 6.2 3.6 49.5 46.9
Champions League 13.8 46.3 29.8 5.6 4.5 60.1 35.4
There are no real favourites in any match
Ligue 1 19.6 49.3 24.9 2.5 3.8 68.9 27.4
Champions League 17.7 51.9 22.0 3.9 4.5 69.6 25.9 Medium Term (MT)
Ligue 1
The battle for Champions League qualifying spots
remains thrilling until the end of the season 5.8 12.1 46.0 32.7 3.4 17.9 78.7
The battle for Europa League qualifying spots
remains thrilling until the end of the season 5.0 13.2 51 27.3 3.5 18.2 78.3
The battle to avoid relegation remains thrilling until
the end of the season 3.7 5.9 41.9 45 3.5 9.6 86.9
Champions League
The race to win the league remains thrilling until
the end of the season 3.7 7.3 38 46.5 4.6 11.0 84.5
The Champions League group stage remains
thrilling 6.8 19.7 49.6 19.7 4.6 26.5 69.3
The Champions League knockout stage remains
thrilling 2.6 4.2 36.5 52.2 4.5 6.8 88.7
Long Term (LT)
Ligue 1
Many different teams win the league 72.1 17.9 3.7 1.7 4.6 90.0 5.4
Many different teams qualify for the Champions
League 33.7 47.3 12.3 2.2 4.5 81.0 14.5
Many different teams qualify for the Europa League 12.0 35.4 42.5 5.9 4.3 47.4 48.4
Many different teams were relegated 7.3 23.1 49.3 16.3 4.0 30.4 65.6
Champions League
Many different teams win the Champions League 16.3 43.3 25.8 10.0 4.7 59.6 35.8
Note: 21,716 observations. ST=short term; MT=medium term; LT=long term.
Reading note: 5.0% of fans strongly disagree with the following statement: “The battle for Europa League qualifying spots remains thrilling until the end of the season”.
2017‑2018 season for clubs finishing 3rd, 4th and 5th in Ligue 2. According to the chosen format, the fifth‑placed team first plays away against the team ranked fourth. The winner of that match then plays away against the third‑placed team. Finally, the winner of that match plays against the team ranked 18th in Ligue 1 in a promotion/ relegation play‑off.3
In the case of the Champions League, around half of the respondents “strongly agree” that the race for the title (46.5%) and the knockout stages (52.2%) remain thrilling. The uncertainty of the Champions League is relatively high since, in the event’s current version, no team between 1992 and 2016 has won the compe‑ tition two years in a row.4 In the group stage, big‑budget teams end up playing against “small” budget teams and have no difficulty qualifying because of the huge difference in wealth. In the subsequent knockout stage when teams go head to head, the effect of differences in wealth tends to decrease, with sporting performance and team qualities regaining the upper hand, as does uncertainty.
4. The Determinants of Perceived
Competitive Balance in Ligue 1
and the Champions League
To test the effect of different uncertainties on perceived competitive balance, a “score” grouping items in their respective uncertainty category was constructed using the responses provided by the respondents: the scores are 1 for “strongly disagree”, 2 for “somewhat disagree”, 3 for “somewhat agree” and 4 for “strongly agree”. The score for no response is 0. In the case of Ligue 1, ST uncertainty consists of the following three items: “Before a match, there is no way of knowing which team is going to win”, “Home teams have as much chance of winning as teams playing away from home” and “There are no real favourites in any match”. The score for ST uncertainty ranges from 0 to 12. A similar approach was used for MT uncertainty, which consists of the following three items: “The fight for Champions League qualifying spots remains thrilling until the end of the season”, “The fight for Europa League qualifying places remains thrilling until the end of the season” and “The fight to stay up remains thrilling until the end of the season”. LT uncertainty consists of the following four items: “Many different teams win the championship”, “Many different teams qualify for the Champions League”, “Many
different teams qualify for the Europa League” and “Many different teams were relegated”. In this case, the LT uncertainty score ranges from 0 to 16. In the case of the Champions League, ST uncertainty is composed of the same three items as Ligue 1. MT uncertainty consists of the following three items: “The race to win the league remains thrilling until the end of the season”, “The group stages of the Champions League remain thrilling” and “The knockout stages of the Champions League remain thrilling”. LT uncertainty consists of just one item: “Many different teams win the Champions League”. The score ranges from 0 to 4. The tradi‑ tional Cronbach’s alpha was used to measure the overall consistency of the aggregated items. The calculated values range from 0.69 in the case of ST uncertainty in Ligue 1 to 0.86 in the case of MT uncertainty in the Champions League. Apart from the first all values are above 0.7. The indicators constructed can therefore be considered to be repre sentative of the different notions of uncertainty. 3 4
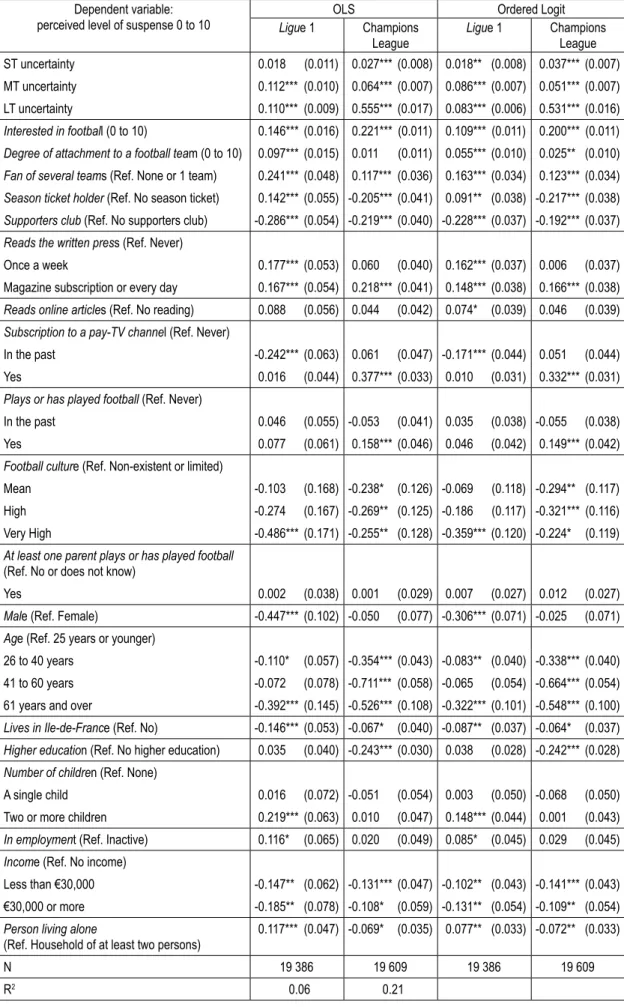
Competitive balance as perceived by fans in Ligue 1 and the Champions League was estimated based on the ST, MT and LT uncertainty indica‑ tors constructed for the purposes of the study, after controlling for individual characteristics. The estimates (Table 3) were obtained using OLS (first two columns) and ordered logit (last two columns). Given the high number of modalities of the dependent variable (between 0 and 10), the results are very close. Before analysing what kind of uncertainty reflects competitive balance as perceived by fans, it is important to examine the individual characteristics influencing perceived suspense (socio‑demographic variables were used for control purposes).
Regardless of the specification, one of the factors determining the value placed on suspense is a significant interest in football in general and in Ligue 1 and the Champions League in particular. All other things being equal, the variables reflecting significant interest are positive and significant (“Interested in football”, “Interested in Ligue 1”, “Interested in the Champions League”, “Fan of several teams”). This means that those interested in competitions are aware that, even if there is a strong imbalance between teams, football is still the most uncertain team sport and the outcome of a match is never certain. In other words, interest in football offsets the
3. The reason for the extra games is so that fans do not lose interest. 4. The only time this has ever happened was in 2017‑2018, the season in which Real Madrid won their third consecutive Champions League.
Table 3 – Variables influencing the perception of competitive balance (CB)
Dependent variable:
perceived level of suspense 0 to 10 Ligue 1 OLS Champions Ordered Logit League Ligue 1 Champions League ST uncertainty 0.018 (0.011) 0.027*** (0.008) 0.018** (0.008) 0.037*** (0.007) MT uncertainty 0.112*** (0.010) 0.064*** (0.007) 0.086*** (0.007) 0.051*** (0.007) LT uncertainty 0.110*** (0.009) 0.555*** (0.017) 0.083*** (0.006) 0.531*** (0.016)
Interested in football (0 to 10) 0.146*** (0.016) 0.221*** (0.011) 0.109*** (0.011) 0.200*** (0.011)
Degree of attachment to a football team (0 to 10) 0.097*** (0.015) 0.011 (0.011) 0.055*** (0.010) 0.025** (0.010) Fan of several teams (Ref. None or 1 team) 0.241*** (0.048) 0.117*** (0.036) 0.163*** (0.034) 0.123*** (0.034)
Season ticket holder (Ref. No season ticket) 0.142*** (0.055) ‑0.205*** (0.041) 0.091** (0.038) ‑0.217*** (0.038)
Supporters club (Ref. No supporters club) ‑0.286*** (0.054) ‑0.219*** (0.040) ‑0.228*** (0.037) ‑0.192*** (0.037)
Reads the written press (Ref. Never)
Once a week 0.177*** (0.053) 0.060 (0.040) 0.162*** (0.037) 0.006 (0.037) Magazine subscription or every day 0.167*** (0.054) 0.218*** (0.041) 0.148*** (0.038) 0.166*** (0.038)
Reads online articles (Ref. No reading) 0.088 (0.056) 0.044 (0.042) 0.074* (0.039) 0.046 (0.039)
Subscription to a pay‑TV channel (Ref. Never)
In the past ‑0.242*** (0.063) 0.061 (0.047) ‑0.171*** (0.044) 0.051 (0.044) Yes 0.016 (0.044) 0.377*** (0.033) 0.010 (0.031) 0.332*** (0.031)
Plays or has played football (Ref. Never)
In the past 0.046 (0.055) ‑0.053 (0.041) 0.035 (0.038) ‑0.055 (0.038) Yes 0.077 (0.061) 0.158*** (0.046) 0.046 (0.042) 0.149*** (0.042)
Football culture (Ref. Non‑existent or limited)
Mean ‑0.103 (0.168) ‑0.238* (0.126) ‑0.069 (0.118) ‑0.294** (0.117) High ‑0.274 (0.167) ‑0.269** (0.125) ‑0.186 (0.117) ‑0.321*** (0.116) Very High ‑0.486*** (0.171) ‑0.255** (0.128) ‑0.359*** (0.120) ‑0.224* (0.119)
At least one parent plays or has played football
(Ref. No or does not know)
Yes 0.002 (0.038) 0.001 (0.029) 0.007 (0.027) 0.012 (0.027)
Male (Ref. Female) ‑0.447*** (0.102) ‑0.050 (0.077) ‑0.306*** (0.071) ‑0.025 (0.071)
Age (Ref. 25 years or younger)
26 to 40 years ‑0.110* (0.057) ‑0.354*** (0.043) ‑0.083** (0.040) ‑0.338*** (0.040) 41 to 60 years ‑0.072 (0.078) ‑0.711*** (0.058) ‑0.065 (0.054) ‑0.664*** (0.054) 61 years and over ‑0.392*** (0.145) ‑0.526*** (0.108) ‑0.322*** (0.101) ‑0.548*** (0.100)
Lives in Ile‑de‑France (Ref. No) ‑0.146*** (0.053) ‑0.067* (0.040) ‑0.087** (0.037) ‑0.064* (0.037)
Higher education (Ref. No higher education) 0.035 (0.040) ‑0.243*** (0.030) 0.038 (0.028) ‑0.242*** (0.028)
Number of children (Ref. None)
A single child 0.016 (0.072) ‑0.051 (0.054) 0.003 (0.050) ‑0.068 (0.050) Two or more children 0.219*** (0.063) 0.010 (0.047) 0.148*** (0.044) 0.001 (0.043)
In employment (Ref. Inactive) 0.116* (0.065) 0.020 (0.049) 0.085* (0.045) 0.029 (0.045)
Income (Ref. No income)
Less than €30,000 ‑0.147** (0.062) ‑0.131*** (0.047) ‑0.102** (0.043) ‑0.141*** (0.043) €30,000 or more ‑0.185** (0.078) ‑0.108* (0.059) ‑0.131** (0.054) ‑0.109** (0.054)
Person living alone
(Ref. Household of at least two persons) 0.117*** (0.047) ‑0.069* (0.035) 0.077** (0.033) ‑0.072** (0.033)
N 19 386 19 609 19 386 19 609
R2 0.06 0.21
perceived drop in uncertainty, even in the event of the strong dominance of one team, as has been the case in Ligue 1 since 2011.
Let us now consider two variables: “Season ticket holder” and “Belonging to a supporters club”. Season ticket holders are people who book a seat at the start of the season for the nineteen home league games – and are often given priority for other games – and who therefore have a strong bond with their club. The coefficients associated with the estimates are positive and significant for Ligue 1 and negative and significant for the Champions League. The season ticket holders who participated in the survey were season ticket holders at French clubs. Being a season ticket holder means having a significant interest in a club and its history and is associated with an effect that offsets perceived uncertainty when estimating the effects on Ligue 1. On the other hand, season ticket holders are more critical of the “big” European teams – and especially the amounts of money involved – and believe that uncertainty is low because the same teams always win. This is both true and false (see above). The variable “Belonging to a supporters club” is negative and significant for both competitions, suggesting that fans know their team has little or no chance of winning.
Supporters who use the media tend to view perceived uncertainty differently. While visiting or not visiting football websites has no effect on the perception of uncertainty, fans who read the press every day or subscribe to a specialist magazine also tend to think that there is a great deal of uncertainty in both Ligue 1 and the Champions League. The results for the vari‑ able “Sports Pay‑TV Subscription” reveal two distinct behaviours. In the case of Ligue 1, some fans feel that there is little uncertainty and have cancelled their subscription (highlighting the negative and significant effect with the “in the past” option) while in the case of the Champions League, some supporters think that uncertainty is high and subscribe to a pay‑TV channel (the positive and significant effect with the “yes” option).
The fact of playing football, whether in the past or at present, and of having a parent who plays or has played football was found to have no influence on the perception of uncertainty in Ligue 1 and the Champions League. By contrast, individuals who claim to have a significant or very significant football culture feel there is less suspense in competitions (Ligue 1 and Champions League).
What kind of uncertainty are fans most sensitive to when asked to gauge the suspense of the two “flagship” competitions, i.e. Ligue 1 and the Champions League? In the case of Ligue 1, their views appear to be determined by MT and LT uncertainty, i.e. uncertainty over the even‑ tual winner and repeat titles: it is therefore not surprising that they view the level of suspense as being relatively low since PSG has dominated the league since 2011. The perceived level of suspense in the Champions League is determined primarily by LT uncertainty over repeat winners: it is true that after the group stages, the uncer‑ tainty of matches involving major European sides remains high.
* * *
The idea that competitive balance increases the utility of fans, and therefore their spending and the revenue of professional clubs, lies at the heart of sports economics in general and of the economics of football in particular. Budzinski & Pawlowski (2017) noted that the notion of competitive balance is often invoked to explain why professional leagues decide to change the rules of competitions or the distribution of broadcasting rights. As the literature shows, the relationship between competitive balance and fan demand is far from obvious. Fans’ perception of the balance of competitions is well determined and relatively consistent, but other factors appear to be more important in terms of football “consumption”, such as attachment to the club, likelihood of winning, playing against a big team, the presence of “stars” on the teamsheet, etc. This paper examined competitive balance as perceived by football fans who responded to the “What kind of fan are you?” survey on the L’Équipe.fr website. However, there are several dimensions of perceived competitive balance that depend on the specific competitions considered: in the case of France’s top‑flight league, perceived competitive balance is mainly explained by medium‑ and long‑term uncertainty (the name of the champion and repeat titles), while in the case of the Champions League it is more a matter of long‑term suspense (succes‑ sive winners). As a result, Ligue 1 tends to be perceived as less uncertain than the Champions League. Lastly, outcome uncertainty is far from being the only factor explaining the demand for football since around 30% of fans report that
BIBLIOGRAPHY
Alavy, K., Gaskell, A., Leach, S. & Szymanski, S. (2010). On the Edge of Your Seat: Demand for Football on
Television and the Uncertainty of Outcome Hypothesis. International Journal of Sport Finance, 5(2), 75–95. https://econpapers.repec.org/RePEc:jsf:intjsf:v:5:y:2010:i:2:p:75‑95
Andreff, W. (2014). French professional football: how much different? In: Goddard, J. & Sloane, P., Handbook
on the Economics of Professional Football, pp. 298–321. Cheltenham, UK: Edward Elgar.
Andreff, W. (2018). Financial and Sporting Performance in French Football Ligue 1: Influence on the Player’
Market. International Journal of Financial Studies, 6(4), 1–17. https://doi.org/10.3390/ijfs6040091
Arrondel, L. & Duhautois, R. (2018). L’argent du football. Paris: Cepremap.
Baidina, K. & Parshakov, P. (2017). Uncertainty of Outcome and Attendance: Evidence from Russian Foot‑
ball. Mimeo.
Benz, M.-A., Brandes, L. & Franck, E. (2009). Do Soccer Associations Really Spend on a Good Thing?
Empirical Evidence on Heterogeneity in the Consumer Response to Match Uncertainty of Outcome.
Contem-porary Economic Policy, 27(2), 216–235. https://dx.doi.org/10.1111/j.1465‑7287.2008.00127.x
Budzinski, O. & Pawlowski, T. (2017). The Behavioral Economics of Competitive Balance: Theories,
Findings, and Implications. International Journal of Sport Finance, 12(2), 109–122.
Buraimo, B. (2008). Stadium attendance and television audience demand in English league football.
Manage-rial and Decision Economics, 29(6), 513–523. https://doi.org/10.1002/mde.1421
Buraimo, B. & Simmons, R. (2008). Do sports fans really value uncertainty of outcome? Evidence from the
English Premier League. International Journal of Sport Finance, 3(3), 146–155.
Buraimo, B. & Simmons, R. (2009). A tale of two audiences: Spectators, television viewers and outcome
uncertainty in Spanish football. Journal of Economics and Business, 61(4), 326–338. https://doi.org/10.1016/j.jeconbus.2008.10.002
Buraimo, B. & Simmons, R. (2015). Uncertainty of outcome or star quality? Television audience demand for
English Premier League football. International Journal of the Economics of Business, 22(3), 449–469. https://doi.org/10.1080/13571516.2015.1010282
Cairns, J. A. (1987). Evaluating changes in league structure: The reorganization of the Scottish Football
League. Applied Economics, 19(2), 259–275. https://doi.org/10.1080/00036848700000101
Caruso, R., Addesa, F. & Di Domizio, M. (2019). The Determinants of the TV Demand of Soccer: Empirical
Evidence On Italian Serie A for The Period 2008‑2015. Journal of Sports Economics, 20(1), 25–49. https://doi.org/10.1177%2F1527002517717298
Czarnitzki, D. & Stadtmann, G. (2002). Uncertainty of outcome versus reputation: Empirical evidence for the
first German football division. Empirical Economics, 27(1), 101–112. https://doi.org/10.1007/s181‑002‑8361‑7
they would always be willing to attend or watch games even in the hypothetical case that there is no suspense left.
Despite its strong growth, mainly due to that of TV rights over the last twenty years (about 10% per year in France) and contrary to popular belief due to its very high popularity, football is still a
rather small business compared to other sectors of activity (Arrondel & Duhautois, 2018): about 0.2% of French GDP. The evolution of the struc‑ ture of the clubs' budgets (more audiovisual rights, less ticketing) shows that research on football demand must now focus on explaining its determinants for both media subscriptions stadium attendance.
Falter, J.-M. & Perignon, C. (2000). Demand for Football and intramatch winning probability: An essay on the
glorious uncertainty of sports. Applied Economics, 32(13), 1757–1765. https://doi.org/10.1080/000368400421101
Falter, J.-M., Pérignon, C. & Vercruysse, O. (2008). Impact of Overwhelming Joy on Consumer Demand:
The Case of a Soccer World Cup Victory. Journal of Sports Economics, 9(1), 20–42. https://doi.org/10.1177%2F1527002506296548
Forrest, D. & Simmons, R. (2002). Outcome uncertainty and attendance demand: The case of English soccer.
Journal of the Royal Statistical Society, Series D (The Statistician), 51(2), 229–241.
https://doi.org/10.1111/1467‑9884.00314
Forrest, D. & Simmons, R. (2006). New Issues in Attendance demand: The Case of the English Football
League. Journal of Sports Economics, 7(3), 247–266. https://doi.org/10.1177%2F1527002504273392
Forrest, D., Beaumont, J., Goddard, J. & Simmons, R. (2005). Home advantage and the debate about
competitive balance in professional sports leagues. Journal of Sports Sciences, 23(4), 439–445. https://doi.org/10.1080/02640410400021641
Forrest, D., Simmons, R. & Buraimo, B. (2005). Outcome Uncertainty and the Couch Potato Audience.
Scottish Journal of Political Economy, 52(4), 641–661. https://dx.doi.org/10.1111/j.1467‑9485.2005.00360.x
Garcıa, J. & Rodrıguez, P. (2002). The determinants of football match attendance revisited: Empirical
evidence from the Spanish Football League. Journal of Sports Economics, 3(1), 18–38. https://doi.org/10.1177%2F152700250200300103
Hart, R. A, Hutton, J. & Sharot, T. (1975). A Statistical Analysis of Association Football Attendances. Journal
of the Royal Statistical Society, Series C Applied Statistics, 24(1), 17–27. https://doi.org/10.2307/2346700
Jang, H. & Lee, Y. H. (2015). Outcome uncertainty, governance structure, and attendance: A study of the
Korean professional football league. In: Lee, Y. H. & Fort, R. (Eds.), The sports business in the Pacific rim, pp. 59–81. New York: Springer.
Jennett, N. (1984). Attendances, Uncertainty of Outcome and Policy in Scottish League Football. Scottish
Journal of Political Economy, 31(2), 176–198. https://doi.org/10.1111/j.1467‑9485.1984.tb00472.x
Kuper, S. & Szymanski, S. (2018). Soccernomics: Why England lose: and other curious phenomena
explai-ned. London: HarperSport.
Neale, W. C. (1964). The Peculiar Economics of Professional Sports: A Contribution to the Theory of the Firm
in Sporting Competition and in Market Competition. Quarterly Journal of Economics, 78(1), 1–14. https://doi.org/10.2307/1880543
Nielsen Sports (2018). World Football Report. https://nielsensports.com/reports/world‑football‑2018/ Pawlowski, T. & Anders, C. (2012). Stadium attendance in German professional football – The (un)impor‑
tance of uncertainty of outcome reconsidered. Applied Economics Letters, 19(16), 1553–1556. https://doi.org/10.1080/13504851.2011.639725
Peel, D. A. & Thomas, D. A. (1988). Outcome uncertainty and the demand for football: An analysis of match
attendances in the English Football League. Scottish Journal of Political Economy, 35(3), 242–249. https://doi.org/10.1111/j.1467‑9485.1988.tb01049.x
Peel, D. A. & Thomas, D. A. (1992). The demand for football: Some evidence on outcome uncertainty. Empirical
Economics, 17(2), 323–331. https://econpapers.repec.org/RePEc:spr:empeco:v:17:y:1992:i:2:p:323‑31
Peel, D. A. & Thomas, D. A. (1996). Attendance demand: An investigation of repeat fixtures. Applied
Econo-mics Letters, 3(6), 391–394. https://doi.org/10.1080/135048596356294
Rottenberg, S. (1956). The baseball players’ labor market. Journal of Political Economy, 64(3), 242–258.
https://doi.org/10.1086/257790
Scelles, N. (2017). Star quality and competitive balance? Television audience demand for English Premier
League football reconsidered. Applied Economics Letters, 24(19), 1399–1402. https://doi.org/10.1080/13504851.2017.1282125
Schreyer, D., Schmidt, S. L. & Torgler, B. (2017). Game outcome uncertainty and the demand for internatio‑
nal football games: Evidence from the German TV market. Journal of Media Economics, 30(1), 31–45. https://econpapers.repec.org/RePEc:taf:jmedec:v:30:y:2017:i:1:p:31‑45
Schreyer, D., Schmidt, S. L. & Torgler, B. (2018). Game Outcome Uncertainty and Television Audience
Demand: New Evidence from German Football. German Economic Review, 19(2), 140–161. https://doi.org/10.1111/geer.12120
Schreyer, D., Schmidt, S. L., Sascha, L. & Torgler, B. (2016). Against all odds? Exploring the role of game
outcome uncertainty in season ticket holders’ stadium attendance demand. Journal of Economic Psychology, 56, 192–217. https://doi.org/10.1016/j.joep.2016.07.006
Simmons, R. (1996). The demand for English league football: A club‑level analysis. Applied Economics, 28(2),
139–155. https://doi.org/10.1080/000368496328777
Statista (2018). European Football Benchmark: France.
Wilson, P. & Sim, B. (1995). The demand for semi‑pro league football in Malaysia 1989–91: A panel data
APPENDIX 1 ___________________________________________________________________________________________ STUDIES ON THE EFFECT OF UNCERTAINTY IN FOOTBALL
Authors (chronological order)
Championship
Seasons studied
Dependent variable
Measure of uncertainty
Ef
fect of uncertainty (main outcome)
Hart, Hutton and Sharot (1975)
4 English teams
1969‑1972
Stadium Attendance
Dif
ference in team rankings
No
Jennett (1984)
Scotland Division 1
1975‑1981
Stadium Attendance
Number of points needed to win the championship
Ye s Cairns (1987) Scotland Division 1 1979‑1980 Stadium Attendance
Ranking of the two teams in the table
Ye s Peel &Thomas (1988) England Divisions 1‑4 1981‑1982 Stadium Attendance
Sports bets (Home team probability of success)
No Peel & Thomas (1992) England Divisions 1‑4 1986‑1987 Stadium Attendance Sports bets No
Wilson & Sim (1995)
Malaysia (League with two divisions)
1989‑1992
Stadium Attendance
Point dif
ference between teams
No
Baimbridge, Cameron & Dawson (1996)
England Division 1
1993‑1994
Stadium Attendance
Dif
ference in team rankings
No Peel &Thomas (1996) Scotland Divisions 1‑3 1991‑1992 Stadium Attendance Sports bets No
Falter & Pérignon (2000)
France Division 1
1997‑1998
Stadium Attendance
Dif
ference in team rankings
Ye
s
Czarnitzki & Stadtmann (2002)
Germany Division 1
1996‑1998
Stadium Attendance
Sports bets
No
Forrest & Simmons (2002)
England Divisions 1‑4
1997‑1998
Stadium Attendance
Sports bets
No
Garcia & Rodriguez (2002)
Spain Division 1
1992‑1996
Stadium Attendance
Dif
ference in team rankings
Yes (the authors do not trust their results)
Forrest, Buraimo & Simmons (2005)
England Division 1
1993‑2002
Television audience
Point dif
ference between teams
Ye
s
Forrest, Beaumont, Goddard & Simmons (2005)
England Division 1 1997‑1998 Stadium Attendance Sports bets Ye s
Forrest & Simmons (2006)
England Divisions 2‑4
1999‑2002
Stadium Attendance
Point dif
ference between teams
No
Johnsen & Solvoll (2007)
Norway and Denmark
1998‑2007
Television audience
Point dif
ference between teams
No
Buraimo & Simmons (2008)
England Division 1 2000‑2006 Stadium Attendance Sports bets No Buraimo (2008) England Division 1 1997‑2004
Stadium Attendance/ Television audience
Point dif
ference between teams
No Falter , Pérignon & V ercryusse (2008) France Division 1 1996‑2000 Stadium Attendance Point dif
ference between teams
No
Benz, Brandes & Franck (2009)
Germany Division 1
1999‑2004
Stadium Attendance
Dif
ference in team rankings / Point dif
ference
between teams / Sports bets
No (only for teams with high attendance figures)
Buraimo & Simmons (2009)
Spain Division 1
2003‑2007
Stadium Attendance/ Television audience
Sports bets
No (attendance) /
Authors (chronological order) Championship Seasons studied Dependent variable Measure of uncertainty Ef
fect of uncertainty (main outcome)
Madalozzo & Berber V
illar (2009)
Brazil Division 1
2003‑2006
Stadium Attendance
Dif
ference in team rankings
No
Alavy
, Gaskell, Leach & Szymanski (2010)
England 2002‑2006 Television audience Sports bets Ye s Pawlowski & Anders (2012) Germany Division 1 2005‑2006 Stadium Attendance Sports bets No Pawlowski (2013)
Germany Division 1 (6 matches)
Sept‑Oct 201
1
Intention to consume (stadium and bar surveys)
Questions on dif
ferent measures of uncertainty
Ye
s
Jang & Lee (2015)
South Korea K‑League (closed league)
1987‑201
1
Stadium Attendance
Win rate and average points before the game
Ye
s
Cox (2015)
England Division 1
2004‑2012
Stadium Attendance/ Television audience
Sports bets
No (attendance) /
Yes (Audience).
Buraimo & Simmons (2015)
England Division 1 2001‑2008 Television audience Sports bets No Schreyer , Schmidt & Torgler (2018) Germany Division 1 2012‑2013
Season ticket holders attendance
Sports bets
Yes (season ticket holders arrive earlier at the stadium when uncertainty increases)
Schreyer
, Schmidt &
Torgler (2018)
Germany Division 1 and Cup
201 1‑2015 Television audience Sports bets Yes (Championship) / No ef fect (Cup) Schreyer , Schmidt & Torgler (2017) W orld Cups
and European championships (Euro), German
National T
eam
6 W
orld Cups,
5 European championships and exhibition matches
Television audience
Dif
ference in FIF
A Ranking
Yes on high‑stakes matches
Scelles (2017) England Division 1 2013‑2014 Television audience Sports bets No Caruso,
Addesa & Di Domizio (2019)
Italy Division 1
2008‑2015
Television audience
Dif
ference in League
Table Ranking / Dif
ference
in points between teams /Sports bets
No
Baidina & Parshakov (2017)
Russia Division 1
2012‑2014
Stadium Attendance
Sports bets
APPENDIX 2 ___________________________________________________________________________________________
Figure A2‑I – Perceived competitive balance in Ligue 1 and the Champions League
0 5 10 15 20 25 0 1 2 3 4 5 6 7 8 9 10
Under 26 years of age 26 years and over 0 5 10 15 20 25 30 0 1 2 3 4 5 6 7 8 9 10
Ligue 1 Champions League
% %
Notes: 0 = “no suspense” / 10 = “a lot of suspense”.
Sources: PSE‑L’Équipe, survey Quel supporter êtes‑vous ? ‑ 2016.
Table A2‑1– Ligue 1 2015‑2016 season
Club Points 1 Paris Saint‑Germain 96 2 Olympique lyonnais 65 3 AS Monaco 65 4 OGC Nice 63 5 Lille OSC 60 6 AS Saint‑Etienne 58 7 SM Caen 54 8 Stade rennais FC 52 9 Angers SCO 50 10 SC Bastia 50 11 Girondins de Bordeaux 50 12 Montpellier HSC 49 13 Olympique de Marseille 48 14 FC Nantes 48 15 FC Lorient 46 16 EA Guingamp 44 17 Toulouse FC 40 18 Stade de Reims 39 19 GFC Ajaccio 37 20 ES Troyes AC 18 Sources: LFP.
Figure A2‑II – Perceived competitive balance in Ligue 1 according to the team supported 0 5 10 15 20 25 0 1 2 3 4 5 6 7 8 9 10
PSG Europeans Middle of the table Relegation zone %
Notes: 0 = “no suspense” / 10 = “a lot of suspense”.
Sources: PSE‑L’Équipe, survey Quel supporter êtes‑vous ? ‑ 2016.
Figure A2‑III – Intention not to stop following Ligue 1 or the Champions League altogether
0 10 20 30 40 50 60 70 80 90 100 10 9 8 7 6 5 4 3 2 1 0
Ligue 1 Champions League 0 10 20 30 40 50 60 70 80 90 100 10 9 8 7 6 5 4 3 2 1 0 Under 26 years of age 26 years and over
% %
Notes: 0 = “no suspense” / 10 = “a lot of suspense”.
Figure A2‑IV – Intention not to stop attending matches in Ligue 1 or the Champions League 0 10 20 30 40 50 60 70 80 90 100 10 9 8 7 6 5 4 3 2 1 0
Ligue 1 Champions League 0 10 20 30 40 50 60 70 80 90 100 10 9 8 7 6 5 4 3 2 1 0 26 years and over
Under 26 years of age
% %
Notes: 0 = “no suspense” / 10 = “a lot of suspense”.
Sources: PSE‑L’Équipe, survey Quel supporter êtes‑vous ? ‑ 2016.
Figure A2‑V – Intention not to stop watching a Ligue 1 or Champions League match on television
0 10 20 30 40 50 60 70 80 90 100 10 9 8 7 6 5 4 3 2 1 0
Ligue 1 Champions League 0 10 20 30 40 50 60 70 80 90 100 10 9 8 7 6 5 4 3 2 1 0 Under 26 years of age 26 years and over
% %
Notes: 0 = “no suspense” / 10 = “a lot of suspense”.