HAL Id: hal-01249349
https://hal.archives-ouvertes.fr/hal-01249349
Submitted on 4 Jan 2016
HAL is a multi-disciplinary open access
archive for the deposit and dissemination of
sci-entific research documents, whether they are
pub-lished or not. The documents may come from
teaching and research institutions in France or
abroad, or from public or private research centers.
L’archive ouverte pluridisciplinaire HAL, est
destinée au dépôt et à la diffusion de documents
scientifiques de niveau recherche, publiés ou non,
émanant des établissements d’enseignement et de
recherche français ou étrangers, des laboratoires
publics ou privés.
Modesto Lopez-Lopez, Laura Rodriguez-Arco, Pavel Kuzhir, Juan D.G.
Durán, Andrey Zubarev, Georges Bossis
To cite this version:
Modesto Lopez-Lopez, Laura Rodriguez-Arco, Pavel Kuzhir, Juan D.G. Durán, Andrey Zubarev, et
al.. Stick-slip instabilites in magnetorheological fluids. Francisco Chinesta, Gilles Ausias. Rheology
of Non-Spherical Particle Suspensions , ISTE Press, 2015, 978-1-78548-036-2. �hal-01249349�
Chapter N
Stick-slip instabilites in magnetorheological
fluids
In this work we review our recent experimental and theoretical results on the flow instabilities observed in magnetorheological (MR) fluids subjected to applied magnetic fields. We study three types of MR fluids, consisting of suspensions of respectively silica-coated iron particles, carbonyl iron particles and CoNi fibers dispersed in a liquid carrier, and subjected to two types of flow, shear flow between parallel plates and pressure-driven flow through a capillary. In all cases we found that the flow curves showed a decreasing branch corresponding to a region of negative differential viscosity, for which a stable steady-state flow was impossible. We found different physical reasons for the observed instabilities. For shear flow between parallel plates of highly concentrated suspensions of spherical iron particles, fracture of the magnetic field-induced particle structures in combination with shear localization were on the basis of the observed instabilities. Periodic formation and fracture of the particle structures due to the magnetic field gradient and the hydrodynamic drag forces respectively was responsible for instabilities in the case of pressure-driven flow through a capillary of suspensions of spherical iron particles. In the case of suspensions of CoNi fibers, interparticle friction forces were in the origin of the obtained negative differential viscosity, as a consequence of hindering fiber reorientation inside the aggregates as they were deviated by shear forces from the direction of the applied field. In addition to the interest of this work from a fundamental point of view, its practical relevance stands on the importance of
Chapter written by Modesto T LOPEZ-LOPEZ, Laura RODRIGUEZ-ARCO, Pavel KUZHIR, Juan DG DURAN, Andrey ZUBAREV and Georges BOSSIS
a detailed knowledge of the conditions that give rise to instabilities in order to rule them out and avoid malfunction of technological devices based on the MR effect.
N.1. Introduction
Magnetorheological (MR) fluids are suspensions of particles of magnetizable materials. These suspensions are characterized by the tunability of their rheological properties by means of magnetic field application, a phenomenon known as the MR effect [BOS 02]. Changes provoked in MR fluids by application of magnetic fields are so intense that their mechanical behavior usually shifts from this of a Newtonian liquid in the absence of field, to this of a plastic material in the presence of field [BOS 02]. Plastic materials are characterized by a minimum value of stress that must be applied in order to initiate their flow, known as the yield stress. In the case of MR fluids the magnitudes of both the yield stress and the viscosity increase when the intensity of the magnetic field is increased. The MR effect has its microscopic origin in the formation of ellipsoidal or columnar particle structures, as a consequence of the magnetic field-induced particle polarization and the subsequent magnetostatic attraction between particles. As a matter of fact, upon magnetic field application MR fluids are suspensions of breakable and reconstructible columnar-like aggregates that show a privileged direction for their orientation –to be precise, columnar-like aggregates tend to orientate and grow in the direction of the applied field and could be destructed by other forces, such as hydrodynamic ones. This gives rise to a rich rheological phenomenology that has been intensively studied in the last few decades. Furthermore, the MR effect is the base of many applications of MR fluids in engineering and biomedicine [PAR 10].
As mentioned above, due to its fundamental and practical interest, rheology of MR fluids has been an active field of research. Main attention has been paid to the change of the characteristic rheological properties (yield stress, viscosity and viscoelastic moduli) with the intensity of the applied magnetic field; i.e., to the MR effect. The aim has usually been the experimental characterization of new MR fluids and the understanding from the viewpoint of the particle interactions of the physical origins and strength of the observed MR effect. On the other hand, very little attention had been paid to the behavior of these smart fluids in the vicinity of the yield point until very recently.
However, the behavior of other (i.e., non-magnetic) yield stress fluids in the vicinity of the yield point has attracted much attention in the last few decades. The main reason is that a stable steady-state flow is impossible for yield fluids at small enough values of the rate of flow, a phenomenon broadly studied for the shear flow of non-magnetic suspensions both in drag flow (e.g., flow between parallel plates) [BEC 06; BON 02; COU 02; DAC 02; HUA 05; JAR 05; OVA 06; RAG 07; ROD
Flow instabilites in magnetorheological fluids 3
05; VAR 03] and pressure-driven (e.g., capillary) flow of complex fluids [VIN 66; KAL 87; HAT 92; GEO 94; DEN 01; GEO 03; TAN 08] and non-magnetic suspensions [BRI 99; COU 02; ISA 07; OVA 09; SCH 10]. In most of the cases, the instabilities in the vicinity of the yield point are evidenced by a decrease of the stress or the pressure difference as the flow rate increases in shear rate flows or pressure-driven flows, respectively [QUE 82; YER 70]. A differential negative viscosity is associated to this decreasing part of the flow curves, which induces transfer of momentum from the slower parts of the fluid or suspension to the faster parts [GOD 03]. This results in the breakage of the velocity profiles within the flowing system and the appearance of intermittent oscillations of the shear stress or the pressure difference [WUN 01; BAN 01; PIC 02; GOD 03; BAS 10].
Contrary to the case of non-magnetic complex fluids and suspensions, flow instabilities have only been scarcely studied for MR fluids. Only very recently (last couple of years), a few authors have started to study such phenomena for MR fluids [JIA 12; LOP 13; ROD 13; ZUB 13]. In this book chapter, we review our recent advances in this emerging subfield of magnetorheology. We present results for three different MR fluids and two types of flow: shear flow between parallel plates and pressure-driven flow.
N.2. Materials and methods N.2.1. Materials
As mentioned above, MR fluids are suspensions of magnetic particles in a liquid carrier. In this work, as magnetic particles we used iron CC powder (supplied by BASF, Germany), carbonyl iron powder (CIP, AnalaR Normapur; Prolabo®; VWR International) and CoNi powder (synthesized in our laboratory, non-commercial). Iron CC powder consisted of spherical microparticles of carbonyl iron coated by a layer of silica.
Iron CC (Fe-CC) powder consisted of silica-coated iron particles (Fe-CC, density 7.2 g/cm3) of spherical shape, median diameter d50 = 5 µm and CIP consisted of pure carbonyl iron particles (density 7.5 g/cm3) of spherical shape and mean diameter d = 3 µm. Finally, CoNi powder used in our work consisted of fiberlike particles (mean length and width of 56 nm and 6.6 nm, respectively) of CoNi alloy synthesized by the polyol method as described in [GOM 09]. All these three powders exhibited a soft ferromagnetic character, with approximate saturation magnetization of 1360 kA/m, 1700 kA/m and 626 kA/m for Fe-CC, CIP and CoNi particles, respectively.
Aluminum stearate (Sigma Aldrich) and L-α-Phosphatidylcholine (Sigma-Aldrich, BioChemika) were used as surfactants. Mineral oil (Fluka) of 39.6 mPa·s of dynamic viscosity at 25 ºC, and silicon oil (RhodorsilVR; VWR International) of 485 mPa·s of dynamic viscosity at 25 ºC were used as liquid carriers for the preparation of the MR fluids.
N.2.2. Preparation of the MR fluids
We prepared three different types of MR fluids: (i) suspension of Fe-CC powder in mineral oil (MR fluid 1); (ii) suspension of CIP in silicone oil (MR fluid 2); and (iii) suspension of filament-like CoNi particles in mineral oil (MR fluid 3). Preparation of these fluids was as it follows.
MR fluid 1 consisted of a suspension of silica-coated iron spheres in mineral oil. The silica coating of the particles eases the dispersion in mineral oil and because of this reason we did not use any surfactant in this case. The suspension was prepared following the protocol described in [LOP 12a], in order to assure a high concentration (close to the maximum packing-fraction) of particles in the final suspension. Briefly, we added, stepwise, small amounts of Fe-CC powder to a relatively large amount of mineral oil (approx.. 50 mL), homogenizing the resulting mixture by mechanical stirring at each step, until the concentration of powder was so high that it was impossible to homogenize the mixture. At this point, we added approx. 1 mL of mineral oil and the homogenization of the mixture was possible by mechanical stirring. The volume concentration of the final suspension was approx. 50 vol.%, as obtained by density measurements (Table 1).
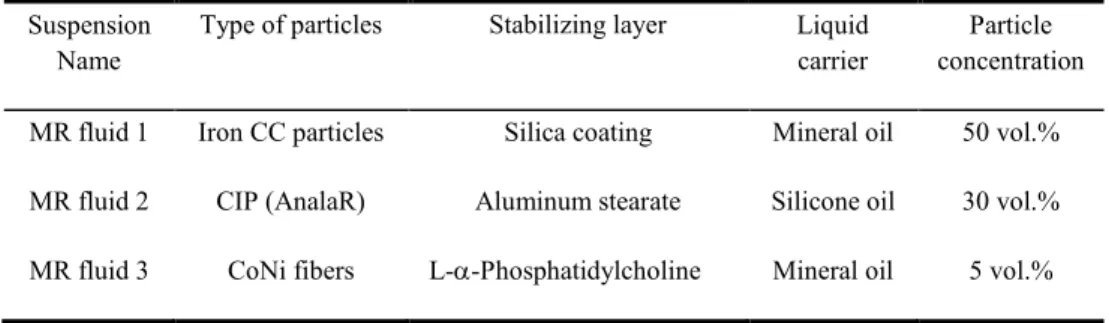
Table N.1. Summary of the different types of suspensions
Suspension Name
Type of particles Stabilizing layer Liquid carrier
Particle concentration MR fluid 1 Iron CC particles Silica coating Mineral oil 50 vol.% MR fluid 2 CIP (AnalaR) Aluminum stearate Silicone oil 30 vol.% MR fluid 3 CoNi fibers L-α-Phosphatidylcholine Mineral oil 5 vol.%
MR fluid 2 consisted of CIP dispersed in silicone oil at volume fractions of 30 vol.% and stabilized against particle agglomeration by the addition of aluminum stearate (Table 1) following the protocol described in [LOP 06]. Briefly, a solution
Flow instabilites in magnetorheological fluids 5
of aluminum stearate in silicone oil was prepared and then proper amounts of CIP were added to this solution. Afterwards, the resulting mixture was homogenized by mechanical stirring and sonication, and finally left for 24 h at 25 ºC under stirring to allow the adsorption of the stearate on the iron particle surface.
Finally, MR fluid 3 consisted of CoNi fibers dispersed in mineral oil at a concentration of 5 vol.% and stabilized against irreversible particle agglomeration by the addition of L-α-Phosphatidylcholine (Table 1), in a similar way to this previously described for MR fluid 2. Details about the preparation protocol can be found in [GOM 09].
N.2.3. Rheological measurements
As mentioned above, two types of flow, shear flow between parallel plates and pressure-driven flow through as capillary, were investigated. MR fluid 1 and MR fluid 3 were used in experiments of the shear flow between parallel plates, whereas MR fluid 2 was employed in pressure-driven flow experiments.
N.2.3.1. Shear flow between parallel plates
Experiments of shear flow between parallel plates were carried out at 25 ºC using a controlled-stress magnetorheometer (MCR300, Physica-Anton Paar, Austria). The measuring system geometry was a 20 mm diameter parallel-plate set for a gap width of 0.35 mm. In order to prevent wall slip, it can be enough to use surfaces with roughness of a size higher than particle size [BAR 95]. Accordingly, in the case of MR fluid 3, the commercial parallel plates supplied with the magnetorheometer MCR300 were used, since particle size was of the order of the tens of nanometers in this case, which was smaller than the roughness of smooth surfaces. On the other hand, in the case of MR fluid 1, particle size was of the order of microns and, consequently, we used a pair of homemade parallel disks with roughened surfaces [LOP 12a]. Measurements were performed upon application of a magnetic field, which was applied by means of the commercial solenoid of the magnetorheometer MCR300 in the case of MR fluid 3, and by means of a homemade solenoid placed coaxially with the axis of the parallel disks in the case of MR fluid 1. The fields generated by these solenoids were reasonably homogeneous, especially in the case of the homemade one. Precise details about the distribution of field within the measuring system in the case of the commercial solenoid supplied with the magnetorheometer MCR300 can be found in [LOP 10].
In the case of MR fluid 1, we used a carefully studied protocol in order to ensure reproducibility of the results, since due to the high concentration of this suspension, it was very sensitive to its previous history. To be precise, we proceeded as it follows. First, we stirred vigorously the suspension by using a vortex mixer immediately before placing it in the measuring system. Subsequently, we subjected
the sample to a shear rate ramp in the range 0.1 – 100 s-1, with a total duration of 60 s. After this pre-shear step, we applied a magnetic field of a given intensity and left the sample at rest for 30 s, prior to the measurement under the same applied field. The measurement consisted of the application of a constant shear rate (within the range 0.01 – 200 s-1) for a typical time that exceeded 20 minutes, and the simultaneous monitoring of the corresponding shear stress. Afterwards we repeated the whole protocol (starting at the pre-shear) for a different value of the constant shear rate. Note that we maintained each value of the constant shear rate for such a long time in order to better analyze the instabilities, as it will be discussed below.
In the case of MR fluid 3, the following protocol ensured the same mechanical history. First, we stirred vigorously the suspension by using a vortex mixer immediately before placing it in the measuring system. Then, we pre-sheared the samples for 30 s at 100 s-1. Subsequently, we applied a magnetic field of a given intensity and left the sample at rest for 30 s, prior to the measurement under the same applied field, which in this case consisted of the application of a constant shear rate (within the range 0.1 – 500 s-1). Simultaneously the corresponding shear stress was monitored. In this case we maintained each constant value of the shear rate for 10 s. Note that for each value of the imposed rate, we took the time average of the shear stress as the representative corresponding value.
N.2.3.2. Pressure-driven flow
We performed pressure-driven flow experiments using a speed-control capillary rheometer Rosand RH7 (Malvern Instruments) at 25 ºC (see sketch in Figure N.1). For this purpose, the MR fluid was pushed at a constant speed through an aluminum capillary of 1.20 ± 0.05 mm of internal diameter and a surface with a root-mean-square roughness of approx. 10 µm. This roughness size is larger than the diameter of the particles of MR fluid 2 and, as discussed above, this condition should be enough to prevent from wall slip. We applied the magnetic field with the help of an electromagnet whose tapered pole pieces were placed at the middle length of the capillary, with its axis at equal distance from both poles. The magnetic field did not show any significant radial gradient along the capillary, although it changed strongly along its length, as checked by direct measurements with a Hall gaussmeter (Caylar GM-H103) and by finite element method simulations using FEMM software [MEK 09]. We found that the field distribution along the length of the capillary, H
0
( )
z ,was described by the following expression:
( )
(
max)
0 1 2 / m H H z z Lα
= + [N.1]In this expression z is the distance from the centerline of the magnetic poles along the length of the capillary,
field, and α=25.4±0.5 and
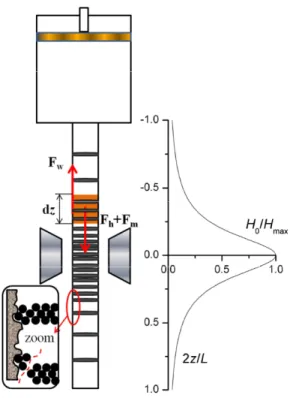
Figure N.1. Sketch of the experimental setup used in pressure
An external magnetic field is generated between two tapered pole pieces of an electromagnet. The magnetic field distribution along the z
figure. According to the observations, the field creates particle aggregates spanning the capillary diameter. A rupture of the aggregates from the rough wall is sho
on the left bottom part of the figure: The whole aggregate is ruptured from the particles entrapped into the wall rugosities; the force on the wall, F
force acting on the aggregates
Pressure-driven flows are dramatically influenced by the presence of gas bubbles, which affect greatly the compressibility of the fluid under study. Consequently, we followed a careful protocol to avoid gas bubbles in the MR fluid. To be precise, we procee
minutes by using an Alcatel Annecy Ty 2002 vacuum pump.
the rheometer barrel under vacuum with the MR fluid, using for this
Flow instabilites in magnetorheological fluids
In this expression z is the distance from the centerline of the magnetic poles along the length of the capillary, Hmax is the maximum intensity of the applied magnetic
0.5 and m=2.0±0.1 are fitting parameters.
Sketch of the experimental setup used in pressure-driven flow experiments. An external magnetic field is generated between two tapered pole pieces of an electromagnet. magnetic field distribution along the z-axis of the capillary is shown on the right of the figure. According to the observations, the field creates particle aggregates spanning the
diameter. A rupture of the aggregates from the rough wall is shown schematically on the left bottom part of the figure: The whole aggregate is ruptured from the particles entrapped into the wall rugosities; the force on the wall, Fw, is transmitted by the shearing
force acting on the aggregates. Reprinted with permission from [ROD 13]. Copyright The Society of Rheology
driven flows are dramatically influenced by the presence of gas bubbles, which affect greatly the compressibility of the fluid under study. Consequently, we followed a careful protocol to avoid gas bubbles in the MR fluid. To be precise, we proceeded as it follows. First, we degasified MR fluid 2 for 30 minutes by using an Alcatel Annecy Ty 2002 vacuum pump. Subsequently, we filled the rheometer barrel under vacuum with the MR fluid, using for this purpose
instabilites in magnetorheological fluids 7
In this expression z is the distance from the centerline of the magnetic poles along is the maximum intensity of the applied magnetic
driven flow experiments. An external magnetic field is generated between two tapered pole pieces of an electromagnet. is shown on the right of the figure. According to the observations, the field creates particle aggregates spanning the
wn schematically on the left bottom part of the figure: The whole aggregate is ruptured from the particles
, is transmitted by the shearing Copyright (2013),
driven flows are dramatically influenced by the presence of gas bubbles, which affect greatly the compressibility of the fluid under study. Consequently, we followed a careful protocol to avoid gas bubbles in the MR fluid. MR fluid 2 for 30 , we filled purpose the
same vacuum pump at an absolute pressure of about 10-3 mbar. Then, the MR fluid was pushed by a piston through the capillary at a constant speed in the absence of applied magnetic field for a few minutes (a time large enough to achieve a steady flow). Immediately afterwards, a magnetic field of a given intensity was applied and the pressure difference, ∆P, between the inlet and outlet of the capillary was monitored as a function of time by means of a pressure transducer (Bohlin Instruments RH9-200-101S; 0–250 Psi range). We repeated the same procedure for different values of the imposed speed of the piston uS =4Qpiston/πD2 (with D being the capillary diameter), corresponding to flow rates Qpiston in the range 0.02 –
20 mm3/s and wall shear rates in the capillary,
γ
ɺ
w, in the range 0.1 – 100 s
-1
. We maintained each value of the imposed speed for a time that varied between 15 and 60 minutes in order to well study the flow instabilities. Between two successive measurements at two different values of the imposed speed, the MR fluid was left at rest for 15 minutes.
Note, finally, that for each value of the imposed speed, we took the time average of the pressure difference as the representative value.
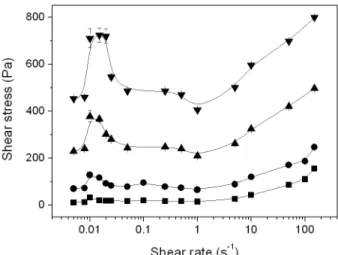
Figure N.2.Shear stress as a function of shear rate for MR fluid 1, consisting of 50 vol.% of iron particles dispersed in mineral oil. The symbols correspond to the experimental data; the continuous lines are eye guidelines. Applied magnetic field strength: : 0 kA/m; :
Flow instabilites in magnetorheological fluids 9
N.3. Experimental results N.3.1. Flow curves
N.3.1.1. Suspension of silica-coated iron particles in mineral oil (MR fluid 1) MR fluid 1, consisting of 50 vol.% of Fe-CC particles in mineral oil, was studied by measurement of its shear flow between parallel plates, following the protocol described in section N.2.3.1. From the rheological measurements we obtained the values of the shear stress as a function of the shear rate for several values of the applied magnetic field (Figure N.2).
As observed, the rheograms (curves of shear stress vs. shear rate) present an N-like shape, characterized by an initial increase of the shear stress with the shear rate, followed by a decrease of the shear stress as the shear rate is further increased, and a final, rather strong, increase of the shear stress for values of the shear rate higher than 10 s-1. In addition, the flow curve minimum becomes much deeper as the magnitude of the applied field is increased, which suggests that the phenomenon is governed principally by the magnetic interactions. Note that a similar shear stress-shear rate behavior was reported for laponite suspensions [PIG 96].
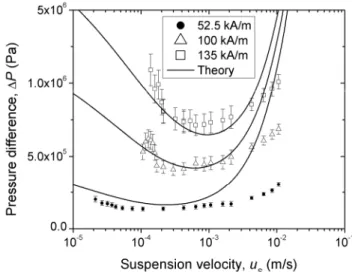
Figure N.3.Pressure difference vs. suspension velocity in the capillary, for MR fluid 2, consisting of 30 vol.% of carbonyl iron particles dispersed in silicone oil, upon application of
different inhomogeneous magnetic field (see field profile in Figure N.1). Reprinted with permission from [ROD 13]. Copyright (2013), The Society of Rheology
N.3.1.2. Suspension of carbonyl iron particles in silicone oil (MR fluid 2)
MR fluid 2, consisting of 30 vol.% of carbonyl iron particles dispersed in silicone oil, was studied under pressure-driven flow through a capillary, as described above (see section N.2.3.2). From these experiments we obtained the pressure difference as a function of the speed at which the MR fluid was pushed through the capillary. We obtained the corresponding flow curves (pressure difference vs. suspension velocity) for different values of the applied magnetic field (Figure N.3).
The flow curves shown in Figure N.3 present a very similar shape to this observed above for MR fluid 1 under shear flow between parallel plates. Again, it is noticeable the fact that there is a part of the curves where the pressure difference decreases as the suspension velocity (i.e., related to the flow rate) increases. In addition, similarly to the case of MR fluid 1, the minimum in the flow curves becomes relatively deeper, the higher the applied magnetic field strength.
N.3.1.3. Suspension of CoNi fibers in mineral oil (MR fluid 3)
MR fluid 3, consisting of 5 vol.% of CoNi fibers in mineral oil, was studied under shear flow between parallel plates, following the protocol described in section N.2.3.1. From these experiments we obtained the values of the shear stress as a function of the shear rate upon application of magnetic fields of different intensity (Figure N.4).
Figure N.4.Shear stress (σ) plotted as a function of shear rate (dγ/dt) for MR fluid 3, consisting of 5 vol.% of CoNi fibers dispersed in mineral oil. The intensity of the mean magnetic field inside the sample (Hint) is givenin the figure legend. Adapted with permission
Flow instabilites in magnetorheological fluids 11
Similarly to the case of MR fluid 1, the flow curves present an N-like shape, characterized by a region of shear rates for which the shear stress diminishes as the shear rate is increased, presenting a minimum of shear stress at medium shear rate.
N.3.2. Stick-slip instabilities
All flow curves shown in Figures N.2 – N.4 present a region in which the shear stress or pressure difference decreases as the rate of flow is increased. These regions are commonly known as regions of negative differential viscosity and, it is well known that a stable steady-state flow is impossible within these regions. In this section we present results that confirm this statement for both, shear flow between parallel plates and pressure-driven flow experiments.
Figure N.5.Examples of the time dependence of the shear stress of MR fluid 1 at a constant shear rate, γɺ, developed by highly concentrated MR suspensions upon application
of a magnetic field, H0. (a) γɺ=0.01 s-1; (b) same as (a) but with enlarged time scale; (c) γɺ
=0.015 s-1; (d) γɺ=1 s-1. The four curves in each graph correspond to the applied magnetic
fields increasing progressively from the lower to the upper curve and taking the following values: 0; 9; 18 and 26.5 kA/m. Reprinted with permission from [LOP 13]. Copyright (2013),
N.3.2.1. Oscillations of the shear stress at constant shear rate in shear flow between
parallel plates
As mentioned above, in the case of MR fluid 1 we maintained each value of the shear rate for a time that exceeded 20 minutes and monitored the corresponding shear stress. Depending on the values of the shear rate and the applied magnetic field we obtained different trends of the shear stress as a function of time (Figure N.5).
Figure N.6.Period and amplitude of oscillations of MR fluid 1 plotted as a function of the applied field strength for a shear rate of 0.01 s-1. Reprinted with permission from [LOP
13]. Copyright (2013), The Society of Rheology
For values of the applied shear rate corresponding to the region of negative differential viscosity, the shear stress oscillated with time, with regular amplitude and period (see Figure N.5b). Note that in agreement with results of the flow curves (Figure N.2), which do not show any appreciable region of negative differential viscosity in the absence of applied field, no oscillations of the shear stress are observed in the absence of applied magnetic field. The oscillations neither appeared for applied shear rates corresponding to the final increasing branch of the shear stress vs. shear rate curves. Note that the stress oscillations present a saw-tooth-like shape that resembles this of dry stick-slip motion - a slow quasilinear increase (stick), followed by a drastic release of the shear stress (slip). Jiang and co-workers obtained similar stick-slip instabilities in shear-thickening MR suspensions, which they explained by periodic transitions between boundary and hydrodynamic lubrication [JIA 12] –note that the shear thickening phenomenon was latter studied in details by the same research group [TIA 10; TIA 11]. Concerning the dependence on the applied field and the shear rate, we observe that the period and amplitude of
the stress oscillations increase as the magnetic field is increased and the shear rate is decreased within the region of negativ
is the increase of the amplitude and period of the oscillations with the applied magnetic field strength (Figure N.6), because it makes evident (together with the absence of oscillations at zero field) the
instabilities in the flow of MR fluids. Note also that as the period of the oscillations decreases, the larger the stick time becomes comparable in magnitude to the shorter slip time. On the other hand, for value
negative differential viscosity, the regular stick
Figure N.5d as an example). In this case we only observe some small oscillations, associated to the instrumental error [LOP 13].
Figure N.7. Temporal evolution of the pressure difference magnetic field Hmax=122 kA/m and for imposed speeds, u
8·10-4 m/s (c). A pressure signal recorded for a five hour experiment at H uS=3.1·10-5 m/s is shown in figure (d). The initial plateau with
corresponds to the flow in the absence of magnetic field, and a sharp increase of the pressure difference at the end of this plateau corresponds to t
The insets correspond to a reduced time scale.
Flow instabilites in magnetorheological fluids
the stress oscillations increase as the magnetic field is increased and the shear rate is decreased within the region of negative differential viscosity. Particularly noticeable is the increase of the amplitude and period of the oscillations with the applied magnetic field strength (Figure N.6), because it makes evident (together with the absence of oscillations at zero field) the dominant role of the applied field in these instabilities in the flow of MR fluids. Note also that as the period of the oscillations decreases, the larger the stick time becomes comparable in magnitude to the shorter slip time. On the other hand, for values of the shear rate outside the region of negative differential viscosity, the regular stick-slip instabilities disappear (see Figure N.5d as an example). In this case we only observe some small oscillations, associated to the instrumental error [LOP 13].
Temporal evolution of the pressure difference in MR fluid 2 for the applied =122 kA/m and for imposed speeds, uS,=10-4 m/s (a), 1.5·10-4 m/s (b) and
m/s (c). A pressure signal recorded for a five hour experiment at Hmax=52.5 kA/m and
m/s is shown in figure (d). The initial plateau with ∆P ≈ 0 in figs. (a) corresponds to the flow in the absence of magnetic field, and a sharp increase of the pressure
difference at the end of this plateau corresponds to the moment when the field is switched on The insets correspond to a reduced time scale. Reprinted with permission from [ROD
Copyright (2013), The Society of Rheology
instabilites in magnetorheological fluids 13
the stress oscillations increase as the magnetic field is increased and the shear rate is e differential viscosity. Particularly noticeable is the increase of the amplitude and period of the oscillations with the applied magnetic field strength (Figure N.6), because it makes evident (together with the dominant role of the applied field in these instabilities in the flow of MR fluids. Note also that as the period of the oscillations decreases, the larger the stick time becomes comparable in magnitude to the shorter s of the shear rate outside the region of slip instabilities disappear (see Figure N.5d as an example). In this case we only observe some small oscillations,
for the applied m/s (b) and =52.5 kA/m and ≈ 0 in figs. (a)-(c) corresponds to the flow in the absence of magnetic field, and a sharp increase of the pressure
he moment when the field is switched on. ROD 13].
N.3.2.2. Oscillations of the pressure difference at constant speed in pressure-driven
flow in a capillary
In pressure-driven experiments with MR fluid 2, each value of the imposed speed was maintained during at least 20 minutes, as mentioned above. Similarly to the case of the shear flow between parallel plates discussed in the previous paragraph, we obtained different trends depending on the values of the imposed speed and magnetic field (Figure N.7).
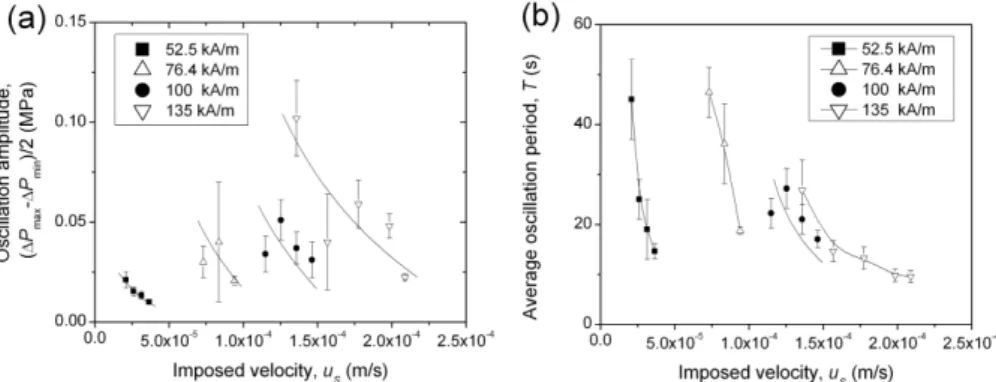
As observed, oscillations of the pressure difference as a function of time are obtained whenever the speed is imposed within the region of decreasing pressure as a function of speed (equivalent to region of negative differential viscosity). On the contrary, no oscillations are observed for speeds corresponding to the increasing branch of the pressure-suspension velocity curves. Note that although pressure oscillations are not perfectly regular, they have well defined frequency. Furthermore, their shape resembles this of stick-slip motion, as in the case studied above for shear flow between parallel plates. In addition, similarly to the case of shear flow between parallel plates, the amplitude and period of oscillations decrease as the speed of flow is increased and the magnetic field is decreased (Figure N.8).
Figure N.8.Dependencies of the pressure amplitude (a) and the oscillation period (b) on the imposed speed for MR fluid 2 at different applied magnetic fields. Solid curves correspond to
eye-guidelines. Reprinted with permission from [ROD 13]. Copyright (2013), The Society of Rheology
It is also important to notice that the flow rate of the MR fluid flowing out from the capillary outlet oscillated with time even though the flow rate imposed by the piston motion was kept constant. The outlet flow rate oscillations were synchronized with the pressure difference oscillations. When the pressure difference increased the MR fluid did not come out from the capillary, the outlet flow rate was undetectable; when the pressure difference decreased, the MR fluid flowed out rapidly from the capillary, the outlet flow rate experienced a sharp peak [ROD 13]. Such intermittent
Flow instabilites in magnetorheological fluids 15
motion is another feature of the stick-slip instability. Furthermore, significant variations of the outlet flow rate reveal the importance of the MR fluid compressibility in the considered system. Numerous tests have shown that the parameters of the pressure oscillations where strongly affected by the MR fluid compressibility. For instance, both theory and experiments confirm that the slope of the increasing parts of the pressure difference vs. time curves (Figures N.7a, N.7b and N.7d) is proportional to the MR fluid compression modulus, which is of the order of 10 GPa for the results shown in figure N7.
N.4. Theory and discussion
We have studied three different types of MR fluids and two different flow regimes. We have found that in all these cases the application of a magnetic field induces flow instabilities within a precise range of shear rate or flow rate. Consequently, these instabilities should be related to the particle structures that are induced by the magnetic field application, which are responsible for the MR effect. These instabilities are evidenced by the appearance of a decreasing region of the flow curve (region of negative differential viscosity) and the oscillation of the shear stress or the pressure difference for imposed shear rates within this region of negative differential viscosity. In this section we discuss the physics behind the appearance of these instabilities.
N.4.1. Suspension of silica-coated iron particles in mineral oil (MR fluid 1)
The suspension of Fe-CC particles in mineral oil (MR fluid 1) contains a very high concentration of solids (close to the maximum packing fraction). Consequently, the magnetic field application should induce in this case some thick columnar aggregates, closely spaced along the gap between the plates of the rheometer –see the work by Cutillas and Bossis on the particle structures in electrorheological fluids and magnetorheological fluids [CUT 97]. In order to elucidate the origin of instabilities in MR fluid 1, we should investigate the structural changes that take place in the fluid. Unfortunately, conventional methods such as dynamic light scattering, particle image velocimetry, magnetic resonance imaging, neutron or X-ray scattering are not at all suitable for MR fluids, due to their opacity, large particle size and the use of external magnetic fields. Therefore, we used direct visualization of the macroscopic flow pattern by a similar method to these used in [PER 94] and [PIG 96] for the study of silica gels and laponite clays. To be precise, we proceeded as it follows. First, we placed the MR fluid sample in the measuring system of the rheometer and pre-sheared it. Afterwards, we applied to the sample a magnetic field of a given intensity and kept it switched on while we scratched a vertically oriented, cylindrical canal on the edge of the disk-like sample. Subsequently, we fully filled this canal with a pigmented column of titanium dioxide nanoparticles in glycerol
using a micro-needle. Finally we subjected the MR fluid to a constant shear rate, either within the region of negative differential viscosity of outside this region, and observed the evolution of the pigmented column as the shear of the sample advanced.
Figure N.9.Direct visualization of shear localization in highly concentrated MR suspensions (MR fluid 1) upon application of a magnetic field strength, H0=18.5 kA/m. At
subcritical shear rate, γɺ=0.01 s-1, the initially straight pigmented column (a) breaks into two parts in the middle plane, the lower part being adhered to the lower plate and the upper part
moving as a whole with the upper plate (b). This behavior could be interpreted in terms of shear localization at the middle plane. At supercritical shear rate, γɺ=0.5 s-1, the straight column (a) is strained in an affine way (c), showing a homogeneous deformation of the suspension. The red circles in (b) surround the two parts of the broken pigmented column.
The black curves in (c) are guidelines indicating the position of the upper and lower rheometer plates. Reprinted with permission from [LOP 13]. Copyright (2013), The Society of
Rheology
We observed that when the MR fluid was sheared at a shear rate within the region of negative differential viscosity, the pigmented column broke at the middle, with the resulting two halves moving separately and remaining perpendicular to the rheometer plates (Figures N.9a and N.9b). At higher shear rates, outside the region of negative differential viscosity, the pigmented column experienced a uniform deformation, spanning the gap between both plates and elongating as it was tilted by the shear. Consequently, we could interpret that in those cases in which flow instabilities took place, the MR fluid was fractured approximately at its middle plane, with shear localization occurring within a narrow lubrication layer, as depicted in Figure N.10. Accordingly, the stick-slip process could be explained as it follows. At the beginning of the shear, the MR fluid structures are tilted by the shear until a critical angle is reached. This angle corresponds to the maximum of the shear stress vs. shear strain curve of the MR fluid. The structures are supposed to become mechanically unstable at this angle and, they break at approximately their middle height (Figure N.10b). From the macroscopic point of view such rupture of the aggregates corresponds to the fracture of the MR fluid at its middle plane and the
appearance of a lubrication layer without particles (Figure N.10a). Afte fractured, the two broken halves of the aggregates turn quickly back (slip) until they collide against each other. The two colliding halves form a new aggregate, which is again deformed until a critical angle is reached (stick) (Figure N.10). Becau found experimentally that the stress was not released to zero at the end of the slip, but decreased only by a maximum of 30 %, it was likely the case that the two MR fluid halves (below and above the lubrication layer) did not recover initial zero strain, as depicted in Figure N.10a.
Figure N.10. (a) Macroscopic description of the different stages of the stick
phenomenon in MR fluid 1. From left to right: homogeneous deformation of the suspension as a whole; fracture of the suspension structure
(onset of the slip with formation of a lubrication layer); backward rotation of the two suspension blocks with sliding friction between them; stick of
strain, γmin (in this sketch
local strain decreases by ∆γ point of view. Reprinted with
Based on the hypothesis
aggregates, we developed a theoretical model for the stick shear stress –a detailed description of this
[LOP 13]. Briefly, we consider
aggregates whose thickness (or, equivalently, the number of single chains per one multi-chain) increases with increasing magnetic field.
process the whole suspension
manner. We supposed that the strain increased linearly with time in this process, and calculated the stress as a function of the strain. For this
MR fluid as a magnetic, anisotropic elastic solid (let us remember that the stick process took place below the yield point) and used the general form of the stress tensor for such a continuum
ik F ik H Bi k H Bk i
σ = δ + + +
ɶ
Flow instabilites in magnetorheological fluids
appearance of a lubrication layer without particles (Figure N.10a). Afte fractured, the two broken halves of the aggregates turn quickly back (slip) until they collide against each other. The two colliding halves form a new aggregate, which is again deformed until a critical angle is reached (stick) (Figure N.10). Becau found experimentally that the stress was not released to zero at the end of the slip, but decreased only by a maximum of 30 %, it was likely the case that the two MR fluid halves (below and above the lubrication layer) did not recover initial zero
rain, as depicted in Figure N.10a.
(a) Macroscopic description of the different stages of the
stick-phenomenon in MR fluid 1. From left to right: homogeneous deformation of the suspension as a whole; fracture of the suspension structure at the middle plane at a critical strain, γ
(onset of the slip with formation of a lubrication layer); backward rotation of the two suspension blocks with sliding friction between them; stick of the two blocks at some minimum
in this sketch it is indicated that during the block rotation, i.e., slip process decreases by ∆γ). (b) Similar to (a) but from the microscopic (particle structure)
Reprinted with permission from [LOP 13]. Copyright (2013), The Society of Rheology
hypothesis of the periodic rupture and reformation of the particle we developed a theoretical model for the stick-slip oscillatio
a detailed description of this model can be found in [LOP 12 Briefly, we considered a hexagonal array of straight multi aggregates whose thickness (or, equivalently, the number of single chains per one
chain) increases with increasing magnetic field. In our model, during
the whole suspension and the particle chains were deformed in an affine . We supposed that the strain increased linearly with time in this process, and calculated the stress as a function of the strain. For this purpose we considere
a magnetic, anisotropic elastic solid (let us remember that the stick process took place below the yield point) and used the general form of the stress
continuum [LAN 84]:
(
)
, 1 2 ik ik i k k i ik T F F H B H B γ ∂ = + + + ∂ H ɶinstabilites in magnetorheological fluids 17
appearance of a lubrication layer without particles (Figure N.10a). After being fractured, the two broken halves of the aggregates turn quickly back (slip) until they collide against each other. The two colliding halves form a new aggregate, which is again deformed until a critical angle is reached (stick) (Figure N.10). Because we found experimentally that the stress was not released to zero at the end of the slip, but decreased only by a maximum of 30 %, it was likely the case that the two MR fluid halves (below and above the lubrication layer) did not recover initial zero
-slip phenomenon in MR fluid 1. From left to right: homogeneous deformation of the suspension as
the middle plane at a critical strain, γcrit
(onset of the slip with formation of a lubrication layer); backward rotation of the two two blocks at some minimum
slip process, the . (b) Similar to (a) but from the microscopic (particle structure) The Society of
of the periodic rupture and reformation of the particle ns of the [LOP 12a] and a hexagonal array of straight multi-chain aggregates whose thickness (or, equivalently, the number of single chains per one during the stick in an affine . We supposed that the strain increased linearly with time in this process, and we considered the a magnetic, anisotropic elastic solid (let us remember that the stick process took place below the yield point) and used the general form of the stress
In this expression, σik, γik and δik are the ik-components of the stress tensor, the
strain tensor and the unit tensor, respectively; H and B are respectively the magnetic field intensity and the magnetic flux density inside the suspension; and Fɶ is a thermodynamic function defined through the free energy of the suspension per unit volume, F, as follows: 0 0 F≡ − ⋅ =F F −
∫
⋅d H H B B H ɶ [N.3] with F0 being the free energy per unit volume of the suspension in the absence ofmagnetic field. From equation [N.2], the shear stress is obtained as a function of the shear strain:
(
)
2(
)
2 2 2 0 2 2 0 2 2 0 2 1 1 1 2 2 (1 ) 1 1 1 H γ H µ µ γ H γ σ µ µ µ µ µ µ µ γ γ γ γ γ γ ⊥ ⊥ ⊥ ∂ ∂ = − + − ∂ ⋅ + + ∂ ⋅ + + − + [N.4]with
µ
andµ
⊥ being the components of the magnetic permeability tensor of the suspension along the major and minor axes of the particle structures, respectively.Equation [N.4] gives for the shear stress a non-monotonic function of the strain, with a maximum value at a critical shear strain. At this critical shear strain value the particle structures become mechanically unstable and break at their middle point, provoking the fracture of the MR fluid sample –see [LOP 12a] for detailed discussion. This point marks the onset of the slip process, during which the upper and lower halves of the fractured sample (and structures) are supposed to rotate until they collide with each other, sticking immediately as a consequence of the attractive magnetic forces, as depicted in Figure N.10b. This point marks the onset of the stick process. We can estimate the local strain during the slip by equating the magnetic and the hydrodynamic torques acting on the network of half-chains. Finally, both the shear strain and the shear stress are calculated as a function of time (Figure N.11).
As observed the theoretical prediction of the stick-slip oscillations qualitatively agrees with the experimental observations (compare Figures N.5 and N.11). The main difference between theory and experiments is the rounded shape of the theoretical oscillations in comparison with the sharper shape of the experimental oscillations. The reason for this discrepancy is the rounded shape of the theoretical curve of the stress as a function of the strain near its maximum –see [LOP 12a].
Flow instabilites in magnetorheological fluids 19
Figure N.11.Theoretical time dependencies of the local strain and of the suspension shear stress for a highly concentrated MR suspension (MR fluid 1) upon application of a magnetic field of strength H0=18.5 kA/m, and a global shear rate of 0.01 s-1. Reprinted with permission
from [LOP 13]. Copyright (2013), The Society of Rheology
N.4.2. Suspension of CIP in silicone oil (MR fluid 2)
The suspension of CIP in silicone oil was studied under pressure-driven flow through a capillary in the presence of a magnetic field gradient (Figure N.1). As described above, the experimental curves of the pressure difference as a function of the flow rate presented a decreasing branch (Figure N.3), in which flow instabilities, evidenced by the oscillation of the pressure difference for a constant flow rate, were obtained (Figure N.7).
The likely physical reason for these oscillations is the magnetic field gradient that provokes a tendency of magnetic particle aggregates to concentrate around the maximum of magnetic field. This fact, together with the interaction of particle aggregates with the walls of the capillary makes the aggregates to move at a different speed than the liquid carrier, which provokes filtration of the liquid through the array of particle aggregates. Thus, neglecting the gravitational forces, the array of particle aggregates is subjected to the hydrodynamic drag force, Fh, exerted by the
liquid carrier, the magnetic force, Fm, coming from the magnetic field gradient, and
the force of interaction with the walls of the capillary, Fw. Then, by using Newton’s
second law, applied to an elementary volume,
δ
V
=
π
R dz
2 , we can estimate the speed of the aggregates. In this expression, R is the internal radius of the capillary, and z is the vertical coordinate (see Figure N.1). Newton’s second law in the inertialess limit can thus be written as:0
h m w
F
+
F
+
F
=
[N.5] We need analytic expressions of these forces to solve the problem. We estimated the hydrodynamic drag force per unit volume, fh by the Darcy filtration law [NOT
94; MOR 99]:
(
)
0 h a Kη
= − f u u [N.6] In this expression, η0 is the viscosity of the carrier liquid, u its velocity, ua this of theparticle aggregates, and K the hydraulic permeability of the array of particle aggregates. Note at this point that we considered a hexagonal array of cylindrical aggregates. Analytical expression for K can be found in [BRU 93] and [ROD 13]. Finally, the z-component of the hydrodynamic drag force, Fh, can be calculated by
integration over the considered elementary volume.
The magnetic force exerted to the aggregates contained in the elementary volume δV and subjected to a magnetic field gradient is given by [ROS 85]:
0 m dH F M V dz µ δ = [N.7] where M is the suspension magnetization.
Concerning the wall interaction, due to the rough internal surface of the capillary used in this work, the magnetic particles close to the wall could safely be supposed to be entrapped in the wall rugosities. Then, the force of interaction with the walls comes from the shear stress required to fracture the particle aggregates close to the walls, as depicted in Figure N.1 –the whole aggregate is ruptured from the particles entrapped into the wall rugosities. In this context, the wall shear stress may be regarded as the static yield stress of the MR fluid, σY, and the force of interaction
with the walls in the elementary volume,
δ
V , calculated as [ROD 13]:sgn( ) sgn( ) w a Y a Y S F u dS u S δ σ σ δ = −
∫∫
= − [N.8] In this expression, δS=2πRdz and −sgn(ua) stands for the fact that the wall force is opposite to the aggregate motion. We can approximate the average of σY withinthe area of integration of equation [N.8], <σY>, with the yield stress corresponding
to shear flow between two parallel plates. However, we should be very careful to take into account the dependence of σY with the concentration of particles and the
Flow instabilites in magnetorheological fluids 21
magnetic field, which are both dependent on the z-coordinate along the capillary. For this purpose we can use the empirical expression obtained by fitting the experimental data of Chin and co-workers [CHI 01; ROD 13]:
1/ 2 3 / 2 0 n S Y Y M c B
σ
σ
µ
≈ = Φ [N.9]In this expression Ms is the saturation magnetization of the particles, µ0 the magnetic
permeability of vacuum, B the magnetic flux density, and c=0.1 and n=1.85 are fitting parameters.
At this point we can replace the expression of the forces in equation [N.5] and solve it for the velocity of the aggregates [ROD 13]:
0 0 2 0, at Y S a u dH u M R K dz η σ µ = > + [N.10] 0 0 0 0 2 2 , at S Y Y a S u K dH dH u u M M R dz R K dz η σ µ σ µ η = − − < + [N.11]
Furthermore, the distribution of the particle volume fraction, Φ(z), along the capillary can be obtained from the mass conservation equation, equating the particle flux at a given location z to the one at the capillary inlet:
0 0
( )z u za( ) ua
Φ = Φ
[N.12] In this expression, Φ0 and
u
a0 are, respectively, the particle volume fraction andthe aggregate velocity at the inlet of the capillary. Combining equations [N.11] and [N.12], we obtain a single equation for the concentration profile Φ(z), which is solved numerically for the unknown function, Φ(z).
We need finally the theoretical pressure–flow rate curve. For this purpose, we integrated the equations of motion of our two-phase suspension (the magnetic particles and the suspending liquid being displaced at different velocities) and obtained the following expression for the pressure difference gradient dP/dz as function of the superficial (imposed) velocity uS of the suspension:
0 1 / 2 2 uS 2 Y dP dz K R R η σ ≈ − − [N.13]
By integration of equation [N.13] over the capillary length, L, we obtained the curve of the pressure difference as a function of the imposed speed [ROD 13]:
/ 2 / 2 0 1/ 2 / 2 / 2 2 S L 2 L Y L L u dz P dz R K R
η
σ
− − ∆ ≈∫
+∫
[N.14] Performing this integration, we keep in mind that that the quantities K and σYdepend on the concentration profile Φ(z), which was found by the solution of equations [N.11] and [N.12].
Theoretical predictions of this model qualitatively agree with the experimental trends, as observed in Figure N.3. The appearance of the decreasing branch of the pressure-flow rate curves is interpreted in terms of the interplay between the hydrodynamic and magnetic interactions acting on particle structures. In more details, our analysis shows that the magnetic particles can get strongly crowded in the region of high magnetic field between the poles pieces of the electromagnet at middle length of the capillary (Figure N.1). As the imposed speed increases the particles have less time to be accumulated there and their concentration in this region decreases up to the initial value Φ0 in the infinite speed limit. This causes a
gradual decrease of the field-induced yield stress and consequently of the second term in the right-hand side of equation [N.14] with the imposed speed. On the other hand, an increasing speed causes a more intense hydrodynamic dissipation on the particle structures. As a result, the first term in the right-hand side of equation [N.14] increases with uS. The combination of these both effects leads to the
non-monotonic shape of the pressure-flow rate curve possessing a deep minimum (Figure N.3). For a detailed discussion on the possible reasons for the quantitative discrepancies between theory and experiments see [ROD 13].
In order to gain a better understanding of the oscillations from a microscopic point of view, we carried out similar experiments to this of MR fluid 1, but for a diluted suspension (5 vol.% of particle concentration) and using a transparent capillary. Simultaneously to measurements of the pressure difference and the flow rate at the outlet of the capillary, upon application of a field of Hmax=188 kA/m and
at the imposed speed us=0.52 m/s, we recorded with a CCD camera the flow inside
the transparent capillary –see results in Figure N.12. At the onset of the stick process, we distinguish column-like aggregates along all visible capillary volume (Figure N.12A). As the stick process progressed, the aggregates where progressively stuck to the capillary wall and accumulated in the vicinity of the poles of the electromagnet (Figure N.12B). During the stick, the aggregates did not move and the structure seemed to be frozen. Nevertheless, a slow filtration of the carrier liquid through the network of aggregates took placed, as detected by the motion of nonmagnetic impurities. During the slip process, once the maximum of the pressure
Flow instabilites in magnetorheological fluids 23
difference was overcome, most of the aggregates detached from the capillary wall and moved rapidly towards its outlet (Figures 12C and 12D). On the base of these observations we may therefore conclude that the fluctuations of the pressure difference appeared as a result of the periodic stick and rupture of the aggregates on the capillary walls, being strongly affected by the MR fluid compressibility.
Figure N.12.Visualization of moving structures of a dilute (Φ=0.05) MR suspension in a transparent capillary under a pressure-driven flow. The snapshots were taken along the pressure versus time curve shown on the top of the figure. As observed on the bottom of each
snapshot, the aggregates are attached to the walls and do not move during the stick (A and B), while they experience an intense motion towards the capillary outlet during the slip (C
and D). Reprinted with permission from [ROD 13]. Copyright (2013), The Society of Rheology
N.4.3. Suspension of CoNi fibers in mineral oil (MR fluid 3)
MR fluid 3 was studied under shear flow between parallel plates, similarly to MR fluid 1. In MR fluid 1, as discussed above, the origin of the instabilities is related to the very high concentration of solids. However, in the case of MR fluid 3, the concentration of solids was much lower (5 vol.%) and this hypothesis must be ruled out. Furthermore, the observed region of negative differential viscosity was obtained in the case of MR fluid 3 at much higher values of the shear rate (around 10 s-1) than in the case of MR fluid 1 (around 0.1 s-1). Our hypothesis is that the negative differential viscosity in the case of MR fluid 3 is connected to the existence of strong friction between particles. Note at this point that the relevant role of interparticle friction (in fact magnetic-field dependent friction force) in the rheology of suspensions of magnetic fibers was evidenced in the works [KUZ 09; LOP 09; VER 09]. On the other hand, the role of friction between particles in the magnetorheology of suspensions of spherical particles should be negligible, because of their spherical shape that reduces the contact surface between neighboring particles.
Let us now show that friction forces between magnetic fibers can indeed be responsible for the negative differential viscosity from a theoretical point of view. Upon magnetic field application, CoNi nanofibers should be gathered into bulk-like aggregates oriented along the magnetic field direction in the absence of shear – actually only this fact could explain the large magnetorheological effect observed in Figure N.4. Note, nevertheless, that due to the Brownian character of the fibers of MR fluid 3, we do not expect gap-spanning aggregates in this case [LOP 12]. We consider that these aggregates are ellipsoidal in shape and present a branched network structure, with friction between fibers inside each aggregate. Upon shearing, the particle aggregates deviate from the field direction to a certain angle (Figure N.13). In a first approximation we neglect destruction of aggregates by the shear, as interfiber friction could prevent this from happening. In the real case, there should be a statistical distribution of friction forces along fibers, with some fibers experiencing stronger friction than others. In other words, some fibers should be able to move in response to changes of orientation of the magnetic field with respect to the main axis of the aggregate, whereas others would be blocked with respect to movement inside the aggregate. This situation could be simplified by considering that there are two types of aggregates, one consisting of fibers able to move inside the aggregate and another with fibers unable to change their positions inside the aggregate. This gives rise to two types of aggregates: aggregates with changeable magnetization and aggregates with fixed magnetization (Figure N.13). At this point it is worthy to mention that CoNi fibers used in the present work were single-domain from the magnetic point of view [LOP 12b].
Flow instabilites in magnetorheological fluids 25
Figure N.13.Illustration of the clusters with the changeable (left) and fixed (right) magnetization. [ZUB 13]- Reproduced by permission of The Royal Society of Chemistry
The macroscopic stress
σ
in the suspension can be written as:0 1 2
σ η γ σ
= ɺ+ +σ
[N.15] In this expression,
η
0 is the viscosity of the carrier liquid,γ
ɺ
is the shear rate, andσ
i is the stress induced by the aggregates of type i. Let us denote with thesubscript 1 the aggregates with changeable magnetization and with 2 those with fixed magnetization.
Neglecting the thermal fluctuations of the aggregate orientation,
σ
i can bewritten as [ZUB 13]:
(
)
(
)
(
2 2)
0
1
cos 2 2 2 sin cos
2 2 m i i i i i i i i V σ = Φ Γ + Φη α + ζ βλ β+ + θ + χ− λβ θ θ γ ɺ[N.16]
In this expression, Φi is the volume concentration of the aggregates of type i, Vi their
volume, Γim the torque to which they are subjected due to the magnetic forces,
θ
i the angle of their main axis with respect to the direction of the applied magnetic field, andα,
β,λ,
χ
andζ
are kinetic coefficients, which depend on the cluster aspect ratio. The explicit forms of α,β,λ,χ,ζ and Γimare given in [ZUB 13]. Concerning the angle
θ
i under stationary flow, it can be calculated by equating the magnetic and the hydrodynamic torques which act on the aggregate [ZUB 13]. Afterwards, we can calculate the total shear stress of the MR fluid by means of equations [N.17] and [N.18], as a function of the volume concentration of each type of aggregates, Φi. Unfortunately, since there is not any fundamental statistical theoryof systems with internal friction, we cannot theoretically calculate the volume concentration of each type of aggregates. We can, nevertheless, use them as fitting parameters when comparing theory with experiments. For this purpose, and taking
into account that in the present work the total concentration of particles in MR fluid 3 is 5 vol.%, we can consider
Φ
1+ Φ
2= 0.15
, which implies a volume concentration of fibers inside the aggregates of 33 vol.%. Note that this value seems quite reasonable, since according to Onsager’s theory, the maximum concentration at which space distribution of rod-like particles remains isotropic isφ
n= 3.3 / p
,wherep is the aspect ratio of the rod-like particles [LAR 99]. For the fibers of the present
work
p
≈ 8.5
and, thus,φ
n≈ 0.39
.Figure N.14.Shear stress σ (Pa) as a function of shear rate γɺ (s-1) for MR fluid 3. Lines represent predictions of the theoretical model (equation N.15); symbols represent experiments. 1 and full squares – H= 400 kA/m; 2 and open squares – H= 300 kA/m; 3 and open circles – H= 200 kA/m. [ZUB 13]- Reproduced by permission of The Royal Society of
Chemistry
Theoretical predictions of this model semi-quantitatively agree with the experimental results (Figure N.14). It is noticeable that our theory predicts not only the shape of the flow curves, but also the increase of the magnitudes of the stress peak and the shear rate corresponding to the stress maximum with the magnetic field strength. Furthermore, note that the aspect ratios, ri, of the aggregates were taken as
adjustable parameters in our model, and that the obtained values (r1=200; r2=100)
are also in agreement with microscopic observations performed in diluted suspensions of fibers [LOP 12]. This agreement between theory and experiments validates our hypothesis of interparticle friction being in the origin of the negative


![Figure N.5d as an example). In this case we only observe some small oscillations, associated to the instrumental error [LOP 13]](https://thumb-eu.123doks.com/thumbv2/123doknet/13271646.397564/14.892.194.698.454.827/figure-example-observe-small-oscillations-associated-instrumental-error.webp)