HAL Id: hal-01091791
https://hal.archives-ouvertes.fr/hal-01091791
Submitted on 6 Dec 2014
HAL is a multi-disciplinary open access
archive for the deposit and dissemination of
sci-entific research documents, whether they are
pub-lished or not. The documents may come from
teaching and research institutions in France or
abroad, or from public or private research centers.
L’archive ouverte pluridisciplinaire HAL, est
destinée au dépôt et à la diffusion de documents
scientifiques de niveau recherche, publiés ou non,
émanant des établissements d’enseignement et de
recherche français ou étrangers, des laboratoires
publics ou privés.
Tail-scope: Using friends to estimate heavy tails of
degree distributions in large-scale complex networks
Young-Ho Eom, Hang-Hyun Jo
To cite this version:
Young-Ho Eom, Hang-Hyun Jo. Tail-scope: Using friends to estimate heavy tails of degree
distribu-tions in large-scale complex networks. Scientific Reports, Nature Publishing Group, 2015, 5, pp.09752.
�10.1038/srep09752�. �hal-01091791�
arXiv:1411.6871v1 [physics.soc-ph] 25 Nov 2014
in large-scale complex networks
Young-Ho Eom
Laboratoire de Physique Th´eorique du CNRS, IRSAMC, Universit´e de Toulouse, UPS, F-31062 Toulouse, France
Hang-Hyun Jo
BK21plus Physics Division and Department of Physics,
Pohang University of Science and Technology, Pohang 790-784, Republic of Korea and BECS, Aalto University School of Science, P.O. Box 12200, FI-00076, Finland
Many complex networks in natural and social phenomena have often been characterized by heavy-tailed degree distributions. However, due to rapidly growing size of network data and concerns on privacy issues about using these data, it becomes more difficult to analyze complete data sets. Thus, it is crucial to devise effective and efficient estimation methods for heavy tails of degree distributions in large-scale networks only using local information of a small fraction of sampled nodes. Here we propose a tail-scope method based on local observational bias of the friendship paradox. We show that the tail-scope method outperforms the uniform node sampling for estimating heavy tails of degree distributions, while the opposite tendency is observed in the range of small degrees. In order to take advantages of both sampling methods, we devise the hybrid method that successfully recovers the whole range of degree distributions. Our tail-scope method shows how structural heterogeneities of large-scale complex networks can be used to effectively reveal the network structure only with limited local information.
I. INTRODUCTION
Complex networks have served as a powerful mathe-matical framework to describe complex systems of na-ture, society, and technology [1–5]. Most complex net-works obtained from complex systems are known to be heterogeneous in various aspects [6–9]. One of distinctive heterogeneous features in complex networks is the heavy-tailed degree distribution: A small number of highly nected nodes coexist with the large number of lowly con-nected nodes. Highly concon-nected nodes or hubs found in heavy tails have significant roles on the evolution of com-plex networks and dynamics on such networks. For ex-amples, the existence of hubs leads networks to endemic states in epidemic spreading [10, 11], makes networks vul-nerable to intended attacks [12], and contributes to the key functions of biological systems [13–15]. Therefore, identifying the degree distribution and particularly hubs in the heavy tail of degree distribution is the essential step for the network analysis [16].
Owing to the rapid development of digital technolo-gies, a huge amount of network data is being generated and recorded. In particular, the network data from so-cial media like Twitter and Wikipedia contain tens of millions to billion nodes (users or articles). The role of social media on social dynamics such as public opinion formation, information diffusion, and popularity [17–19] is getting more crucial, requiring us to timely monitor the large-scale dynamics and to identify the network struc-ture underlying these dynamics [4, 20]. However, since the social media are constantly growing and changing, the acquisition and analysis of complete network data is an extremely tricky task. Further, increasing public con-cerns on privacy issues about using these data can inhibit
us from analyzing the complete network data [21]. Because of the above difficulties, degree distributions of complex networks need to be estimated based on par-tial information or by sampling nodes from networks. The simplest method could be to sample nodes randomly, which is called uniform node sampling (UNS). Since the number of nodes corresponding to the tail part of dis-tribution is typically very small, those nodes are rarely sampled, limiting the sampling resolution. Accordingly, much larger statistical fluctuations are expected for the tail part of degree distribution estimated by UNS, when compared to its body part.
The friendship paradox (FP) [22–24] can shed light on how to effectively estimate the heavy tails of degree distributions. The FP states that the degree of an in-dividual is on average smaller than the average degree of its friends or neighbors. The underlying mechanism behind the FP is the observational bias such that highly connected nodes are more likely to be observed by their neighbors. One can take advantage of this observational bias for the effective sampling of highly connected nodes. Indeed, the group made of friends of randomly chosen nodes turns out to contain highly connected nodes more than the group made of uniformly sampled nodes [24, 25]. Further, the FP has also been used for early detection of contagious outbreaks [21, 26] and natural disaster [27], and for designing efficient immunization strategy [28]. These are mainly based on the observation of activities of highly connected nodes via the FP rather than uniformly sampled nodes.
In this paper, we devise a novel sampling method, called tail-scope, to effectively estimate the heavy tails of degree distributions in large-scale complex networks. We exploit the observational bias of FP as a magnifying
2 glass to observe heavy tails with better resolution and
to overcome the resolution limit in the UNS. It is shown that the tail-scope method estimates heavy tails of em-pirical degree distributions in large-scale networks more accurately than the UNS. Finally, we suggest a hybrid sampling method taking advantages of both UNS and tail-scope methods to recover the whole range of degree distribution.
II. RESULTS
A. Tail-scope: Estimating the tail of degree distribution using the friendship paradox
We consider a directed network G = G(N, L) with N nodes and L directed links. In case of undirected net-works, each undirected link is considered as two directed links in both directions. For a node i, the in-degree ki
represents the number of incoming links to i from i’s in-neighbors, and the in-degree distribution is denoted by P (k). Similarly, one can define the out-degree as the number of out-neighbors.
Our goal is to effectively estimate the heavy tail of in-degree distribution, i.e., the region of k ≫ 1, by using partial information such as by sampling n nodes with n ≪ N . The observational bias of friendship paradox (FP) indicates that observation via friends can lead to the larger number of high degree nodes than that by the uniform node sampling (UNS), because the chance of a node being observed by its neighbors is proportional to the degree of the node. For this, we randomly choose n directed links and construct a set of nodes reached by following those links. The probability of finding a node of in-degree k in the set is proportional to kP (k) not to P (k), which we denote by ˜Q(k):
˜
Q(k) ∝ kP (k). (1) Then we obtain the estimated in-degree distribution as
˜
P (k) ∝ Q(k)˜
k . (2)
Thanks to the observational bias of FP, the estimated ˜
P (k) has the larger number of highly connected nodes and hence less statistical fluctuation for the tail part than when the UNS is used. Our method can be called
tail-scope. Precisely, the sampling resolution characterized by the cutoff kc(n) of the distribution is higher for the
tail-scope method than for the UNS.
In order to demonstrate the effectiveness of tail-scope method for estimating the heavy tail of the distribution, we consider a network showing the power-law in-degree distribution with power-law exponent α > 2 and mini-mum in-degree kmin:
P (k) = (α − 1)kα−1mink−α, (3)
where we have assumed for convenience that the in-degree k is a continuous variable. At first, by ran-domly choosing n nodes (i.e., by UNS) we obtain the estimated in-degree distribution PUN(k) that is expected
to be ∝ k−α. Due to the finiteness of n, we find the
natural cutoff to the power-law tail as PUN(k) ∝ k
−αe−k/kc
, (4)
where kc can be characterized by the condition
1 n = Z ∞ kc P (k)dk, (5) leading to kc= kminn1/(α−1). (6)
Next, for the tail-scope method, we expect from ˜Q(k) ∝ kP (k) that ˜ Q(k) ∝ k−(α−1)e−k/k′ c, (7) k′ c = kminn1/(α−2). (8)
Then one gets the estimated in-degree distribution in Eq. (2):
˜
P (k) ∝ k−αe−k/k′
c. (9)
It is evident that the sampling resolution k′
c for the
tail-scope case is higher than kc for the UNS, precisely,
k′ c
kc
= n1/[(α−2)(α−1)]> 1. (10)
Therefore, our tail-scope method indeed outperforms the UNS for estimating the tail of the distribution. Since the tail-scope method is based on the uniform link sampling, it can also be called link tail-scope, mainly in order to distinguish from node tail-scope to be discussed in the next Subsection.
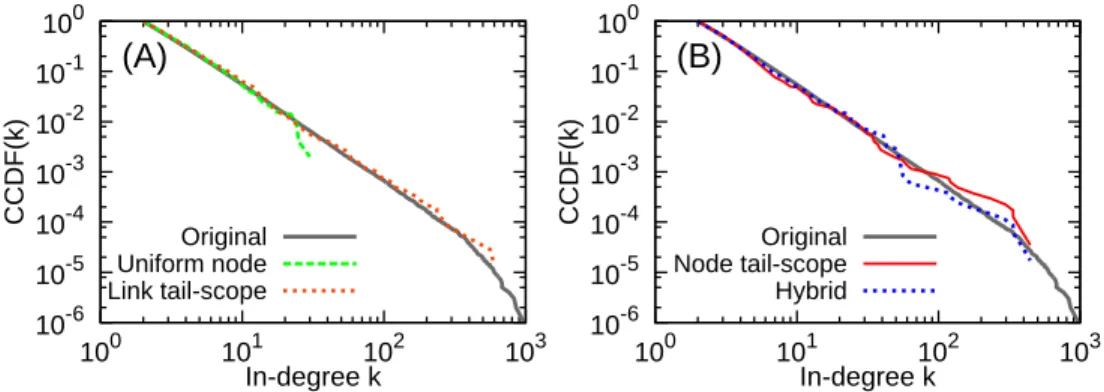
We numerically test our calculations by constructing the Barab´asi-Albert (BA) scale-free network [6] with N = 106, k
min = 2, and α = 3, and then by sampling
n = 500 nodes. From the calculations, we expect that kc ≈ 45 and kc′ ≈ 1000, which are numerically
con-firmed as shown in Fig 1(A). In the figures, we have used the complementary cumulative distribution function (CCDF), defined as F (k) =P∞
k′=kP (k ′
), for clearer vi-sualization.
B. Node-based tail-scope method
Our tail-scope method is based on the uniform link sampling. However, in many realistic situations, we can use only the node-based sampling not the link-based sam-pling. For instance, most application programming inter-faces (APIs) of social media like Twitter allow us to re-trieve only the user-specific information rather than the
relationship-based ones. Thus it is necessary to develop a sampling method using node-based data but aimed to simulate the link tail-scope method.
As social media APIs allow to get only user-specific local information in most cases, we assume that when-ever a node is sampled or retrieved, we get the set of in- and out-neighbors for the sampled node. These constraints inevitably introduce correlations between sampled links, implying that any node-based tail-scope methods cannot be exactly mapped to the link tail-scope method. In addition, we assume that the number of retrievals, i.e., sampling size, is strictly limited to n for the fair comparison to other sampling methods, e.g., the UNS. We propose the node tail-scope method as follows.
Node tail-scope method:
• Step 1. Randomly choose n/2 nodes (called pri-mary nodes) from the network and retrieve their neighbors to construct a set A of those out-neighbors.
• Step 2. Randomly choose n/2 nodes from the set A and retrieve their in-degrees to construct the dis-tribution QNT(k).
• Step 3. Obtain the estimated in-degree distribu-tion PNT(k) from QNT(k)/k.
Here the subscript NT of distributions is the abbrevi-ation of node tail-scope. Note that as the total number of retrievals is limited to n, we use n/2 retrievals for get-ting out-neighbors, and the rest n/2 retrievals for getget-ting in-degrees. However, there are more high degree nodes sampled than when the UNS is used, leading to the higher resolution for the tail-scope method. For a node sampled several times in Step 2, we consider each sampling as a different case.
By using the same BA network in the previous Sub-section, we compare the performance of node tail-scope, shown in Fig. 1(B) to that of link tail-scope in Fig. 1(A). It is observed that there is no significant difference be-tween two results.
C. Performance of the node tail-scope method
In order to empirically compare the performance of node tail-scope method to the UNS, we consider several large-scale complex networks: three undirected networks and four directed networks. For details of these networks, see the Method Section and Table I. From now on, we use the sample size n = 1000 in all cases.
Figure 2 shows estimated in-degree distributions PNT(k) (node tail-scope) and PUN(k) (UNS), in
compar-ison to the original in-degree distribution P (k) obtained from the complete set of nodes in the network. The agreements between original distributions and the distri-butions by node tail-scope method in the tail parts are
remarkable, while some fluctuations are observed in the body parts. On the other hand, the distributions by the UNS show good agreements with the original distribu-tions in the body parts, not in the tail parts. Note that the sample size n = 1000 is much smaller than the net-work size N ranging from hundreds of thousands to tens of millions nodes (see Table I). We find that the results using n = 2000 and n = 4000 are qualitatively the same as the case of n = 1000.
For the quantitative comparison of performance by dif-ferent sampling methods, we use Kolmogorov-Smirnov (KS) static D, defined as the maximum difference be-tween two CCDFs. The KS D-static is mainly used as a part of KS test to reject null hypothesis. For exam-ple, it has been used to test if a given distribution has a power-law tail [16]. In this paper, we simply use D-static to measure the agreement between the original in-degree distribution and the estimated in-degree distribution by each sampling method. The D-static for the node tail-scope method is obtained as
DNT= max
k |FNT(k) − F (k)|, (11)
where F (k) denotes the CCDF of the original in-degree distribution, and FNT(k) denotes the CCDF of PNT(k).
Similarly, DUN is defined for the UNS. The smaller
D-static implies the better agreement to the original distri-bution.
Then, we define a p-value to compare the two consid-ered sampling methods. The p-value represents the prob-ability that the distribution by node tail-scope method has the smaller D-static with the original distribution than the distribution by the UNS, i.e.,
p = Pr(DNT< DUN). (12)
To focus on the tail part of the distribution, we compare the CCDFs only for the region of k ≥ k0, or equivalently
for the fraction γ of high degree nodes, where γ = F (k0).
The case of γ = 1 corresponds to the comparison for the entire range of in-degree. Figure 3 shows the values of p(γ) for different ranges of in-degree and for each consid-ered network. It is found for all networks that the node tail-scope method clearly outperforms the UNS for the tail parts. The opposite tendency is observed when the entire range of the distribution is compared, because the UNS outperforms the node tail-scope for estimating the body part of the distribution. Since the sample size n is limited, the larger number of high degree nodes for the node tail-scope method results in the smaller number of low degree nodes and hence the larger fluctuations than the case of UNS.
D. Hybrid method for recovering the whole distribution
It is evident that the UNS and the node tail-scope method are good at sampling low and high degree nodes,
4 respectively. In order to take advantages of both
meth-ods, we suggest the hybrid method for recovering the whole range of the distribution. It is notable that at Step 1 in our node tail-scope method, n/2 primary nodes are randomly chosen and hence their in-degrees can be uti-lized for the low degree region. From the primary nodes, we get the in-degree distribution PNT0(k). Then the
hy-brid distribution is obtained by
PH(k) = aPNT0(k) + (1 − a)PNT(k). (13)
The weight parameter a ∈ [0, 1] can be chosen according to which part of the distribution is focused. Here we set as a = 0.5.
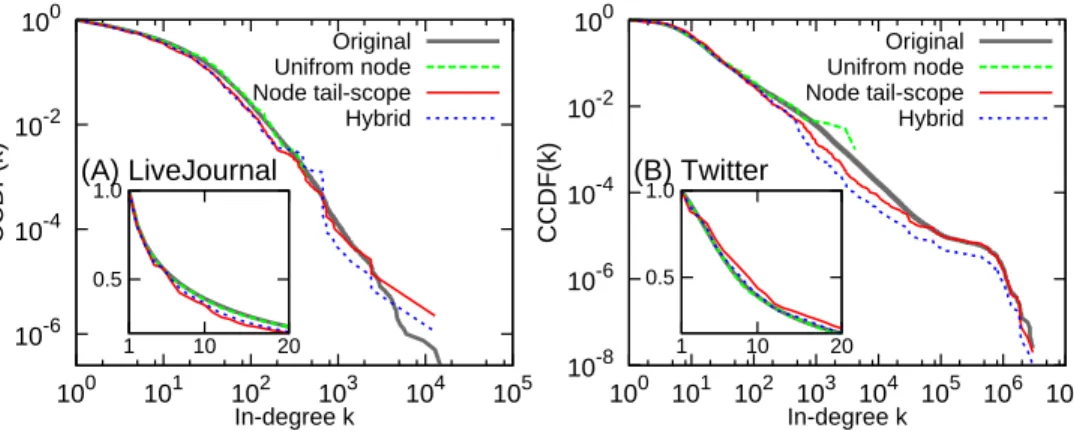
The hybrid method performs well for the BA network in Fig. 1(B) as well as for empirical networks, two of which are shown in Fig. 4. As expected, the distributions estimated by the hybrid method fit the original distribu-tions better than the UNS for the tail parts, and better than the node tail-scope method for the body parts (see insets in Fig. 4). These findings are also consistent with the values of p(γ) shown in Fig. 5: The larger values of p(γ) for small values of γ in Fig. 5(A) imply the better performance of the hybrid method than the UNS for the tail parts. The larger values of p(γ) for large values of γ in Fig. 5(B) imply the better performance of the hy-brid method than the node tail-scope for the body parts. Therefore, we conclude that the hybrid method success-fully recovers the whole range of in-degree distributions, by taking advantages of both the UNS and the node tail-scope methods. Other values of a = 0.25 and a = 0.75 have been also tested and all results are as expected.
III. DISCUSSION
Modern societies have been shaped by large-scale net-worked systems like World Wide Web, social media, and transportation systems. Monitoring global activities and identifying the network structure of these systems are of utmost importance in better understanding collective social dynamics. However, increasing size of data from these systems and growing concerns on privacy issues about using these data make the exhausted analysis of complete data sets infeasible. Thus, effective and ef-ficient estimation of large-scale networks based on the small sample size or partial information is necessary. One of the simplest method could be uniform node sampling (UNS). The UNS has drawbacks in particular for esti-mating the heavy tails of degree distributions, due to the limited sampling resolution and large statistical fluc-tuations. Since high degree nodes found in the heavy tails are in many cases very important to characterize the structure and dynamics of complex networks, we propose the tail-scope method, which is the effective and efficient sampling method for estimation of heavy tails of degree distributions.
Provided that the sample size is limited, it is inevitable that the larger number of high degree nodes by the
tail-scope method leads to the smaller number of low degree nodes than when the UNS is used. In order to take ad-vantages of both the tail-scope and the UNS, we propose the hybrid method to recover the whole range of degree distributions. In this paper, we have considered a very simple form of hybrid method by superposing the esti-mated degree distributions of the UNS and the tail-scope. It turns out that the hybrid method performs better than the UNS for the tail parts, and better than the tail-scope for the body parts. Devising more general and better hybrid methods will be interesting as a future work, e.g., one can use the degree-dependent weight parameter a in Eq. (13).
Our tail-scope method can be also used for estimating high attribute nodes found in the heavy tail of attribute distribution. The attribute of a node can be its activity, income, happiness, and so on. Recently, the generalized friendship paradox (GFP) has been observed and ana-lyzed in complex networks [24, 29]. The GFP states that the attribute of a node is on average lower than the av-erage attribute of its neighbors. In the network showing the positive correlation between degrees and attributes, high degree nodes tend to have higher attributes. It im-plies that the high attribute nodes are more likely to be observed by their neighbors. Such generalized observa-tional bias can be exploited to effectively estimate high attribute nodes who play important roles, e.g., in early detection of new trends or in designing efficient immu-nization strategies. Thus, it would be very interesting to generalize our tail-scope method to other attributes of nodes, especially for the large-scale complex networks.
Our tail-scope method shows how structural hetero-geneities can help us reveal the network structure only with limited information. By exploiting such hetero-geneities of complex networks we can properly evaluate priority and importance of each node in the networks. It is getting more important to better understand the het-erogeneities since they are key features characterizing the complexity of large-scale networks.
IV. METHODS
A. Data description
In this paper, we consider seven empirical networks: three of them are undirected and the others are directed. The summary of the networks is presented in Table I. The detailed feature of each network is as following.
Coauthorship. We used a coauthorship network con-structed in [24]. The nodes are scientists and the links are formed whenever two scientists coauthored the paper. The network size is N = 242592.
Gowalla. We used a Gowalla friendship network con-structed in [30]. Gowalla is a location-based social net-working service. Each user defines a node. The network size is N = 196562.
LiveJournal. We used a LiveJournal friendship work constructed in [31]. Livejournal.com is a social net-working service for blog, journal, and diary. The nodes are users of LiveJournal and the users can declare friend-ship to another user, defining a link. The network size is N = 3997962.
Citation. We used a citation network constructed in [32]. The network is based on the bibliographic database from 1893 to 2009 provided by American Phys-ical Society (APS). The nodes are articles published in APS journal such as Physical Review Letters or Physical Review E and the directed links represent the citation re-lation between articles. The network size is N = 463349.
Web graph. We used a web graph constructed in [33]. The nodes represent webpages in the domains of berkely.edu and stanford.edu domains, and the links are hyperlink between webpages. The network size is N = 685230.
Wikipedia. We used an English Wikipedia network constructed in [34]. The Wikipedia data set was collected
in February 2013. The nodes are English Wikipedia ar-ticles and the links are hyperlinks between those arar-ticles. The network size is N = 4212493.
Twitter. We used a Twitter users network constructed in [35]. The nodes are Twitter users and the links be-tween users represent the following relations in Twitter. The network size is N = 41652230.
Acknowledgements
The authors thank American Physical Society for pro-viding Physical Review bibliographic data. Y.-H.E. ac-knowledges support from the EC FET Open project “New tools and algorithms for directed network analy-sis” (NADINE number 288956). H.-H.J. acknowledges financial support by the Aalto University postdoctoral programme.
[1] Boccaletti, S., Latora, V., Moreno, Y., Chavez, M. and Hwang, D.-U. Complex networks: Structure and dynam-ics. Phys. Rep. 424, 175-308 (2006).
[2] Newman, M. E. J. Networks: An Introduction. (Oxford University Press, Oxford, 2010)
[3] Barab´asi, A.-L. and Oltvai, Z. N. Network biology: un-derstanding the cells functional organization. Nat. Rev.
Gen. 5, 101-113 (2004).
[4] Lazer, D. et al. Computational social science. Science 323, 721-723 (2009).
[5] Vespignani, A. Modelling dynamical processes in complex socio-technical systems. Nat. Phy. 8, 32-39 (2011). [6] Barab´asi, A.-L. and Albert, R. Emergence of scaling in
random networks. Science 286, 509-512 (1998).
[7] Watts, D. J. and Strogatz, S. H. Collective dynamics of ‘small-world’ networks. Nature 393, 440-442 (1998). [8] Newman, M. E. J. Assortative mixing in networks, Phys.
Rev. Lett. 89, 208701 (2002).
[9] Fortunato, S. Community detection in graphs. Phys. Rep. 486, 75-174 (2010).
[10] Pastor-Satorras, R. and Vespignani, A. Epidemic spread-ing in scale-free networks. Phys. Rev. Lett. 86, 3200-3203 (2001).
[11] Castellano, C. and Pastor-Satorras, R. Competing acti-vation mechanisms in epidemics on networks. Sci. Rep. 2, 371 (2012).
[12] Albert, R., Jeong, H., and Barab´asi, A.-L. Error and attack tolerance of complex networks. Nature 406, 378-382 (2000)
[13] Jeong, H., Mason, S. P., Barab´asi, A.-L. and Oltvai, Z. N. Lethality and centrality in protein networks. Nature 411, 41-42 (2001).
[14] Han, J. D. et al. Evidence for dynamically organized modularity in the yeast protein-protein interaction net-work. Nature 430, 88-93 (2004).
[15] Zotenko, E., Mestre, J., O’Leary, D. P., and Przyty-cka, T. M. Why do hubs in the Yeast protein interaction network tend to be essential: Reexamining the
connec-tion between the network topology and essentiality, PLoS
Comput. Biol. 4, e1000140 (2008).
[16] Clauset, A., Shalizi, C. R., and Newman, M. E. J. Power-law distributions in empirical data. SIAM Review 51, 661-703 (2009).
[17] Centola, D. The spread of behavior in an online social network experiment. Science 329, 1194-1197 (2010). [18] Bakshy, E., Rosenn, I., Marlow, C., and Adamic, L. The
role of social networks in information diffusion. In WWW’
12: Proc. 21st Intl. Conf. on World Wide Web, Lyon, France. New York, NY, USA: ACM. (2012, April 16-20). [19] Christakis, N. A. and Fowler, J. H. The spread of obesity in a large social network over 32 years. N. Engl. J. Med. 357, 370 (2007).
[20] Castello, C., Fortunato, S., and Loreto, V. Statistical physics of social dynamics. Rev. Mod. Phys. 81, 591-646 (2009).
[21] Garcia-Herranz M., Moro E., Cebrian M., Christakis N. A., and Fowler J. H. Using friends as sensors to de-tect global-scale contagious outbreaks. PLoS ONE 9(4): e92413 (2014).
[22] Feld, S. L. Why Your Friends Have More Friends Than Yo Do. Am. J. of Sociol. 96, 1464-1477 (1991).
[23] Hodas, N. O., Kooti, F. and Lerman, K. Friendship para-dox redux: Your friends are more interesting than you. In ICWSM’ 13: Proc 7th Int. AAAI Conf. on Weblogs
and Social Media, Cambridge, MA, USA. Palo Alto, CA, USA: The AAAI press (2013, July 8-10).
[24] Eom, Y.-H. and Jo, H.-H. Generalized friendship paradox in complex networks: The case of scientific collaboration.
Sci. Rep. 4, 4603 (2014).
[25] Avrachenkov, K., Litvak, N., Prokhorenkova, O. L., and Suyargulova, E. Quick Detection of High-degree Entities in Large Directed Networks. arXiv:1410.0571 (2014). [26] Christakis, N. A. and Fowler, J. H. Social network sensors
for early detection of contagious outbreaks. PLoS ONE 5, e12948 (2010).
6
and Cebrian, M. Performance of Social Network Sensors During Hurricane Sandy. arXiv:1402.2482 (2014). [28] Cohen, R. Havlin, S. ben-Avraham, D. Efficient
immu-nization strategies for computer networks and popula-tions. Phys. Rev. Lett. 91, 247901 (2003).
[29] Jo, H.-H. and Eom, Y.-H. Generalized friendship para-dox in networks with tunable degree-attribute correla-tion. Phys. Rev. E 90, 022809 (2014).
[30] Cho E., Myers S. A., and Leskovec J. Friendship and Mobility: User Movement in Location-Based Social Net-works. In KDD’ 11: Proc. 17th ACM SIGKDD Intl.
Conf. on Knowledge Discovery and Data Mining, San Diego, CA, USA. New York, NY, USA: ACM (2011, Au-gust 21-24).
[31] Yang J. and Leskovec J. Defining and Evaluating Net-work Communities based on Ground-truth. In ICDM’
12: Proc. IEEE Intl. Conf. on Data Miniing, Brussels,
Belgium, (2012, December 10-13).
[32] Eom, Y.-H., Fortunato, S. Characterizing and modeling citation dynamics. PLoS ONE 6, e24926 (2011). [33] Leskovec, J., Lang, K., Dasgupta, A., and Mahoney, M.
Community structure in large networks: Natural clus-ter sizes and the absence of large well-defined clusclus-ters.
Internet Mathematics 6(1), 29-123 (2009)
[34] Eom, Y.-H., Arag´on, P., Laniado, D., Kaltenbrunner, A., Vigna, S., Shepelyansky, D. L. Interactions of cultures and top people of Wikipedia from ranking of 24 language editions. arXiv:1405.7183 (2014).
[35] Kwak, H., Lee, C., Park, H. and Moon, S. What is Twitter, a social network or a news media? In WWW’
10: Proc. 19th Intl. on World Wide Web Conf.591-600 (2010).
10-6 10-5 10-4 10-3 10-2 10-1 100 100 101 102 103 CCDF(k) In-degree k
(A)
Original Uniform node Link tail-scope 10-6 10-5 10-4 10-3 10-2 10-1 100 100 101 102 103 CCDF(k) In-degree k(B)
Original Node tail-scope HybridFIG. 1: Comparison of in-degree distributions estimated by uniform node sampling, link tail-scope, node tail-scope, and hybrid methods to the original distribution for the Barab´asi-Albert scale-free network with N = 106
and minimum in-degree kmin= 2. The sample size is n = 500. In all cases, complementary cumulative distribution functions (CCDFs) are presented.
10-4 10-2 100 100 101 102 103 104 CCDF(k) In-degree k (A) Coauthor 10 -4 10-2 100 100 101 102 103 104 105 CCDF(k) In-degree k (B) Gowalla 10-6 10-4 10-2 100 100 101 102 103 104 105 CCDF(k) In-degree k (C) LiveJournal 10 -4 10-2 100 100 101 102 103 104 CCDF(k) In-degree k (D) Citation 10-4 10-2 100 100 101 102 103 104 105 CCDF(k) In-degree k
(E) Web graph 10-6
10-4 10-2 100 100 101 102 103 104 105 106 CCDF(k) In-degree k (F) Wikipedia 10-6 10-4 10-2 100 100101102103104105106107 CCDF(k)) In-degree k (G) Twitter Original Uniform node Node tail-scope
FIG. 2: Comparison of in-degree distributions estimated by uniform node sampling and node tail-scope methods to the original distributions for several empirical directed and undirected networks. The sample size is n = 1000. In all cases, complementary cumulative distribution functions (CCDFs) are presented. For the details of the networks, see the Method Section and Table I.
TABLE I: Basic statistics of empirical undirected and directed networks. N denotes the total number of nodes and hki denotes the average in-degree. The isolated nodes have been excluded for the analysis.
Undirected network N hki Directed network N hki Coauthorship 242592 59.6 Citation 463349 12.2
Gowalla 196562 9.7 Web graph 685230 12.3 LiveJournal 3997962 17.3 Wikipedia 4212493 26.4 Twitter 41652230 36.6
8 0 0.1 0.2 0.3 0.4 0.5 0.6 0.7 0.8 0.9 1 0.001 0.01 0.1 1 p( γ )-value γ BA Coauthor Gowalla LiveJournal Citation Web graph Wikipedia Twitter
FIG. 3: Performance of the node tail-scope method compared to the uniform node sampling for all the considered networks. p(γ) is calculated by Eq. (12) but with Kolmogorov-Smirnov D-statics defined only for the range of k ≥ k0, where γ = F (k0). The smaller γ corresponds to the larger k0. The larger p(γ)-values imply the better performance of the node tail-scope method than the uniform node sampling. To get p-values, we used 1000 realizations of sampling, for each of which the sample size is n= 1000. 10-6 10-4 10-2 100 100 101 102 103 104 105 CCDF(k) In-degree k (A) LiveJournal Original Unifrom node Node tail-scope Hybrid 10-8 10-6 10-4 10-2 100 100 101 102 103 104 105 106 107 CCDF(k) In-degree k (B) Twitter Original Unifrom node Node tail-scope Hybrid 0.5 1.0 1 10 20 0.5 1.0 1 10 20
FIG. 4: Comparison of in-degree distributions estimated by uniform node sampling, node tail-scope, and hybrid methods to the original distributions for networks of LiveJournal (A) and Twitter (B). The insets show results for the range of k ≤ 20. In all cases, complementary cumulative distribution functions (CCDFs) are presented.
0 0.2 0.4 0.6 0.8 1 0.001 0.01 0.1 1 p( γ )-value γ (A) Hybrid Vs Uniform node
0 0.2 0.4 0.6 0.8 1 0.001 0.01 0.1 1 p( γ )-value γ (B) Hybrid Vs Node tail-scope
BA Coauthor Gowalla LiveJournal Citation Web graph Wikipedia Twitter
FIG. 5: Performance of the hybrid method compared to the uniform node sampling (A) and to the node tail-scope method (B) for all the considered networks. p(γ) is calculated by Eq. (12) but with Kolmogorov-Smirnov D-statics defined only for the range of k ≥ k0, where γ = F (k0). The smaller γ corresponds to the larger k0. The larger p(γ)-values imply the better performance of the hybrid method than the uniform node sampling (A) or the node tail-scope method (B). To get p-values, we used 1000 realizations of sampling, for each of which the sample size is n = 1000.