HAL Id: hal-02324684
https://hal.archives-ouvertes.fr/hal-02324684
Submitted on 26 Mar 2021
HAL is a multi-disciplinary open access
archive for the deposit and dissemination of
sci-entific research documents, whether they are
pub-lished or not. The documents may come from
teaching and research institutions in France or
abroad, or from public or private research centers.
L’archive ouverte pluridisciplinaire HAL, est
destinée au dépôt et à la diffusion de documents
scientifiques de niveau recherche, publiés ou non,
émanant des établissements d’enseignement et de
recherche français ou étrangers, des laboratoires
publics ou privés.
organization of human ventral visual cortex at birth
P. Barttfeld, S. Abboud, H. Lagercrantz, U. Adén, N. Padilla, A. Edwards, L.
Cohen, M. Sigman, Stanislas Dehaene, Ghislaine Dehaene-Lambertz
To cite this version:
P. Barttfeld, S. Abboud, H. Lagercrantz, U. Adén, N. Padilla, et al.. Brain Structure and Function A
lateral-to-mesial organization of human ventral visual cortex at birth. Brain Structure and Function,
Springer Verlag, 2018, 223 (7), pp.3107-3119. �10.1007/s00429-018-1676-3�. �hal-02324684�
https://doi.org/10.1007/s00429-018-1676-3
ORIGINAL ARTICLE
A lateral-to-mesial organization of human ventral visual cortex
at birth
P. Barttfeld1,2 · S. Abboud4,5 · H. Lagercrantz6 · U. Adén6 · N. Padilla6 · A. D. Edwards7 · L. Cohen4,5 · M. Sigman3 · S. Dehaene1,8 · G. Dehaene-Lambertz1
Received: 14 May 2017 / Accepted: 3 May 2018
© Springer-Verlag GmbH Germany, part of Springer Nature 2018
Abstract
In human adults, ventral extra-striate visual cortex contains a mosaic of functionally specialized areas, some responding preferentially to natural visual categories such as faces (fusiform face area) or places (parahippocampal place area) and others to cultural inventions such as written words and numbers (visual word form and number form areas). It has been hypoth-esized that this mosaic arises from innate biases in cortico-cortical connectivity. We tested this hypothesis by examining functional resting-state correlation at birth using fMRI data from full-term human newborns. The results revealed that ventral visual regions are functionally connected with their contra-lateral homologous regions and also exhibit distinct patterns of long-distance functional correlation with anterior associative regions. A mesial-to-lateral organization was observed, with the signal of the more lateral regions, including the sites of visual word and number form areas, exhibiting higher correla-tions with voxels of the prefrontal, inferior parietal and temporal cortices, including language areas. Finally, we observed hemispheric asymmetries in the functional correlation of key areas of the language network that may influence later adult hemispheric lateralization. We suggest that long-distance circuits present at birth constrain the subsequent functional dif-ferentiation of the ventral visual cortex.
Keywords Neonates · Brain · Functional connectivity · Language
Introduction
The human brain displays a remarkable consistency and reproducibility in its functional organization across individu-als. This was first demonstrated in neuropsychological stud-ies that mapped specific cognitive deficits to reproducible
cortical lesion sites and more recently by brain-imaging research, which has revealed surprisingly similar functional subdivisions of the cortical surface across numerous individ-uals (Glasser et al. 2016; Huth et al. 2016). Not only is this reproducible topological specialization evident in domains of evolutionary relevance, such as for the fusiform face area (FFA) and the parahippocampal place area (PPA) (Downing et al. 2006), but it also extends to cultural acquisitions such as reading. For example, the same region of the left fusiform gyrus, the visual form area (vWFA), is consistently acti-vated whenever literate participants recognize written words,
P. Barttfeld and S. Abboud contributed equally to the work. Electronic supplementary material The online version of this article (https ://doi.org/10.1007/s0042 9-018-1676-3) contains supplementary material, which is available to authorized users. P. Barttfeld
1 Cognitive Neuroimaging Unit, CEA DSV/I2BM, INSERM,
Université Paris-Sud, Université Paris-Saclay, NeuroSpin Center, Gif-sur-Yvette, France
2 Instituto de Investigaciones Psicológicas (IIPsi), CONICET,
Universidad Nacional de Córdoba, Córdoba, Argentina
3 Universidad Torcuato Di Tella, Almirante Juan Saenz
Valiente 1010, C1428BIJ Buenos Aires, Argentina
4 INSERM, U 1127, Paris 75013, France
5 Institut Du Cerveau Et De La Moelle Epinière, ICM, PICNIC
Lab, Paris 75013, France
6 Department of Women’s and Children’s Health, Karolinska
Institutet, 171 76 Stockholm, Sweden
7 Centre for the Developing Brain, Division of Imaging
Sciences and Biomedical Engineering, King’s College London, London, UK
8 Collège de France, 75005 Paris, France
Barttfeld, P., Abboud, S., Lagercrantz, H., Aden, U., Padilla, N., Edwards, A. D., Cohen, L., Sigman, M., Dehaene, S., & Dehaene-Lambertz, G. (2018). A lateral-to-mesial organization of human ventral visual cortex at birth. Brain Struct Funct, 223(7), 3107-3119. doi:10.1007/s00429-018-1676-3
independently of case (Dehaene and Cohen 2011), modality (Striem-Amit et al. 2012) or the age of reading acquisition (Dehaene et al. 2010).
Such functional reproducibility suggests that cognitive processes are dependent on specific neural architectures (Hannagan et al. 2015). Indeed, functional responses have been consistently related to specific micro-architectures (e.g. word- and face-specific activations are observed in the regions FG2 and FG4, whereas places are activating FG1 and FG3, Weiner et al. 2016; Caspers et al. 2015), although the exact relation between a given cortical layer organization and a computational process is still poorly specified. Ana-tomical connectivity, by orchestrating local and distant syn-chrony, might also drive the functional role of an area. This “biased connectivity” hypothesis was recently supported by two studies showing that the precise locations of the FFA (Saygin et al. 2012) and VWFA (Saygin et al. 2016) can be predicted from their connections. The functional localization of the VWFA was predicted in 8-year-old readers by the anatomical fiber tracking performed at the age of 5 before they learned to read (Saygin et al. 2016).
Because all main fiber tracts are already present in full-term human neonates (Dubois et al. 2014, 2016; Kennedy et al. 2007; Kostović and Judaš 2010; Marín-Padilla 2011; Takahashi et al. 2011), in the present paper, we asked whether the initial connectome, present at birth, may explain at least some aspects of the subsequent functional speciali-zation. We focused here on the mesial-to-lateral organiza-tion of ventral visual cortex. The ventral visual pathway comprises a succession of functional areas extending from mesial to lateral regions including the mesial place area (PPA), the face fusiform area (FFA), the visual word form area (VWFA), the number form area (NFA) and a more lateral area responding to tools and objects. Furthermore, distinct face and place responses are already present in 6-month-old infants (Deen et al. 2017). Here, we examined whether a particular connectivity pattern of these regions is already in place at birth.
To this aim, we relied on resting-state functional correla-tion, i.e. the synchronization of the BOLD responses across distant regions at rest due to the spontaneous co-activity of different nodes of the same network (Smith et al. 2013; Glasser et al. 2016; Raichle 2015). Using this approach in full-term and even pre-term neonates, several studies have reported the presence of the main resting-state networks described in adults (Fransson et al. 2007, 2009, 2011; Doria et al. 2010; Smyser et al. 2010, 2011) as also more specific connectivity, such as thalamocortical connectivity (Toulmin et al. 2015) or from multisensory areas (Sours et al. 2017). Our goal was to go beyond the whole-brain description and determine whether long-distance connections specifi-cally arising from ventral visual areas already target distinct regions. We aimed to evaluate two contrasting theories for
the origins of adult functional specialization. The first of which, the “biased connectivity” hypothesis (Hannagan et al. 2015; Saygin et al. 2012) as explained above, predicts that mesial-to-lateral differences in functional correlation are already present at birth, in approximate correspondence to the functional mosaic later found in older children and adults. We then contrasted it to the latter hypothesis accord-ing to which brain connectivity is initially diffuse, over-abundant and largely isotropic and only becomes refined at a later stage during infancy and childhood through exposure to a given environment (Johnson 2011; Elman et al. 1996).
The “biased connectivity” hypothesis makes specific predictions for which we searched in our data. Given the reproducibility of the location of the visual word and num-ber form areas, we wondered whether these regions were already more connected with the temporo-frontal language network and the inferior parietal “number sense” regions than other mesial regions, which would explain their pro-pensity to acquire the role of processing arbitrary shapes to represent phonemes or numbers. Similarly, we wondered whether hemispheric biases in connectivity at birth already predated the later lateralized responses to faces and words in the right and left fusiform gyrus (Weiner et al. 2016). We thus analyzed whether key regions of the linguistic network (i.e. pars triangularis of the inferior frontal gyrus, superior and middle temporal gyrus) are differently related to the left and right ventral temporal regions.
Methods
Subjects
Twenty-four healthy full-term neonates scanned for research purposes were included in this study. The fMRI data were provided by the Karolinska University Hospital, Stockholm (14 neonates) and by the Centre for the Developing Brain, King’s College London (10 neonates) and have already been published (Fransson et al. 2009; Doria et al. 2010). All MR examinations were carried out according to the ethical guidelines and declarations of the Declaration of Helsinki (1975). Details can be found in the seminal papers. Six sub-jects were subsequently rejected due to excessive movement artefacts (see "Preprocessing" section). We thus analyzed 16 girls and 9 boys aged 41.1 weeks (std: 1.08) in average at scan.
MR image acquisition
For the Swedish cohort, infants were scanned during natu-ral sleep. Functional MRI scans were acquired on a Philips Intera 1.5 T scanner equipped with a 6-channel receive-only head coil. Echo planar imaging [time repetition (TR)/
time echo (TE)/flip angle = 2000 ms/50 ms/80°, voxel size = 2.8 × 2.8 × 4.5 mm, 20 slices] of the infant brain was performed for 10 min (300 EPI volumes). For the London cohort, infants were sedated with chloral hydrate (25–50 mg/ kg) and images were acquired at 3 T (Achieva, Philips, Best, Netherlands) with an 8-channel phased array head coil. Echo planar imaging (TR/TE/flip angle = 1500 ms/45 ms/90º, 2.5 × 2.5 × 3.25 mm, 22 slices) was performed for 6.4 min. In both groups, T1-weigthed images were acquired in each neo-nate. Although it is unconventional to merge data obtained from two different MRI scanners for combined group-level inference, we were confronted with the scarcity of the pub-lically available data at this age and the small size of the groups. Note that our first-level comparisons were computed within-subject searching for differences in functional con-nectivity between voxels. By merging the two groups, we probably increased the variance between subjects but we benefited from more degrees of freedom. To capture the group differences, a group-factor was declared in our sta-tistical analyses.
Preprocessing
FMRI images were all pre-processed using SPM8 (Well-come Institute of Imaging Neuroscience, London, UK) implemented in Matlab (Mathworks, Natick, MA, USA). Pre-processing involved within-subject realignment to account for head motion, spatial normalization to a tem-plate and smoothing: all images were realigned to the mean image of the resting state session using linear transforma-tions. The mean EPI image was spatially normalized to a 7-week-old infant template image for whom a sulci-based parcellation is available (Kabdebon et al. 2014), thus provid-ing anatomically defined region of interests to study func-tional connectivity. Brain growth and sulcation massively develop during the last trimester of gestation but decelerate after term-age. Although tertiary sulcation begins around full-term birth and continues to develop until adulthood, all main structures important for normalization are visible (see Kabdebon et al. 2014, for quantitative measures of inter-age variability of the location of the main sulci during the first semester of life). The transformation parameters obtained from this spatial normalization were subsequently applied to every functional image acquired during the resting state scanning session with a target voxel size of 2 × 2 × 2 mm3. Then, spatially normalized images were smoothed with an isotropic 5-mm3 full-width half-maximum Gaussian kernel. Next, we regressed out the effect of the following nuisance variables from the voxel time series using the REST toolbox for Matlab (http://restf mri.net): the six movement param-eters from the head motion correction stage along with the global signal of the entire brain and four nuisance signals obtained from a 3-mm sphere located in the ventricles and
white matter. Finally, all functional MRI time series were band-pass filtered (0.01–0.08 Hz).
Spontaneous movement during sleep in infants often con-sists of sudden hyperextensions along the body axis which produced spiking artefacts in the time series and might have, therefore, disrupted anterior–posterior correlations as a result of these pitch movements. Because subject motion is particularly deleterious on long-distance correlations (Power et al. 2015), we removed the artifacted time points through a semi-automatic method. First, we deleted brain volumes detected by the ART toolbox for SPM8 as contaminated by high levels of movement. Second, we visually inspected whether all traces of movement were removed from the voxel time series. When needed, more brain volumes were discarded until no trace of movement was visually detected in the time series. Concerns about such scrubbing have been raised in the literature as it decreases the degrees of free-dom and destroys the temporal time-series when too many successive brain volumes are removed (for a discussion see Power et al. 2015). Furthermore, given the non-stationarity of the functional correlations, some stages during which subjects might naturally move may be under-represented. These concerns are particularly critical when different populations with different levels of agitation are compared, such as infants with adults. However, this concern does not apply to our study, since we are comparing the connectivity between different voxels that have been similarly processed within subjects. In the end, six subjects whose remaining time-series were shorter than 130 scans were discarded to avoid noisy correlation estimations. All included subjects had at least 138 brain volumes (mean number of volumes: 218, SD: 47, min: 132, max: 300). We also estimated the temporal signal-to-noise ratio (tSNR) for every voxel of every infant, as the inverse of the coefficient of variation in time (tSNR = mean/stdev of the times series). There was no difference between the two groups [t(22) = 1.25, p = 0.22].
Clustering analysis
To parcel the ventral areas in clusters of voxels with similar patterns of functional correlation, we applied the follow-ing data-driven clusterfollow-ing method. First, we performed a functional correlation analysis (Brain Voyager, Neuroelf v1.0, http://neuro elf.net/) seeded from each voxel belong-ing to a mask of the ventral stream of the visual cortex, i.e., ventrally to the Calcarine sulcus expanding towards the anterior parahippocampal gyrus and limited to y = − 14 in the template (1484 voxels, corresponding to the union of the clusters presented in Fig. 1). In other words, in each individual neonate, time-series were extracted from each functional voxel within the mask z-normalized and used as general linear model (GLM) predictors. For each voxel in the mask, random-effects inference was then performed
on the group level. Second, each resulting group-level map was masked by a gray-matter mask, thresholded (voxelwise p < 0.01 uncorrected), binarized and reshaped into a numeri-cal vector. We then represented the functional correlation from all seeds as a matrix of 1484 columns (the number of seeds) and 14 808 rows (the number of gray-matter brain voxels). Third, we used an agglomerative hierarchical clus-tering algorithm to cluster the seed voxels with a similar spatial pattern of functional correlation (i.e. a similar matrix columns). A hierarchical cluster tree was constructed using the Ward linkage measure on Euclidean distances (minimum variance algorithm merging at each step the pair of clusters that leads to the minimal increase in total within-cluster variance). The final number of clusters was optimized using the silhouette technique which quantifies the ratio between the largest inter-cluster distance over the smallest distance to a point outside the cluster. An assessment of all solu-tions in the range of 2–15 clusters showed a local maximum for 4 clusters. Fourth, in order to study the brain networks correlated with each of these four clusters, we performed a group-level analysis similar to the one described above, but using the average time-series from all the voxels of each cluster computed in each individual neonate. We also com-puted partial correlation coefficients for each cluster in order to regress out the time-series of all other clusters and thus obtain its unique correlation pattern (Fig. 1). Significance
thresholds were set to q = 0.01 (FDR-corrected for multiple comparisons) when using partial correlation and q = 0.001 (FDR-corrected for multiple comparisons) when using Pear-son’s correlation.
Seed analysis
Clustering analyses provide a coarse grouping of voxels with similar connectivity tendencies but blind to anatomical boundaries. To reveal a finer dissection of the ventral con-nectivity, we used the anatomical parcellation proposed by Kabdebon et al. (2014) on a two-month-old infant template to define defined four ROIs, based on the gray matter of 4 sulci bordering the lingual, fusiform (internal part), fusiform (external part) and the inferior temporal gyrus. Those ROIs were used as seeds for the correlation analysis (Fig. 2a). For each subject and each ROI, we defined the time-series T as the average time-series across all the voxels within the ROI. Then, we calculated the Pearson correlation between T and the time-series of all the voxels in the brain, V. Through this procedure, we obtained four correlation brain volumes or maps per subject s and ROI r (Cs,r), which were Fisher-transformed (Matlab function atanh) to produce Zs,r. To test for significant correlations across subjects between T and all voxels in the brain, we performed a one-way t test on each ROI r, setting the significance value at p < 0.01,
R L
3- Anterior lateral
1- Medial occipital, posterior 2- Medial Occipital, anterior
4- Posterior lateral
a
b
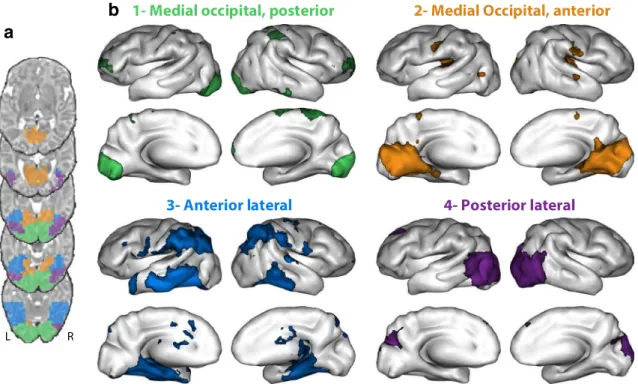
Fig. 1 Clustering of ventral visual cortex according to long-distance whole-brain functional correlations in newborns. a Four clusters were identified and are presented by different colors on axial slices of the infant template. b Partial correlation maps showing the distinct
pat-terns of whole-brain correlations associated with each of the four clusters. All clusters exhibit long-distance functional correlations, but the most lateral and anterior cluster (C3) appears to be specifically correlated to inferior parietal and frontal associative areas
FDR-corrected voxelwise. We also performed a within-sub-jects ANOVA between maps so as to compare pairs of Zs,r for each individual subject, setting the significance value at p < 0.01 for visualization purposes (a more strict threshold of p < 0.001 did not qualitatively change the results).
Regression analysis
Given that the boundaries between ROIs in the previous analysis were based on sulci that might not follow cytoarchi-tectonic boundaries (Fischl et al. 2008), we also performed an analysis free of this constraint through voxel-wise regres-sion to explore the mesial-to-lateral gradient in a ROI-inde-pendent manner. We constructed a mask comprising both left and right ventral regions (Fig. 4a). We reduced this mask to a x,y grid along the left–right and antero-posterior axes, merging together all voxels along the z axis (dorsal–ventral axis), as the mosaic of activations to visual categories that we wanted to explore is mainly evident along these two axes (Weiner et al. 2016). We computed the correlation map for each x,y pair and the time series of all voxels in the brain in each subject and obtained a total of 276 (for left hemi-sphere) and 258 (for right hemihemi-sphere) correlation maps per subject. To identify regions whose correlation with voxels in the ROI would depend on their x and y coordinates, we performed a first-level regression analysis (using SPM) for each subject. We then submitted the x-related contrast to a second-level analysis, in order to quantify the influence of the x coordinate on functional correlation. We modeled the cohort origin (i.e. England or Sweden) explicitly as blocks in the analysis. The resulting second-level beta map and its
associated t-map revealed the relation between the x axis and functional correlation: the higher the beta and the t value, the more connected each voxel was with increasing values of x (i.e. from medial to lateral localization). Conversely, the smaller the effect the more connected each voxel was with decreasing values of x. We performed this procedure for the left and the right hemispheres, inverting the x values when necessary to keep the convention that increasing x val-ues correspond to lateral locations. We focused here on the medial–lateral axis (x coordinate) along which specific acti-vation for the different visual categories are ordered whereas the anterior-posterior axis (y coordinate) is more sensitive to the hierarchical analyses within a category, more difficult to segregate in particular across subjects (Tanaka 1996).
We wondered whether the differences we observed between mesial and lateral regions were related to their level of maturation which might have created different delays in neurovascular coupling. As a control procedure aimed at accounting for this possibility, we repeated the analysis including the average T2 value of the template brain at the same locations as a regressor and thus a proxy for maturation index (Leroy et al. 2011).
Analysis of hemispheric differences
Because the VWFA and the FFA are, respectively, left and right lateralized in adults, we studied whether differences in functional correlation were observed early in development, between the ventral areas and key regions of the linguistic network. Therefore, we recovered the following anatomi-cally pre-defined ROIs from the infant atlas provided by
ROI 1 ROI 4 ROI 2 ROI 3 T value Left Right 6 2.49 (FDRcorr)
a
b
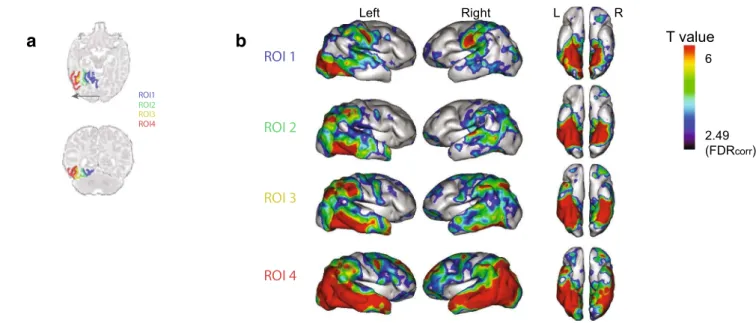
ROI2 ROI3 ROI4 ROI1 L RFig. 2 Functional connectivity of the four ROIS located along the medial–lateral axis. a The four ROIs used in this analysis as seeds, ordered from mesial to lateral, are presented on a horizontal and
coro-nal slice of the template (Kabdebon et al. 2014). b Functional correla-tions of the 4 ROIs, rendered on a 3D infant inflated brain. p = 0.01, FDR corrected
Kabdebon et al. (2014): the pars triangularis of the infe-rior frontal gyrus (region number 4 in the atlas), the mid-dle temporal gyrus (region 27) and the superior temporal gyrus (region 28). We truncated regions 27 and 28 along the anterior–posterior axis at the level of the deepest angle of the planum temporale so as to keep the ROIs’ most ante-rior parts. This was done to avoid any overlap or vicinity of the seeds with the visual stream that could have biased the analysis with spurious local correlations.
For every subject and every pair of left–right regions, (e.g. left and right pars triangularis), we performed two seed analyses, the first between the left ROI time-series and the rest of the brain and the second using the right ROI time-series. We thus obtained two functional correlation maps per subject and ROI pair. To test for hemispheric laterality biases, we performed a series of t test (for each value of x coordinate) on the left–right difference collapsing all y coordinate values between values of y coordinate of 9 and 13. The significance threshold was set at p < 0.05, Bonfer-roni corrected for multiple comparisons (42 comparisons, corresponding to the 42 voxels along the x coordinate).
Results
Parcellation of visual ventral regions
We first performed a data-driven clustering of the voxels in the bilateral ventral regions according to their functional correlation pattern. Voxels were clustered together or sepa-rately as a function of the similarity of the pattern of cor-relation with the entire brain. This clustering procedure was combined with a partial correlation analysis in order to display the unique functional fingerprint of each cluster (i.e. not shared with other clusters). We identified four main clusters: C1, or Medial Occipital, posterior, an exclusively posterior occipital group connected with the frontal pole, the right inferior temporal gyrus and paracentral regions consisting of the right post-central gyrus, paracentral lob-ule and supplementary motor area; C2, or Medial Occipital, anterior, connected with neighboring mesial areas (lingual, fusiform, parahipocampal gyri, and the cuneus) and more distant primary regions, such as the central sulcus, Heschl’s gyrus, planum temporale, bilateral posterior insula and the center of the right STAP region (the STAP is a region of the superior temporal sulcus under Heschl’s gyrus, deeper in the right than in the left hemisphere in almost all humans, Leroy et al. 2015); C3, or Anterior Lateral, a clusterwhich had the most extended unique functional correlation, connected to the inferior and middle temporal lobes, the inferior parietal regions comprising the inter-parietal sulcus, and the precen-tral gyri; C4, or Posterior Lateral, a cluster connected to the dorsal visual steam, cuneus and left dorso-lateral prefrontal
region (Fig. 1 for functional correlation using Pearson’s correlation).
Functional correlation based on anatomical ROIs
The parcels defined above correspond to an optimal statisti-cal solution given our data but may differ from the anatomi-cal reality. We thus sought to confirm the above conclusions using four anatomical ROIs progressively aligned along the medial-external axis of the left ventral temporal cortex in order to determine how they connected to the rest of the brain. As expected from the previous analysis, the observed functional correlation was not limited to neighboring ipsilat-eral areas or to homologous regions in the right hemisphere (Fig. 2). Rather, the connections crossed hemispheres to join distant associative areas in the right hemisphere. We observed a different correlation pattern depending on ROI position (Fig. 3a, b): the most mesial ROI (ROI1, or Lingual gyrus) functionally related to the superior temporal region as well as central motor and sensory regions, whereas the most lateral ROI (ROI4, inferior temporal gyrus) was prin-cipally correlated with the whole temporal lobe, the inferior parietal region and the prefrontal region. ROIs 1 and 4 thus shared similarities with the clusters C2 and C3 of the previ-ous analysis.
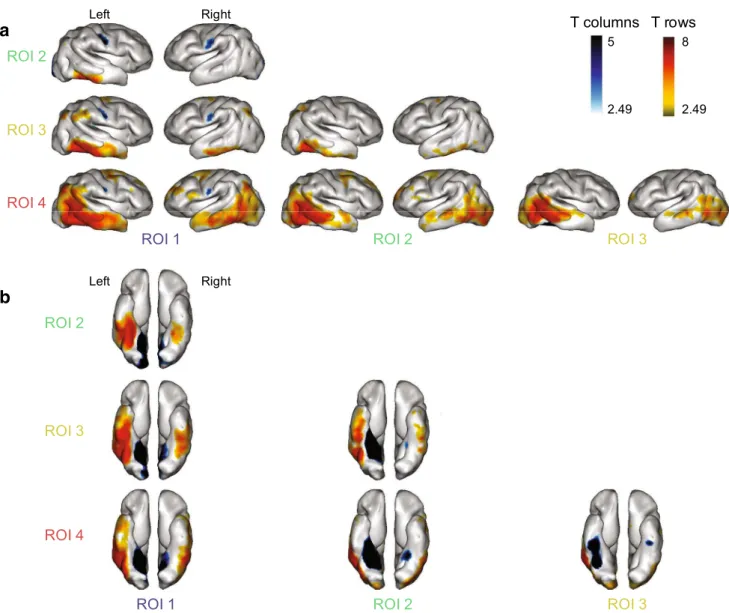
Pairwise comparisons between the patterns of functional correlation of the different ROIs (Fig. 2) revealed that ROI1 (lingual gyrus) was most strongly correlated with the lower part of the central sulcus and Heschl’s gyrus bilaterally. ROI2, the medial part of the fusiform gyrus presented only local correlations which extended more anteriorly in the left fusiform and inferior temporal gyri relative to ROI1. A sharp change occurred with ROI3, the lateral part of the fusiform gyrus, which displayed correlations with the ventral regions in both hemispheres and moreover with the supra-marginal and angular gyri, also in both hemispheres. This change cor-responds to the mid-fusiform sulcus, separating the internal and external part of the fusiform gyrus (Weiner et al. 2014). Finally, ROI4 (inferior temporal gyrus) displayed the most extended correlation pattern, exhibiting stronger correla-tions with the whole temporal lobe and prefrontal regions relatively to the other ROIs and notably to ROI3. It is notice-able that the significant changes of functional correlation patterns between the lateral part of the fusiform (ROI3) and the inferior temporal gyrus (ROI4) spared the parietal and frontal regions.
A possible confound is a similar neurovascular coupling in regions at the same maturational stage. While there is no indication that equally maturating regions will show a correlated functional activity in time, to account for this possibility we repeated the analysis including the average T2 value of the template brain at the same location as a regressor and thus as a proxy for maturation index (Leroy
et al. 2011). Because dendritic development impairs water motion in the gray matter and myelination in the white mat-ter, T2 signal becomes progressively darker during the first year of life and can hence be used as a proxy for neural maturation (Leroy et al. 2011). We observed virtually the same functional correlation pattern, suggesting that maps presented in Fig. 2 are not directly related to a maturational neuro-vascular gradient.
A third, voxel-wise, analysis aimed to verify that the mesial-to-lateral organization of the fusiform gyrus was not biased by our arbitrary, although anatomical, ROI defi-nition. To this aim, we examined the functional correlation between each x,y location in a ventral region encompassing
the calcarine sulci, lingual gyrus, fusiform gyrus and infe-rior temporal gyrus and examined the dependency of this functional correlation pattern on the x-coordinate of the voxel of origin (see “Methods”). In agreement with our previous ROI analysis, functional correlation was sensitive to the x-coordinates (Fig. 4): Heschl’s gyrus and posterior insula signal showed a greater functional correlation with mesial voxels in the ventral visual cortex (thus appearing as a negative correlation in Fig. 4b), whereas associative areas of the temporal lobe (sparing the superior temporal region) in both hemispheres, the left angular and supra-marginal gyri and both prefrontal regions showed a greater
ROI 1 ROI 2 ROI 4 ROI 3 ROI 2 ROI 3
b
Left Right ROI 1 ROI 2 ROI 4 ROI 3 ROI 2 ROI 3 T columns T rows 5 2.49 8 2.49a
Left RightFig. 3 A mesial-lateral gradient of functional correlation in the infant ventral visual cortex. The connectivity patterns of each pair of the ROIs presented in Fig. 2 are compared two by two. Each column pre-sents the t-contrast row ROI > column ROI on a lateral views and b ventral views. For illustration purposes, p value was set at p < 0.01,
uncorrected. A mesial-to-lateral gradient is clearly visible: mesial seeds preferably correlate with primary regions, visible as blue regions in the first column, while lateral ROIs are more strongly related to associative regions in the temporal, parietal and frontal lobes
−40−32−24−16 −8 0 8 16 24 32 40 −48 −42 −36 −30 −24
Middle Temporal Gyrus
y (M N I) C (l ef t ri gh t) C (l ef t ri gh t) C (l ef t ri gh t)
Inferior Frontal Gyrus (triangularis)
Superior Temporal Gyrus
x coordinate (MNI) Y (M N I) y (M N I) x coordinate (MNI) x coordinate (MNI) x coordinate (MNI) x coordinate (MNI) x coordinate (MNI) Left Right
T values X coordinate Left
Left Right
T values X coordinate Right
a
voxel ID X (MNI) Y (MNI) Mapb
1 2 3 4 5 15 15 16 16 17 -42 -43 -43 -44 -45
c
f
i
d
g
j
e
h
k
−40−32−24−16 −8 0 8 16 24 32 40 0.1 0 −40−32−24−16 −8 0 8 16 24 32 40 −0.1 0 0.1 0.2 −40−32−24−16 −8 0 8 16 24 32 40 −0.1 0 0.1 T T 4 2.49 4 2.49 4 2.49 −40−32−24−16 −8 0 8 16 24 32 40 −48 −42 −36 −30 −24 −40−32−24−16 −8 0 8 16 24 32 40 −48 −42 −36 −30 −24 0.1 -0.1Fig. 4 Hemispheric differences in long-distance functional correla-tions. a The mask containing all voxels used as seeds in the regres-sion analysis is presented on a horizontal slice. To quantify to what extent functional correlations vary with the x-coordinate, a connec-tivity map was computed for each voxel in this mask and was subse-quently entered into a regression analysis with the x coordinate as a regressor. b Functional correlation pattern as a function of the x-axis location of the seed in the left and right hemispheres. The more posi-tive the value, the stronger the correlation with lateral voxels (e.g. the right inferior frontal region with a lateral left seed), whereas the more negative the value the stronger the correlation with mesial voxels (e.g. Heschl’s gyrus on both sides). c–k Analyses of hemispheric biases.
c, f, i Display the location of the three bilateral ROIs used as seeds: inferior frontal gyrus (c), medial temporal gyrus (f) and superior tem-poral gyrus (i). d, g, j Display the flat projection of the ventral areas, showing the difference in functional correlation between the left and right seeds (voxels more connected with the left seed appear in red, whereas those more connected with the right seed appear in blue). The grid corresponds to the mask presented in (a). e, h, k The dif-ferences between left and right functional correlation values are plot-ted as a function of the x coordinate. Dots over the curve mark the spots where the difference in connectivity is significantly different (p < 0.05, Bonferroni corrected)
functional correlation with lateral voxels (thus appearing as a positive correlation in Fig. 4b; see Table S2).
Hemispheric asymmetries
Finally, to study putative asymmetries in the manner in which right and left ventral streams relate to the language network, we performed a within-subject comparison of the functional correlation maps arising from three pairs of sym-metrical anatomical ROIs located at key language-related areas: pars triangularis in the inferior frontal gyrus (IFG), superior and middle temporal gyri (STG and MTG). Fig-ure 4c–k thus show to what extent each site in the left and right ventral visual cortex was more strongly correlated to the left or right IFG, STG and MTG. Unsurprisingly, STG and MTG exhibited a stronger correlation with the ipsilateral than with the contralateral hemisphere, but this relation was stronger in the left hemisphere at a peak close to the loca-tion of the VWFA in adults (x = − 36 and y = − 30, MNI coordinates). After correction for multiple comparisons, this peak remained significant only for the MTG (Fig. 4 g, j). More surprisingly, the left IFG signal was more correlated than the right IFG with a right lateral ventral spot at x = 24 and y = − 30 (MNI coordinates).
Discussion
We explored the pattern of functional correlations of the ventral visual cortex with the rest of the brain in sleeping full-term neonates. Both of our analyses, whether data-driven (Fig. 1) or based on anatomically defined regions (Fig. 2), revealed a clear partition of the ventral regions supporting the hypothesis of an early functional organiza-tion. Mesial ventral areas were notably correlated with other primary regions whereas the most lateral regions were more correlated with the whole temporal lobe, the inferior parietal region and the prefrontal region with a transition occurring between ROI 2 and 3 (Fig. 2). This boundary roughly corre-sponds to the mid-fusiform sulcus which splits the fusiform gyrus (Weiner et al. 2014). This sulcus has been proposed as a robust cyto-architectonic landmark between FG1 and FG3 on one side and FG2 and FG4 on the other side, and functional landmark between the place area and the FFA/ VWFA in adults (Weiner et al. 2014, 2016). Finally, study-ing hemispheric differences in functional correlations, two results emerged: (1) when comparing intra-hemispheric cor-relations, we observed a stronger correlation between the middle temporal gyrus and the fusiform region in the left than in the right hemisphere, and (2) for interhemispheric correlations, we observed a stronger correlation between a right lateral ventral area and the contralateral left IFG than with the ipsilateral right IFG.
This organization of the associative visual regions is all the more remarkable given that vision is very limited in utero, contrary to the other senses which are regularly stimulated through the fetus’ spontaneous movements, internal and external sounds crossing the maternal abdo-men and a tasty and odorant amniotic liquid reflecting the mother’s meals. This early organization of the visual areas at birth, beyond primary areas, dismisses the old but persist-ing idea of a blank slate newborn (Johnson 2011; Elman et al. 1996). Although the human infant appears immature at birth due to his poor motor repertoire, early learning is thus supported by a pre-existing cortical architecture now extensively documented by a decade of functional brain imaging studies in infants (Bartocci et al. 2006; Arichi et al.
2010; Mahmoudzadeh et al. 2013, 2016; Sours et al. 2017; Toulmin et al. 2015).
Our working hypothesis went beyond a mere organization at birth, and we studied whether the functional specificity described at later ages in ventral temporal areas for visual categories such as words, faces, tools and places might partly be based on a pre-existing pattern of functional cor-relation of these regions with the rest of the brain (“biased connectivity” hypothesis) contrasting with the hypothesis of an initially diffuse connectivity only secondarily refined through exposure to a given environment (Johnson 2011; Elman et al. 1996). Anatomically, long-range pathways, in particular those connecting frontal regions with temporal and occipital regions, can be observed in post-mortem brains from the second trimester of gestation on (Takahashi et al.
2011). Even if the tracts are initially not well myelinated, the structural architecture of the human brain set up during the last month of gestation offers the possibility of long-distance synchrony. Previous studies of functional correla-tions in full-term and preterm neonates have indeed reported a set of maps of functionally synchronized regions simi-lar to those observed in adults (Fransson et al. 2007, 2009,
2011; Doria et al. 2010; Smyser et al. 2010, 2011) Here, we explored whether a finer-grained pattern of functional cor-relation was present within ventral visual cortex, correlating with the functional specificity for visual categories observed in adults. We focused here on the medial–lateral axis along which category-selective domains are ordered rather than the posterior–anterior axis which is dependent on the hierarchy of visual analyses within a domain (Tanaka 1996; Arcaro and Livingstone 2017; Vinckier et al. 2007). Although this last axis is probably more difficult to explore because its organization might depend on local computations along the visual hierarchy, Figs. 1 and 4b are indicative of another axis of organization that should be explored in further studies.
Our results indicate that the most lateral regions are more connected to distal associative regions, notably in the frontal lobe, than mesial regions are (compare cluster 3 and ROI 4 (inferior temporal gyrus) to cluster 2 and ROI 1 (lingual
gyrus) in Figs. 1, 2, respectively). The privileged connectiv-ity of such lateral regions residing at the top of the hierarchy of early visual regions may thus explain why the cultural symbols of letters and digits later develop at this location. This aspect of our results corroborate prior findings in older children, which have indicated that anatomical connectivity prior to reading acquisition (at 5 years of age) of ventral visual voxels to temporal and frontal regions was predictive of those voxels which would later exhibit a preference for written words at 8 years of age, once children had learned to read (Saygin et al. 2016). In both cases, connectivity (ana-tomical or functional) precedes functionality, thus support-ing the “biased connectivity” hypothesis for the origins of ventral visual specialization.
By contrast, we found that mesial areas are functionally more connected to sensorimotor areas, Heschl’s gyrus and the posterior insula. This observation could be mediated by direct connections between visual primary areas and auditory and parietal cortices which have been reported in newborn kittens (Innocenti et al. 1988) and adult macaques (Rockland and Ojima 2003). Alternatively, the observed functional correlation between mesial visual regions and other primary cortices (auditory areas and motor sensory areas at the level of the mouth and tongue) could also be driven by thalamic synchrony. Alcauter et al. (2014), study-ing thalamo-cortical connectivity durstudy-ing infancy, reported an overlap of the connectivity between primary visual, audi-tory and sensory-cortices within the same thalamus cluster in neonates, whereas distinct clusters were observed at one year of age. Contrarily, Toulmin et al. (2015) described a more segregated thalamo-cortical connectivity from birth on, especially concerning the primary cortices. We may speculate that an initial stage of multisensory integration might facilitate learning by enhancing responses to co-occurring cues that need to be integrated into higher-level representations. For example, it might explain the observa-tions that neonates visually recognize their mother only if they have been simultaneously exposed to her face and voice (Sai 2005) and that 3-month-olds more robustly identify their mother vs. a stranger’s face if her voice is simultane-ously presented (Burnham 1993).
This mesial-lateral division of functional correlation was similarly observed in the left and right hemispheres (see Fig. 4b) and may correspond to the cyto-architectonic divi-sion highlighted in adults by Weiner et al. (2014, 2016), and to the functional parcellation of activations revealed in older infants looking to faces/objects vs. places images (Deen et al.
2017). In both hemispheres, long-distance functional corre-lation was not limited to within-hemispheric areas, but also recruited contra-lateral heterotopic areas encompassing the inferior parietal and dorsal frontal regions. Although roughly similar, interesting differences were observed between the two hemispheres. Because the VWFA is systematically
lateralized to the hemisphere involved in spoken language processing (Pinel and Dehaene 2009; Pinel et al. 2014; Cai et al. 2010), which is usually in the left hemisphere, we examined the functional correlation at birth between three key regions of the spoken language network and ventral vis-ual areas (Fig. 4c–i). The STG and MTG were strongly con-nected with both the ipsi- and contra-lateral visual regions, but the left MTG was significantly more related with the left lateral extra-striate visual region than its right counterpart. Thus, a stronger path already exists at birth between the spo-ken language network and the future location of the VWFA. It may explain why reading acquisition always recruits this particular location within the left ventral visual cortex (Han-nagan et al. 2015).
The significant trans-hemispheric correlation between the left inferior frontal region and the right lateral ventral visual cortex was more surprising. This cluster is more mesial than the cluster discussed above (~ 24 vs − 38 mm in our mask x-coordinates). Contrary to temporal regions, left and right inferior frontal regions were weakly correlated with ventral voxels in our mask except for this particular relation between this right cluster and the left frontal region. Note that in Fig. 4b, in which we studied the functional correlation of the left and right ventral temporal regions, we also observed a crossed relation yet in the reverse direction between the left temporal region and the right inferior frontal region. Does this functional correlation pattern correspond to a genuine, anatomically validated pathway? In rare patients with a developmental agenesis of the corpus callosum, sig-moid bundles connecting the right frontal region with the left contra-lateral occipital region (and, even more rarely, the converse pattern) have been detected by diffusion-tensor imaging (Bénézit et al. 2015; Tovar-Moll et al. 2006). On one hand, these cases may correspond to aberrant bundles. On the other hand, the absence of a corpus callosum may reveal a smaller tract, otherwise masked by the large corpus callosum. Indeed, in a post-mortem tracing study in a single adult human brain, Di Virgilio and Clarke (1997) were able to identify the degenerating axons in a patient who died a few weeks after a stroke in the right inferior temporal region and reported inter-hemispheric mono-synaptic connections between the right inferior temporal region and the left-hemispheric Wernicke’s and Broca’s areas. Thus, interhemi-spheric connections can be heterotopic and relate widely different regions, in agreement with the present results. Our functional correlation pattern may also be related to a rare study of face processing in infancy by Tzourio-Mazoyer and collaborators (2002). Using positron emission tomography, these authors reported activations in left inferior frontal and left superior temporal cortex, together with right fusiform cortex, when 2-month-olds were looking at faces. Efficient connections between right-hemispheric fusiform face rep-resentations and left-hemispheric language areas might
explain why vocal imitations can be so easily elicited when infants view articulating faces (Bristow et al. 2009; Chen et al. 2004). Future studies in larger groups should reveal whether these observations are anecdotal or reflect robust structural connections present in most of the neonates.
Although we studied a relatively small number of infants here, we observe a clear parcellation of the visual areas that speak to major theories on the origins of functional speciali-zation in the adult human brain. The present results show that the neonate connectivity landscape is very far from a “blooming buzzing confusion” (Embree and James 1983). As such, our results refute theories of an extreme empiricist nature, that assume that the infant brain is largely devoid of initial architecture and that connectivity is initially diffuse, over-abundant and largely isotropic, only becoming refined at a later stage during infancy and childhood through expo-sure to a given environment (Johnson 2011; Elman et al.
1996; Quartz and Sejnowski 1997). Ventral visual cortex is not just “trained” by exposure to objects, faces, houses, letters or digits; on the contrary, it contains functionally spe-cialized areas already present at the dawn of infancy (Deen et al. 2017; Biagi et al. 2015), supported by well-defined fiber tracts. Several previous studies have already shown how at a global scale, an organized functional and anatomi-cal connectivity is present in the infant brain (Fransson et al.
2007, 2009, 2011; Doria et al. 2010; Smyser et al. 2010,
2011; van den Heuvel et al. 2015). Here we show a refined organization within a single region with a gradient of pre-ferred relations with local and distant regions, in accordance with the hypothesis of an early organization (“protomaps”) determined during gestation (Rakic 1988; Mahmoudzadeh et al. 2016; Toulmin et al. 2015). These maps provide neo-nates with a blueprint on which learning capitalizes. This conclusion is in agreement with a recently published study in macaque newborns. Also using functional connectivity, Arcaro and Livingstone (2017) revealed a proto-organization in the macaque visual areas prior to the emergence of selec-tive responses.
While indisputable differences in functional correlation were found between mesial and lateral regions, we did not recover a full adult-like organization. For instance, given the systematic location of word- and number-form areas in adults (VWFA and NFA), with the NFA systematically occupying a location lateral to the VWFA (Shum et al. 2013; Amalric and Dehaene 2016; Hannagan et al. 2015), we could have expected a differential pattern of connectivity, with the most lateral ventral visual voxels projecting preferentially to the inferior parietal lobe which has been implicated in number sense; however, such was not the case. That being said, our group was small merging two different groups of infants and our method was crude in the sense that we did not know precisely which cortical sectors, in our infants, would later become specialized for letters vs. digits, unlike
what had been done in older children (Saygin et al. 2016). Future studies with an improved methodology might reveal that the infant brain contains even finer-grained biases that predate the fine differences between VWFA and NFA seen in adults. Alternatively, it is possible that such patterns of func-tional specialization emerge through exposure and learning and that initially only a rough division between mesial and lateral regions is visible. In line with this idea, Deen et al. (2017) reported clear differences between fMRI activa-tions for faces vs. places, but not for objects vs. faces in 4–6 month-old infants. Similarly, Gomez et al. (2017) underlined the protracted development of the fusiform region sensi-tive to face relasensi-tive to more mesial areas. The acquisition of longitudinal data in the same children from infancy to childhood, although extremely difficult, may be necessary to answer this question.
Acknowledgements Authors would like to thank Elvis Dohmatob, Isa-belle Denghien, François Leroy, Jessica Dubois and Parvaneh Adibpour for their constructive remarks during this work.
References
Alcauter S et al (2014) Development of thalamocortical connectiv-ity during infancy and its cognitive correlations. J Neurosci 34:9067–9075
Amalric M, Dehaene S (2016) Origins of the brain networks for advanced mathematics in expert mathematicians. Proc Natl Acad Sci USA 113(18):4909–4917. https ://doi.org/10.1073/pnas.16032 05113
Arcaro MJ, Livingstone MS (2017) A hierarchical, retinotopic proto-organization of the primate visual system at birth. Elife. https :// doi.org/10.7554/eLife .26196
Arichi T, Moraux A, Melendez A, Doria V, Groppo M, Merchant N, Edwards AD (2010) Somatosensory cortical activation identi-fied by functional MRI in preterm and term infants. Neuroim-age 49(3):2063–2071. https ://doi.org/10.1016/j.neuro image .2009.10.038
Bartocci M, Bergqvist LL, Lagercrantz H, Anand KJ (2006) Pain activates cortical areas in the preterm newborn brain. Pain 122(1–2):109–117
Bénézit A et al (2015) Organising white matter in a brain without corpus callosum fibres. Cortex. https ://doi.org/10.1016/j.corte x.2014.08.022
Biagi L, Crespi SA, Tosetti M, Morrone MC (2015) BOLD response selective to flow-motion in very young infants. PLoS Biol 13(9):e1002260. https ://doi.org/10.1371/journ al.pbio.10022 60 Bristow D et al (2009) Hearing faces: how the infant brain matches the
face it sees with the speech it hears. J Cogn Neurosci 21:905–921 Burnham D (1993) Visual recognition of mother by young infants:
facilitation by speech. Perception 22:1133–1153
Cai Q, Paulignan Y, Brysbaert M, Ibarrola D, Nazir TA (2010) The left ventral occipito-temporal response to words depends on lan-guage lateralization but not on visual familiarity. Cereb Cortex 20(5):1153–1163. https ://doi.org/10.1093/cerco r/bhp17 5 Caspers J, Palomero-Gallagher N, Caspers S, Schleicher A, Amunts K,
Zilles K (2015) Receptor architecture of visual areas in the face and word-form recognition region of the posterior fusiform gyrus. Brain Struct Funct 220(1):205–219. https ://doi.org/10.1007/s0042 9-013-0646-z
Chen X, Striano T, Rakoczy H (2004) Auditory-oral matching behavior in newborns. Dev Sci 7:42–47
Deen B, Richardson H, Dilks DD, Takahashi A, Keil B, Wald LL, Saxe R (2017) Organization of high-level visual cortex in human infants. Nat Commun 8:13995. https ://doi.org/10.1038/ncomm s1399 5
Dehaene S, Cohen L (2011) The unique role of the visual word form area in reading. Trends Cogn Sci 15:254–262
Dehaene S et al (2010) How learning to read changes the cortical net-works for vision and language. Science 330:1359–1364 Di Virgilio G, Clarke S (1997) Direct interhemispheric visual input to
human speech areas. Human Brain Mapp 5:347–354
Doria V, Beckmann CF, Arichi T, Merchant N, Groppo M, Turkheimer FE, Edwards AD et al (2010) Emergence of resting state net-works in the preterm human brain. Proc Natl Acad Sci USA 107(46):20015–20020. https ://doi.org/10.1073/pnas.10079 21107 Dubois J et al (2014) The early development of brain white matter: a review of imaging studies in fetuses, newborns and infants. Neu-roscience 276:48–71
Dubois J, Adibpour P, Poupon C, Hertz-Pannier L, Dehaene-Lambertz G (2016) MRI and M/EEG studies of the white matter develop-ment in human fetuses and infants: review and opinion. Brain Plast 2:49–69
Elman JL, Bates E, Johnson MH, Karmiloff-Smith A, Parisi D, Plunkett K (1996) Rethinking innateness: a connectionist perspective on development. MIT Press, Cambridge
Embree L, James W (1983) The principles of psychology. Philos Phe-nomenol Res 44:124
Fischl B, Rajendran N, Busa E, Augustinack J, Hinds O, Yeo BT, Zilles K (2008) Cortical folding patterns and predicting cytoarchitecture. Cereb Cortex 18(8):1973–1980. https ://doi.org/10.1093/cerco r/ bhm22 5
Fransson P, Skiold B, Horsch S, Nordell A, Blennow M, Lagercrantz H, Aden U (2007) Resting-state networks in the infant brain. Proc Natl Acad Sci USA 104(39):15531–15536
Fransson P, Skiold B, Engstrom M, Hallberg B, Mosskin M, Aden U, Blennow M (2009) Spontaneous brain activity in the new-born brain during natural sleep—an fMRI study in infants new-born at full term. Pediatr Res 66(3):301–305. https ://doi.org/10.1203/ PDR.0b013 e3181 b1bd8 4
Fransson P, Aden U, Blennow M, Lagercrantz H (2011) The func-tional architecture of the infant brain as revealed by resting-state fMRI. Cereb Cortex 21(1):145–154. https ://doi.org/10.1093/cerco r/bhq07 1
Glasser MF, Coalson TS, Robinson EC, Hacker CD, Harwell J, Yacoub E, Van Essen DC (2016) A multi-modal parcellation of human cerebral cortex. Nature 536(7615):171–178. https ://doi. org/10.1038/natur e1893 3
Gomez J, Barnett MA, Natu V, Mezer A, Palomero-Gallagher N, Weiner KS, Grill-Spector K (2017) Microstructural proliferation in human cortex is coupled with the development of face pro-cessing. Science 355(6320):68–71. https ://doi.org/10.1126/scien ce.aag03 11
Hannagan T, Amedi A, Cohen L, Dehaene-Lambertz G, Dehaene S (2015) Origins of the specialization for letters and numbers in ventral occipitotemporal cortex. Trends Cogn Sci 19(7):374–382. https ://doi.org/10.1016/j.tics.2015.05.006
Huth AG, de Heer WA, Griffiths TL, Theunissen FE, Gallant JL (2016) Natural speech reveals the semantic maps that tile human cerebral cortex. Nature 532:453–458
Innocenti GM, Berbel P, Clarke S (1988) Development of projec-tions from auditory to visual areas in the cat. J Comp Neurol 272:242–259
Johnson MH (2011) Interactive specialization: a domain-general frame-work for human functional brain development? Dev Cogn Neuro-sci 1(1):7–21. https ://doi.org/10.1016/j.dcn.2010.07.003
Kabdebon C, Leroy F, Simmonet H, Perrot M, Dubois J, Dehaene-Lambertz G (2014) Anatomical correlations of the international 10–20 sensor placement system in infants. Neuroimage 99:342– 356. https ://doi.org/10.1016/j.neuro image .2014.05.046 Kennedy DN et al (1999) Structural and functional brain asymmetries
in human situs inversus totalis. Neurology 53:1260–1265 Kostović I, Judaš M (2010) The development of the subplate and
thalamocortical connections in the human foetal brain. Acta Paediatr 99:1119–1127
Leroy F et al. (2011) Atlas-free surface reconstruction of the corti-cal grey-white interface in infants. PLoS ONE 6. https ://doi. org/10.1371/journ al.pone.00271 28
Mahmoudzadeh M, Dehaene-Lambertz G, Fournier M, Kongolo G, Goudjil S, Dubois J, Wallois F (2013) Syllabic discrimination in premature human infants prior to complete formation of cortical layers. Proc Natl Acad Sci USA 110(12):4846–4851. https ://doi. org/10.1073/pnas.12122 20110
Mahmoudzadeh M, Wallois F, Kongolo G, Goudjil S, Dehaene-Lambertz G (2016) Functional maps at the onset of auditory inputs in very early preterm human neonates. Cerebral Cortex Marín-Padilla M (2011) Human motor cortex: development and
cyto-architecture. In: The human brain. Springer, Berlin, Heidelberg, pp 11–34. https ://doi.org/10.1007/978-3-642-14724 -1_3 Pinel P, Dehaene S (2009) Beyond hemispheric dominance: brain
regions underlying the joint lateralization of language and arith-metic to the left hemisphere. J Cogn Neurosci 22(1):48–66 Pinel P, Lalanne C, Bourgeron T, Fauchereau F, Poupon C, Artiges
E, Dehaene S (2014) Genetic and environmental influences on the visual word form and fusiform face areas. Cereb Cortex. https ://doi.org/10.1093/cerco r/bhu04 8
Power JD, Schlaggar BL, Petersen SE (2015) Recent progress and outstanding issues in motion correction in resting state fMRI. Neuroimage 105:536–551. https ://doi.org/10.1016/j.neuro image .2014.10.044
Quartz SR, Sejnowski TJ (1997) The neural basis of cognitive devel-opment: a constructivist manifesto. Behav Brain Sci 20(4):537– 556; discussion 556–596
Raichle ME (2015) The restless brain: how intrinsic activity organ-izes brain function. Philos Trans R Soc Lond B Biol Sci, 370(1668). https ://doi.org/10.1098/rstb.2014.0172
Rakic P (1988) Specification of cerebral cortical areas. Science 241(4862):170–176
Rockland KS, Ojima H (2003) Multisensory convergence in cal-carine visual areas in macaque monkey. Int J Psychophysiol 50:19–26
Sai FZ (2005) The role of the mother’s voice in developing mother’s face preference: Evidence for intermodal perception at birth. Infant Child Dev 14:29–50
Saygin ZM, Osher DE, Koldewyn K, Reynolds G, Gabrieli JD, Saxe RR (2012) Anatomical connectivity patterns predict face selectiv-ity in the fusiform gyrus. Nat Neurosci 15(2):321–327. https ://doi. org/10.1038/nn.3001
Saygin ZM, Osher DE, Norton ES, Youssoufian DA, Beach SD, Feather J, Kanwisher N (2016) Connectivity precedes function in the development of the visual word form area. Nat Neurosci 19(9):1250–1255. https ://doi.org/10.1038/nn.4354
Shum J, Hermes D, Foster BL, Dastjerdi M, Rangarajan V, Winawer J, Parvizi J (2013) A brain area for visual numerals. J Neurosci 33(16):6709–6715. https ://doi.org/10.1523/JNEUR OSCI.4558-12.2013
Smith SM, Vidaurre D, Beckmann CF, Glasser MF, Jenkinson M, Miller KL, Van Essen DC (2013) Functional connectomics from resting-state fMRI. Trends Cogn Sci 17(12):666–682. https ://doi. org/10.1016/j.tics.2013.09.016
Smyser CD, Inder TE, Shimony JS, Hill JE, Degnan AJ, Snyder AZ, Neil JJ (2010) Longitudinal analysis of neural network
development in preterm infants. Cereb Cortex 20(12):2852–2862. https ://doi.org/10.1093/cerco r/bhq03 5
Smyser CD, Snyder AZ, Neil JJ (2011) Functional connectivity MRI in infants: exploration of the functional organization of the devel-oping brain. Neuroimage. https ://doi.org/10.1016/j.neuro image .2011.02.073
Sours C, Raghavan P, Foxworthy WA, Meredith MA, El Metwally D, Zhuo J, Gullapalli RP et al (2017) Cortical multisensory con-nectivity is present near birth in humans. Brain Imaging Behav 11(4):1207–1213. https ://doi.org/10.1007/s1168 2-016-9586-6 Striem-Amit E, Cohen L, Dehaene S, Amedi A (2012) Reading with
sounds: sensory substitution selectively activates the visual word form area in the blind. Neuron 76:640–652
Takahashi N, Sakurai T, Davis KL, Buxbaum JD (2011) Linking oligo-dendrocyte and myelin dysfunction to neurocircuitry abnormali-ties in schizophrenia. Prog Neurobiol 93:13–24
Tanaka K (1996) Inferotemporal cortex and object vision. Annu Rev Neurosci 19:109–139
Toulmin H, Beckmann CF, O’Muircheartaigh J, Ball G, Nongena P, Makropoulos A, Edwards AD et al (2015) Specialization and inte-gration of functional thalamocortical connectivity in the human
infant. Proc Natl Acad Sci USA 112(20):6485–6490. https ://doi. org/10.1073/pnas.14226 38112
Tovar-Moll F et al (2006) Neuroplasticity in human callosal dysgen-esis: a diffusion tensor imaging study. Cereb Cortex 17:531–541 van den Heuvel MP, Kersbergen KJ, de Reus MA, Keunen K, Kahn RS,
Groenendaal F, Benders MJ et al (2015) The neonatal connectome during preterm brain development. Cereb Cortex 25(9):3000– 3013. https ://doi.org/10.1093/cerco r/bhu09 5
Vinckier F, Dehaene S, Jobert A, Dubus JP, Sigman M, Cohen L (2007) Hierarchical coding of letter strings in the ventral stream: dissect-ing the inner organization of the visual word-form system. Neuron 55(1):143–156. https ://doi.org/10.1016/j.neuro n.2007.05.031 Weiner KS, Golarai G, Caspers J, Chuapoco MR, Mohlberg H, Zilles
K, Grill-Spector K et al (2014) The mid-fusiform sulcus: a land-mark identifying both cytoarchitectonic and functional divisions of human ventral temporal cortex. Neuroimage 84:453–465. https ://doi.org/10.1016/j.neuro image .2013.08.068
Weiner KS, Barnett MA, Lorenz S, Caspers J, Stigliani A, Amunts K, Grill-Spector K (2016) The cytoarchitecture of domain-specific regions in human high-level visual cortex. Cereb Cortex. https :// doi.org/10.1093/cerco r/bhw36 1