HAL Id: hal-01420948
https://hal.sorbonne-universite.fr/hal-01420948
Submitted on 3 Jan 2017
HAL is a multi-disciplinary open access
archive for the deposit and dissemination of sci-entific research documents, whether they are pub-lished or not. The documents may come from teaching and research institutions in France or abroad, or from public or private research centers.
L’archive ouverte pluridisciplinaire HAL, est destinée au dépôt et à la diffusion de documents scientifiques de niveau recherche, publiés ou non, émanant des établissements d’enseignement et de recherche français ou étrangers, des laboratoires publics ou privés.
2D self-assembly of phenylene-vinylene tectons at the
liquid- HOPG interface: from the concentration and
alkyl chains length effects to host-guest systems
A Six, A Bocheux, Fabrice Charra, F Mathevet, David Kreher, André-Jean
Attias
To cite this version:
A Six, A Bocheux, Fabrice Charra, F Mathevet, David Kreher, et al.. 2D self-assembly of phenylene-vinylene tectons at the liquid- HOPG interface: from the concentration and alkyl chains length effects to host-guest systems. Nanotechnology, Institute of Physics, 2016, 28, pp.025602 �10.1088/1361-6528/28/2/025602�. �hal-01420948�
2D self-assembly of phenylene-vinylene tectons at the
liquid-HOPG interface: from the concentration and alkyl chains
length effects to host-guest systems
A Six1, A Bocheux2, F Charra2, F Mathevet1, D Kreher1* and A-J Attias1*
1 Sorbonne Universités, UPMC Université Paris 06, CNRS UMR 8232, Institut
Parisien de Chimie Moléculaire, Université Pierre et Marie Curie, 4 Place Jussieu, F-75005 Paris, France
2 Service de Physique de l’Etat Condensé, SPEC CEA CNRS Université Paris-Saclay,
CEA Saclay F-91191 Gif-sur-Yvette CEDEX, France E-mail: david.kreher@upmc.fr; andre-jean.attias@upmc.fr
Abstract. Here we report the synthesis and characterization of a series of new
phenylene-vinylene tectons. The study by Scanning Tunneling Microscopy (STM) of their supramolecular self-assembly at the interface between a phenyloctane solution and Highly Oriented Pyrolytic Graphite (HOPG) demonstrates that variation of concentration and alkyl chains length led to the formation of different networks, a compact one and a nanoporous one, with a fine control of the lattice parameters. The study of host-guest properties of the nanoporous network revealed a selectivity toward guest compounds according to their shape and size.
Submitted to: Nanotechnology
1. Introduction
Surface noncovalent nanostructuration by supramolecular self-assembly of organic building blocks (so-called “tectons”) has attracted much interest for several years [1], in view of new potential applications in nanoscience such as molecular electronics [2], photonicsor nanomechanical devices [3].In particular, the formation of a two-dimensional (2D) self-assembled monolayer at the interface between an atomically-flat substrate and a solution of molecular building blocks offers a lot of flexibility and ease of fabrication, together with the possibility of matter exchanges with the liquid environment when working on such surface-confined nanomaterials [4]. In addition to the control of molecule positioning leading to complex nanopatterns, the control of surface properties has also been addressed more recently [5]. In that respect, nanoporous networks with specific properties and presenting selective adsorption and/or surface diffusion of guest molecules were developed [6]. Owing to the host properties of these networks towards organic guests, they allowed for addressing various interesting aspects such as molecular dynamics, selection, recognition, and immobilization, hence leading to functional surfaces [7]. Moreover, these 2D surface-confined nanoporous molecular networks systems can thereby act as templates for the construction of multicomponent 2D hierarchical assemblies [8], most of them giving an isotropic network as obtained from trifunctional molecular building blocks. Among them, we previously developed a strategy to form “on demand” non-covalent self-assemblies with predetermined 2D topologies on sp2-hybridized carbon-based substrates at the liquid-solid interface at room temperature. This method dealt with 2D self-assembly of building blocks designed so as to enable intermolecular interdigitation of alkyl side-chains thus forming noncovalent bonding units (so-called “molecular clips”) [9]. Following this principle, we first designed a family of trifunctional molecules based on a symmetrical tristilbene core substituted by three molecular clips leading consequently to the formation of isotropic honeycomb-like nanoporous monolayers. We
demonstrated its interest as a molecular sieve [10] and determined the thermodynamic conditions of stability of such a nanoporous phase [11,12].
More recently, taking advantage of this novel functional unit, we obtained 2D patterns of well-defined supramolecular polymer-like chains, formed by a bifunctional tecton, which can self-organize into anisotropic nanoporous networks [13]. However, the precise study and description of this latter tecton self-assembly on HOPG was not investigated so far. In particular, its ability to trap or not guest molecules and the influence of parameters such as concentration on the experimental procedure has not been reported yet.
Here, we first report the synthesis of a series of tectons BS-Cn varying in alkyl chains length (figure 1,
n = 10, 12 and 14) (BS-Cn). We then describe the influence of the concentration on the self-assembly
of the tecton BS-C10, in order to find the optimal experimental parameters to favor the formation of an
anisotropic nanoporous network. We demonstrate that by varying the alkyl chain length it is possible to finely tune the anisotropic network lattice parameters. Finally, preliminary results regarding the ability of this nanoporous network to host third-party molecules are presented.
2. Results and discussion
2.1. Synthesis of “bone-shape” tectons BS-Cn
All the BS-Cn tectons were prepared as shown in figure 1, by adapting a procedure described in the
literature [15]. First, compounds Clip-Cn were synthesized with various alkyl chain length (n = 10, 12,
and 14). Then, two equivalents of Clip-Cn underwent a Wittig-Horner reaction with one equivalent of
2,5-dimethylterephthalaldehyde (dialdehyde on figure 1) obtained itself from the commercially available 1,4-bis(chloromethyl)-2,5-dimethylbenzene.
The structures of target tectons BS-Cn were confirmed by proton and carbon NMR spectroscopies,
elemental analysis, and mass spectrometry (see appendix A).
2.2. Photophysical properties in solution of tectons BS-Cn
Absorption and emission spectra in solution of compounds Clip-Cn, triPPV, and BS-Cn have been
recorded. In absorption, all the spectra of tectons BS-Cn have the same behavior and a typical
UV-visible spectrum is reported in figure 2 (compound BS-C10). It is almost the superposition of the
spectra of the corresponding Clip-C10 (λmax = 308 nm) and the central stilbenes model compound
TriPPV (λmax = 353 nm) (figure 2).
Figure 2. Absorption spectra of BS-C10, Clip-C10 and TriPPV compounds.
In addition, molar extinction coefficients () have been determined by varying the solution concentrations (table 1).
Table 1. Molar extinction coefficients (ε) of BS-C10, Clip-C10 and TriPPV compounds.
Compound Molar extinction coefficient at 324 nm
BS-C10 111545 L.mol-1.cm-1
Clip-C10 39284 L.mol-1.cm-1
TriPPV 26792 L.mol-1.cm-1
The sum of TriPPV molar extinction coefficient and twice that of the Clip-C10 gives
ε = 105360 L.mol-1.cm-1, a value very close to the BS-C
10 molar extinction coefficient:
ε = 111545 L.mol-1.cm-1. The difference between these two values can be explained by an increased
conjugation in the BS-C10 compound, compared to Clip-C10 and TriPPV compounds. This result
Similar results have been obtained for BS-C12 and BS-C14 molecules demonstrating that there is no
influence of the side alkyl chains length on the spectral shape. Only the molar extinction coefficient at 324 nm increases with the side alkyl chain length, to reach around ε = 123918 L.mol-1.cm-1 and
ε = 135064 L.mol-1.cm-1 respectively for BS-C
12 and BS-C14. Such small increase with longer alkyl
chains could be due to the increased mass of the alkyl chains, which could dump the skeleton fluctuations a little more efficiently.
Emission spectra have also been recorded, by exciting the compounds at their absorption maximum, e.g. 324 nm for BS-Cn molecule, 308 nm for corresponding Clip-Cn, and 353 nm for TriPPV
molecule. All the spectra are very similar, whatever the side alkyl chain length. As an example with
BS-C10 (figure 3), emission maxima at 419 nm and 442 nm are observed. This structure is typical of
central TriPPV emission, even though the spectra are switched toward higher wavelengths, due to an increased conjugation.
Figure 3. Emission spectra for BS-C10, Clip-C10 and TriPPV compounds.
Excitation spectra have also been recorded for each compound at their emission maxima: in all cases, they were similar to the absorption spectra of the corresponding molecules. Therefore, in each case, there is only one specie at the excited state. To conclude, side alkyl chains variation does not affect photophysical properties of BS-Cn compounds.
2.3. Self-assembly properties of BS-C10at the liquid-solid interface: effect of the concentration
First, the self-assembly properties of compound BS-C10 were studied by STM at the solution-solid
interface at different concentrations. The solutions of BS-C10 were deposited just after cleaving the
substrate and were then imaged by STM at room temperature. Through this procedure, the growth is controlled by the kinetics rather than the thermodynamics and it thus leads to the formation of various types of networks and not only that which is thermodynamically the most stable. This coexistence is explained by an initial nucleation-growth phenomenon, followed by a kinetic blockade [12]. The
hypothesis is that during nucleation, molecules nucleate on the HOPG surface according to the “molecular clip” process and it is at this moment that the configuration is determined. Actually, for 3.10-4 mol.L-1 solutions, many different networks were obtained with surface densities ranging from
0.13 molecule/nm² (nanoporous network) to 0.21 molecule/nm² (most compact network). For a concentration reduced to 1.10-4 mol.L-1 solutions the majority network is the nanoporous one (figure 4
(a) and (b)).
Figure 4. STM images and molecular model of adsorption on HOPG at the HOPG-phenyloctane interface. a),b) STM images of BS-C10 self-assembly for a deposition at a) 3.10-4 mol.L-1 (Circle: the most compact network, Rectangle: nanoporous network) (V = -930 mV, I = 40 pA, 100x100 nm²), b) 1.10-4 mol.L-1 (nanoporous network only) (V = -870 mV,
I = 30 pA, 20x20 nm²), c) Molecular models of one unit cell of the monolayer adsorbed on HOPG for the nanoporous network.
On the STM images the conjugated moieties appear much brighter than the aliphatic parts. The lattice parameters of the nanoporous network shown on figure 4 are a = 3.9 nm, b = 2.1 nm and α = 65° and the density is 7.4 nm² per molecule, which is higher than the density of the compact network (5.6 nm² per molecule). Moreover, previous work has led to a reproducible procedure leading to the nanoporous network [12], therefore we will focus on the study of this network only. Similar concentration-dependent self-assemblies have been reported in literature [14], and an expression of the critical concentration and a procedure leading to the thermodynamically stable lattice have been derived for the self-assembly of trifunctional tristilbenes (TSB) [12].
2.4. Self-assembly properties of BS-Cn at the liquid-solid interface: influence of alkyl chain length
In the case of the nanoporous network, the exclusive formation of which is well-controlled [12], we investigated the possibility to finely tune the distance between cavities, as it constitutes a prerequisite toward the control and exploitation of such anisotropic network. To achieve that, first we developed and synthesized several building blocks with various peripheral alkyl chain lengths, more precisely bifunctionnal “bone-shape tectons” BS-C10, BS-C12 and BS-C14 which are presented on figure 5.
Second, we managed to control and realize a series of nanoporous networks by self-assembly of these tectons on HOPG.
b
c
a
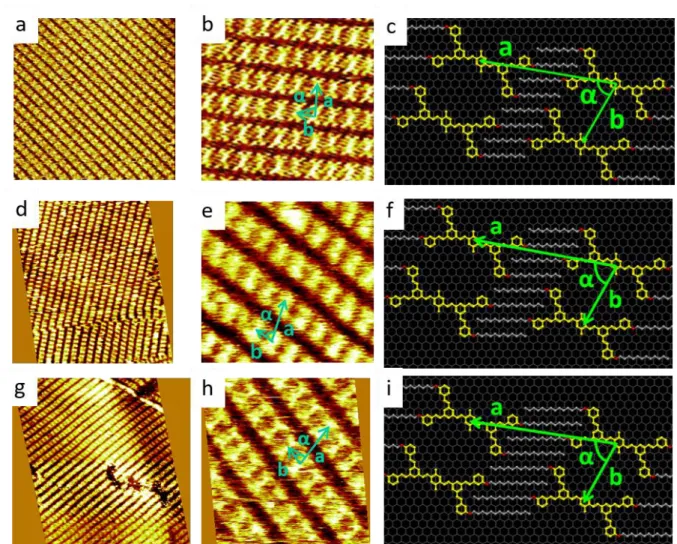
Figure 5. STM images and molecular model of adsorption on HOPG at the HOPG-phenyloctane interface. a) Large-scale STM image of a monolayer domain of compound BS-C10 (V = -650 mV, I = 16 pA, 255x255 nm²) ; b) Close-up STM image of BS-C10 self-assembly (V = -870 mV, I = 30 pA, 20x20 nm²), c) Molecular model associated to compound BS-C10, d) Large-scale STM image of a monolayer domain of compound BS-C12 (V = -1150 mV, I = 11 pA, 70x70 nm²) ; e) Close-up STM image of BS-C12 self-assembly (V = -1150 mV, I = 12 pA, 22x22 nm²), f) Molecular model associated to compound BS-C12, g) Large-scale STM image of a monolayer domain of compound BS-C14 (V = -650 mV, I = 11 pA, 80x80 nm²) ; h) Close-up STM image of BS-C14 self-assembly (V = -680 mV, I = 12 pA, 15x15 nm²), i) Molecular model associated to compound BS-C14.
In these conditions, the self-assemblies obtained are stable and self-replicated on distances of at least 100 nm. Moreover, this nanoporous network is obtained with the same self-assembly pattern for each alkyl chain length, as seen on models. Only the lattice parameter “a”, i.e. the longitudinal distance between cavities, increases with the alkyl chain length, whereas the cavity size remains the same, as evidenced with the lattice parameters reported in table 2. As a consequence, obtaining the nanoporous network remains as easy for longer alkyl side chains, in contrast with TSB35 for which the cavity size increases with alkyl chains which restrains the stability domain for the nanoporous network. Therefore, the “molecular clip” function is effective for alkyl chain length ranging at least from ten to fourteen carbons. Note that, since the vector a is nearly parallel to the alkyl chains (i.e. the 110 direction of HOPG), the variation of the angle α is not significant and the decrease of the angle predicted by the theory is lower than the uncertainty on the measurements.
Table 2. Analysis of molecular lattice evolution with increasing alkyl chain lengths from C10H21 to C14H29. The reconstruction with respect to HOPG is given.
Alkyl chain length Reconstruction Lattice parameter a Lattice parameter b Angle α Theory (measure) Theory (measure) Theory (measure)
10 carbons ( 0 8 17 −3) 4.0 nm (3.9) 2.0 nm (2.1) 70° (65) 12 carbons ( 0 8 18 −3) 4.2 nm (4.1) 2.0 nm (2.1) 69° (69) 14 carbons ( 0 8 19 −3) 4.4 nm (4.3) 2.0 nm (2.1) 68° (70)
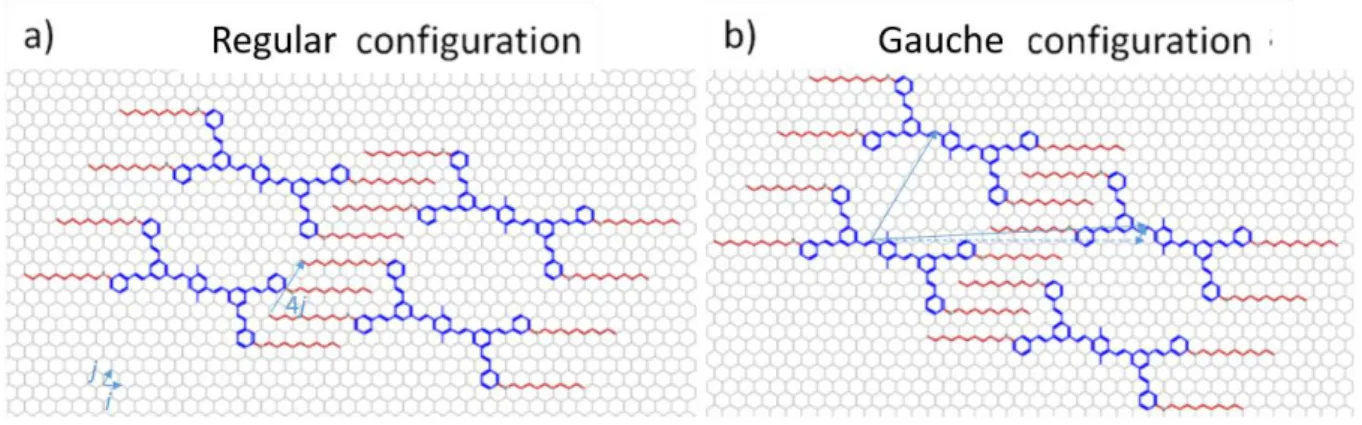
In addition, a closer look on some STM images reveals a slight variant in alkyl chain packings. More specifically two configurations can be discerned. The first one can be called “regular” (figure 6 (a)), which is the template generally proposed, and a second one corresponding to a reconstruction (12 + 𝑛/2 +1) with respect to HOPG (n is the alkyl chain length) is named “gauche” (figure 6 (b)), 0 8 which is encountered sometimes. It corresponds to an inversion of the clips, that is to a shift by a vector (0 4) of an entire lamella. This shift being parallel to a lattice vector (b = (0 8)) this variant preserves the unit cell area and the surface molecular density. The most visible change is the decrease of the lattice angle , e.g. from 70° (gauche) to 57° (regular) in the case n = 10.
Figure 6. Molecular model of nanoporous network in both configurations: a) Regular, b) Gauche.
On most of the STM images, the regular configuration is observed,. Experimentally the gauche configuration appears as a defect. More precisely, it appears at the boundaries of domains with translational mismatch accidentally fitting the gauche configuration. At places where such a domain boundary crosses a lamella, a local breaking of the periodicity along the lamella is formed as shown on figure 7.
Figure 7. STM image of compound BS-C14 with both configurations observed: gauche (left rectangle), regular (right rectangle) and local defect resulting from a domain boundary crossing the lamella (white circle).
2.5. Co-assembly structures of BS-C10 and guest molecules on HOPG surface
Nanoporous networks are likely to host third-party compounds in their cavities. We investigated the ability of a BS-C10 self-assembly to trap guest molecules. Three guest candidates have been chosen,
benzo[rst]pentaphene (BPP), pentacene and hexabenzocoronene (HBC) (figure 8), the dimensions of which fitting the cavity size. For BPP and pentacene, even one hour after their addition, only few successful insertions have been observed by STM (figures 8 (a) and (b)): this could be explained by the fact that they are either too small to be adsorbed inside the cavities or too small again to give a very easy STM signature enabling its differentiation from the host self-assembly (their motion inside the cavity leading to a blurred poorly contrasted STM response). Indeed, the low interaction surface between the molecules and the substrate, which induce a low adsorption enthalpy, and their high entropy in the solution could increase their desorption, compared to bigger molecules. The same deposition protocol has been carried out at various concentrations and led to the same conclusion. Oppositely, HBC remained sequestered inside the network and all the cavities appeared filled after a waiting time of one hour, as seen on figure 8 (c). This can be explained by the fact that the shape and size of HBC are closer to the shape and size of the cavities.
Figure 8. a) Molecular structures of the guest molecules BPP, pentacene and HBC, b-d) STM images of the self-assembled monolayer of the matrix formed through self-assembly of BS-C10 on HOPG, after deposition of b) BPP (V = -970 mV, I = 25 pA, 24x24 nm²), c) pentacene (V = -1150 mV, I = 40 pA, 40x40 nm²), or d) HBC (V = -1425 mV, I = 25 pA, 79x79 nm²).
Red circles highlight guest insertion.
At lower concentrations these molecules can still be trapped again in the cavities, but not all of the latter are filled (sub-stoichiometry conditions). Then, guest molecules dynamics appears as a blinking of the corresponding spots in successive images. In most cases the appearance of a spot in one cavity is concomitant with the disappearance of another one in its neighborhood, as illustrated on figure 9. The circle shows a disappearing HBC molecule and the arrow shows uniformly distributed stripes parallel to the fast-scan direction. Those stripes correspond to occupation changes occurring in the course of cavity imaging and evidence that the guest molecules are moving when working in such sub-stoichiometry conditions.
Figure 9. Two successive STM images which show an occupation state change during the imaging (arrow) and the disappearance of a HBC molecule (circle). V = -1000 mV, I = 30 pA, 25x25 nm².
In addition, this behavior was observed whatever the length of the peripheral alkoxy chains, which means that in this case (contrary to our precedent studies with trifunctional TSB entities) the chain length parameter don’t lead to a modification of the cavities and thus of the molecular sieve properties: increasing the chain length is just a way we can play with in order to tune in a control way the distance between these cavities.
3. Conclusion
In summary, a series of new phenylene-vinylene tectons substituted with peripheral alkyl chains with various lengths have been synthesized. The supramolecular self-assembly properties at liquid/solid interface have been investigated by STM. Changes in concentration led to the formation of various networks, several compact ones and two nanoporous ones. Fine tuning of the peripheral alkyl chain length led as well to the variation of the distance between cavities on one axis only. This distance varies step-by-step, while preserving the cavity size and the detailed features of the HOPG-induced alkyl chain interdigitation. Finally, the nanoporous network can be used as a host-guest system with selectivity toward guest molecules depending on their sizes and shapes, therefore it could be used as a molecular sieve.
Acknowledgments
We gratefully acknowledge financial support by CNano Ile de France. The authors also thank J Li Master student for technical assistance with UV and fluorescence spectra.
Appendix A
Tetrahydrofurane (THF), Toluene and Dichloromethane (CH2Cl2) used in synthesis come from a
fountain. All other solvents were purchased from commercial suppliers and used without further purification. Chromatographic separations were carried out with a flash chromatographic instrument (Grace, Reveleris) and with silica gel (40 μm, Grace). Structural information of materials was obtained by 1H NMR and 13C spectroscopy. Spectra were recorded at 200 MHz, proton chemical shifts (δ) are
reported in ppm and referenced to the residual solvent signal: CDCl3 (7.26). 13C NMR spectra were
The BS-Cn tectons have been synthesized and purified by adapting a general procedure for the
Wittig-Hörner reaction described in the literature [15], using the corresponding “molecular clip” compounds
Clip-Cn. To a solution of Clip-Cn (2.2eq) in dry THF under argon atmosphere was added tBuOK
(1.5eq). The mixture was stirred for 15mn at 0°C then the dialdehyde (1eq) was added. The reaction was stirred for 2h at 0°C. The resulting mixture was quenched with water and concentrated to remove the THF, then extracted with CH2Cl2 and washed with brine. The combined organic layers were dried
over MgSO4, filtered and concentrated under vacuum. The residue was purified by flash
chromatography (1:1 CH2Cl2:PE) to yield the pure target material BS-Cn.
3,3',3'',3'''-((1E,1'E,1''E,1'''E)-(((1E,1'E)-(2,5-dimethyl-1,4-phenylene)bis(ethene-2,1-diyl))bis(benzene-5,3,1-triyl))tetrakis(ethene-2,1-diyl))tetrakis((decyloxy)benzene) (BS-C10)
Yellow solid. Yield: 200mg, 27%. Rf = 0.59 (1:1 CH2Cl2:PE). 1H NMR (250 MHz, CD3Cl) δ: 0.87 (t,
J = 6.7 Hz, 12H, H27), 1.28 (m, 56H, H20-26), 1.78 (m, 8H, H19), 2.49 (s, 6H, H28), 3.98 (t, J = 6.5 Hz,
8H, H18), 6.81 (m, 4H, H15), 7.10 (d, J = 16.0 Hz, 2H, H5), 7.11 (m, 8H, H10,11), 7.17 (s, 8H, H13,17),
7.27 (t, J = 7.7 Hz, 4H, H14), 7.42 (d, J = 16.0 Hz, 2H, H4), 7.50 (s, 2H, H2), 7.56 (m, 6H, H7,9). 13C
NMR (63 MHz, CDCl3) δ: 14.3 (C27), 19.8 (C28), 22.8, 26.3, 29.5, 29.6, 29.7, 32.1 (C19-26), 68.1 (C18),
112.5, 114.2 (C15,17), 119.3, 124.3, 126.7, 127.4, 128.7, 129.4, 129.8 (C4-5,7,9-11,13-14), 133.8, 135.6,
138.1, 138.5, 138.7 (C1,3,6,8,12), 159.6 (C16). UV maximum absorption in CH3Cl at 20°C λabs =
324nm. UV molar absorption coefficient at 324nm ε = 111545 L.mol−1.cm−1. Fluorescence spectroscopy emission in CH3Cl at 20°C λem = 419nm, excitation λexc = 324nm. Anal. calcd for
3,3',3'',3'''-((1E,1'E,1''E,1'''E)-(((1E,1'E)-(2,5-dimethyl-1,4-phenylene)bis(ethene-2,1-diyl))bis(benzene-5,3,1-triyl))tetrakis(ethene-2,1-diyl))tetrakis((dodecyloxy)benzene) (BS-C12)
Yellow solid. Yield: 59mg, 18%. Rf = 0.60 (1:1 CH2Cl2:PE). 1H NMR (200MHz, CDCl3) δ: 0.87 (t,
J = 6.7 Hz, 12H, H29), 1.28 (m, 72H, H20-28), 1.81 (m, 8H, H19), 2.50 (s, 6H, H30), 4.00 (t, J = 6.5 Hz, 8H, H18), 6.83 (m, 4H, H15), 7.11 (d, J = 16.0 Hz, 2H, H5), 7.15 (m, 8H, H10-11), 7.18 (s, 8H, H13,17), 7.28 (t, J = 7.7 Hz, 4H, H14), 7.44 (d, J = 16.0 Hz, 2H, H4), 7.48 (s, 2H, H2), 7.55 (m, 6H, H7,9). 13C NMR (200MHz, CDCl 3) δ: 14.2 (C29), 19.7 (C30), 22.7, 26.1, 29.4, 29.5, 29.6, 29.6, 29.7, 29.7, 32.2, 31.9 (C19-28), 68.0 (C18), 112.4, 114.1 (C15,17), 119.2, 123.8, 124.3, 126.7, 127.4, 128.7, 129.4, 129.8 (C4-5,7,9-11,13-14), 133.8, 135.6, 138.1, 138.5, 138.7 (C1,3,6,8,12), 159.6 (C16). UV maximum
absorption in CH3Cl at 20°C λabs = 324nm. UV molar absorption coefficient at 324nm ε = 123918
L.mol−1.cm−1. Fluorescence spectroscopy emission in CH3Cl at 20°C λem = 419nm, excitation
λexc = 324nm. Anal. calcd for C104H142O4: C, 85.78; H, 9.83; O, 4.39; found: C, 85.63; H, 9.79; O,
4.28.
Yellow solid. Yield: 135mg, 22%. Rf = 0.57 (1:1 CH2Cl2:PE). 1H NMR (200MHz, CDCl3) δ: 0.88 (t, J = 6.7 Hz, 12H, H31), 1.27 (m, 88H, H20-30), 1.82 (m, 8H, H19), 2.52 (s, 6H, H32), 4.02 (t, J = 6.5 Hz, 8H, H18), 6.84 (m, 4H, H15), 7.11 (d, J = 16.0 Hz, 2H, H5), 7.15 (m, 8H, H10,11), 7.18 (s, 8H, H13,17), 7.28 (t, J = 7.7 Hz, 4H, H14), 7.44 (d, J = 16.0 Hz, 2H, H4), 7.48 (s, 2H, H2), 7.56 (m, 6H, H7,9). 13C NMR (200MHz, CDCl 3) δ: 14.2 (C31), 19.7 (C32), 22.7, 26.1, 29.4, 29.5, 29.6, 29.6, 29.7, 29.7, 32.2, 31.9 (C19-30), 68.0 (C18), 112.4, 114.1 (C15,17), 119.2, 123.8, 124.3, 126.7, 127.4, 128.7, 129.4, 129.8 (C4,5,7,9,10,11,13,14), 133.8, 135.6, 138.1, 138.5, 138.7 (C1,3,6,8,12), 159.6 (C16). UV maximum
absorption in CH3Cl at 20°C λabs = 324nm. UV molar absorption coefficient at 324nm ε = 135064
L.mol−1.cm−1. Fluorescence spectroscopy emission in CH3Cl at 20°C λem = 419nm, excitation
λexc = 324nm. Anal. calcd for C112H158O4: C, 85.77; H, 10.15; O, 4.08; found: C, 85.63; H, 10.19;
O, 4.18.
Appendix B
UV-visible spectra were recorded with a ThermoFisher evolution UV/Vis spectrophotometer coupled with a thermal controller. Cells were in quartz with two faces (thickness = 1cm).
UV-Visible spectra have been recorded in CHCl3 at room temperature, for concentrations between
10-6 mol.L-1 and 10-5 mol.L-1. Molar extinction coefficients have been calculated thanks to
Beer-Lambert law: A = l.ε.c. This law is applicable in the concentration range used, so we can consider that there are neither dimerisations nor oligomerisations of the molecules.
Emission and excitation spectra have been recorded in CHCl3 at room temperature, for concentrations
ranging from 10-6 mol.L-1 to 10-5 mol.L-1. Emission spectra have been obtained by exciting the
compounds at their absorption maximum, e.g. 324 nm for BS-Cn molecules, 308 nm for Clip-Cn
molecules, and 353 nm for TriPPV molecule.
Appendix C
STM images were acquired at room temperature with a homemade digital system. The fast-scan axis was kept perpendicular to the sample slope. All images were obtained in the height mode, i.e. with real-time current regulation. Images acquired simultaneously in both fast scan directions were systematically recorded and compared. All images were corrected for the drift of the instrument, by combining two successive images with downward and upward slow-scan directions, using especially developed image cross-correlation software called Imago. The solvent for the self-assembly was 1-phenyloctane (98%, Aldrich), which is well suited for in situ scanning tunneling microscopy (STM) because of its low conductivity, slow volatility and high dielectric rigidity and also avoids the coadsorption often observed with linear alkanes. The substrate was a freshly cleaved HOPG (SPI, grade 2) and the tips were mechanically formed from a 250mm Pt/Ir wire (Pt80Ir20, Goodfellow). The freshly-cleaved sample and tip quality was systematically checked by STM observation of HOPG atomic network prior to molecular deposition. The monolayers were formed by immersing the STM junction in a droplet (ca. 5 μL) of a solution immediately after observation of HOPG atomic network. Imaging was then carried out in situ at the liquid-solid interface.
References
[1] Barth J V, Costantini G and Kern K 2005 Nature 437 671 [2] Wang Q H and Hersam M C 2009 Nature Chemistry 1 206
[3] Urdampilleta M, Klyatskaya S, Cleuziou J-P, Ruben M and Wernsdorfer W 2011 Nature Materials
10 502
[4] Mazur U and Hipps K W 2015 Chem. Commun. 51 4737
[5] De Feyter S and De Schryver F C 2003 Chemical Society Reviews 32 139
Bellec A, Arrigoni C, Douillard L, Fiorini-Debuisschert C, Mathevet F, Kreher D, Attias A J and Charra F 2014 Nanotechnology 25 435604
[6] Kudernac T, Lei S, Elemans J A A W and De Feyter S 2009 Chemical Society Reviews 38 402 Bonifazi D, Mohnani S and Llanes-Pallas A 2009 Chem. Eur. J. 15 7004
Tahara K, Katayama K, Blunt MO, Iritani K, De Feyter S and Tobe Y 2014 ACSNano 8 8 8683 Lee S-L, Fang Y, Velpula G, Cometto F-P, Lingenfelder M, Mullen K, Mali K-S and De Feyter S 2015 ACSNano 9 11608
Bilbao N, Destoop I, De Feyter S and Gonzalez-Rodriguez D 2016 Angew. Chem. Int. Ed. 55 659 Tahara K, Nakatyani K, Iritani K, De Feyter S and Tobe Y 2016 ACSNano 10 2113
Liu C, Zhang W, Zeng Q and Lei S 2016 Chem. Eur. J. 22 6768
[7] Pan G-B, Liu J-M, Zhang H-M, Wan L-J, Zheng Q-Y and Bai C-L 2003 Angew. Chem. Int. Ed. 42 2747
El Garah M, Ciesielski A, Marets N, Bulach V, Hosseini MW and Samorì P 2014 Chem. Commun. 50 12250
Palma C-A, Ciesielsski A, Oner MA, Schaeffer G, Lehn J-M, Barth JV and Samorì P 2015 Chem.
Commun. 51 1797
El Garah M, Marets N, Mauro M, Aliprandi A, Bonacchi S, De Cola L, Ciesielski A, Bulach V, Hosseini MW and Samorì P 2015 J. Am. Chem. Soc. 137 8450
[8] Ciesielski A, Palma C-A, Bonini M and Samorì P 2010 Advanced Materials 22 3506
[9] Bléger D, Kreher D, Mathevet F, Attias A-J, Schull G, Huard A, Douillard L, Fiorini-Debuischert C and Charra F 2007 Angew. Chem. Int. Ed. 46 7404
[10] Schull G, Douillard L, Fiorini-Debuisschert C, Charra F, Mathevet F, Kreher D and Attias A-J 2006 Advanced Materials 18 2954
[11] Bellec A, Arrigoni C, Schull G, Douillard L, Fiorini-Debuisschert C, Mathevet F, Kreher D, Attias A-J and Charra F 2011 The Journal of Chemical Physics 134 124702
[12] Arrigoni C, Schull G, Bléger D, Douillard L, Fiorini-Debuisschert C, Mathevet F, Kreher D, Attias A-J and Charra F 2010 The Journal of Physical Chemistry Letters 1 190
[13] Bléger D, Kreher D, Mathevet F, Attias A-J, Arfaoui I, Metgé G, Douillard L, Fiorini-Debuisschert C and Charra F 2008 Angewandte Chemie 120 8540
[14] Ciesielski A, Szabelski P J, Rżysko W, Cadeddu A, Cook T R, Stang P J, Samorì P 2013 J. Am.
Chem. Soc. 135 6942
Lee S-L, Adisoejoso J, Fang Y, Tahara K, Tobe Y, Mali K S and De Feyter S 2015 Nanoscale 7 5344 El Garah M, Dianat A, Cadeddu A, Gutierrez R, Cecchini M, Cook TR, Ciesielski A, Stang PJ, Cuniberti G and Samorì P 2016 Small 12 343