HAL Id: inserm-00874399
https://www.hal.inserm.fr/inserm-00874399
Submitted on 17 Oct 2013HAL is a multi-disciplinary open access archive for the deposit and dissemination of sci-entific research documents, whether they are pub-lished or not. The documents may come from teaching and research institutions in France or abroad, or from public or private research centers.
L’archive ouverte pluridisciplinaire HAL, est destinée au dépôt et à la diffusion de documents scientifiques de niveau recherche, publiés ou non, émanant des établissements d’enseignement et de recherche français ou étrangers, des laboratoires publics ou privés.
Near-infrared optical imaging of nucleic acid
nanocarriers in vivo.
Claire Rome, Julien Gravier, Marie Morille, Gilles Divita, Anne-Laure
Bolcato-Bellemin, Véronique Josserand, Jean-Luc Coll
To cite this version:
Claire Rome, Julien Gravier, Marie Morille, Gilles Divita, Anne-Laure Bolcato-Bellemin, et al.. Near-infrared optical imaging of nucleic acid nanocarriers in vivo.. Nanotechnology for Nucleic Acid Deliv-ery, 948, Humana Press, pp.49-65, 2013, �10.1007/978-1-62703-140-0_5�. �inserm-00874399�
Near-Infrared optical imaging of nucleic acid nanocarriers in vivo
Claire Rome1,2, Julien Gravier3; Marie Morille4;, Gilles Divita5, Anne-Laure Bolcato-Bellemin6, Véronique Josserand1,2; Jean-Luc Coll1,2,*
1
INSERM U823, Institut Albert Bonniot, Grenoble, France
2
Université Joseph Fourier, BP 53, Grenoble, France
3
CEA Grenoble/LETI-DTBS, Grenoble, France
4
INSERM U646 ; Angers, France
5
CNRS UMR5237, Montpellier, France
6
Polyplus-transfection, Illkirch, France
* Corresponding Author: , Dr Coll Jean-Luc INSERM U823, Equipe 5 Institut Albert Bonniot, 38 706 Grenoble, France
Phone: +33 4 76 54 95 53 / Fax: +33 4 76 54 94 13 E-mail: Jean-Luc.Coll@ujf-grenoble.fr
Emails :
Claire Rome : claire.rome@ujf-grenoble.fr
Julien Gravier : julien.gravier@freesbee.fr
Marie Morille : morillemarie@yahoo.fr
Véronique Josserand : veronique.josserand@ujf-grenoble.fr
Gilles Divita : gilles.divita@crbm.cnrs.fr
Summary
Non-invasive, real time optical imaging methods are particularly well suited for the in vivo follow up of the distribution of nucleic acids nanocarriers, their dissociation and finally the resulting gene expression or inhibition. Indeed, most small animal imaging devices are performing bioluminescence and fluorescence measurements without moving the animal, allowing a simple, rapid and cost effective method of investigation of several parameters at a time, in longitudinal experiments that can last for days or weeks.
Here we propose to help the reader choosing adapted near-infrared (NIR) fluorophores or pairs of fluorophores for FRET assays, reporter genes as well as nanocarriers for in vivo gene and siRNA delivery. In addition, we present the labeling methods of these macromolecules, and of their payload and the protocols to detect them using bioluminescence and NIR fluorescence imaging in mice.
1. INTRODUCTION
Optical imaging based on 2D Fluorescence reflectance (FRI), is a non-invasive method, that allows to follow molecules injected into a mouse in real time, at a good spatial (nm to mm range) and temporal resolution (µ to msec), a high sensibility (femto- to pico-molar range) and from whole-body down to the subcellular scale. However, the information that can be obtained through absorbing biological tissues is strongly depth-weighted and depends on the thickness and optical properties of the tissues to be imaged. This method is thus only semi-quantitative. The tissues are less absorbing in a near-infrared (NIR) spectral window ranging from 650 nm to 900 nm and it is thus important to use adapted fluorophores whenever possible.
The recent description of increasing amounts of organic or in-organic NIR fluorochromes contributed to the development of optical imaging methods for the investigation of deep tissues (1, 2). These fluorophores, or combination of them can be used for labeling molecules of interest and will accelerate significantly the preclinical studies. By separately labeling the vector and the nucleic acid using an adapted pair of fluorophores, we can provide direct information on the distribution of the intact particle, its capacity to release the nucleic acid, the subcellular distribution of each component, and finally a direct measure of the reporter gene expression.
Several reporter genes of the luciferase family are adapted to bioluminescence imaging in vivo (BLI), while the very commonly used fluorescent proteins like Green Fluorescent proteins (GFP), RedFP, etc…can be used in FRI but are more adapted for in vitro applications because they emit in the visible spectrum. ß-galactosidase, an enzyme encoded by the lacZ gene of Escherichia coli can also be followed in vivo using NIR substrates like DDAOG (3).
Thus by combining FRI and BLI, we can obtain multiple information especially well suited for the evaluation of the biodistribution of lipid nanocapsules(LNC) or polyethilenimine (PEI) polyplexes, or cell penetrating peptides (CPPs), three non-viral systems well suited for the delivery of DNA and siRNA in mice (4-6).
2. MATERIALS
2.1. Fluorophores
Commercially available fluorophores are declined in a wide variety of wavelength, hydrophilicity and reactive moieties. Since the choice of absorption and emission wavelength mainly depends on the available apparatus, we will here focus on selection criteria for hydrophobicity/hydrophilicity and chemical reactivity (Table 1).
2.2 FRET, dark dye quenching, and wavelength selection
Even with the right fluorophore, fluorescence imaging will only reveal the molecule location independently of the nanoparticle. Förster resonance energy transfer (FRET) occurs between a donor and a receptor dye within the range of the Förster radius, typically ranging from 5 to 10 nm depending on the pair considered. This property makes it a useful phenomenon to gather information in the nanometric range through spectroscopic methods. When donor and acceptor dyes are in close vicinity, excitation of the former can be passed to the latter via non-radiative pathways. Macroscopically, FRET is attested by a decrease of the donor fluorescence and an increase of the acceptor emission upon irradiation of the donor. It is therefore possible to know whether or not dyes are still encapsulated within a nanoparticle by studying its emission spectrum: upon excitation of the donor, free dyes will display normal donor fluorescence while nanoparticles will display strong acceptor emission.
Dark dye quenching is also based on FRET, except that the acceptor dye is non-fluorescent. In this case, the energy transfer result in a decrease of the donor emission while the acceptor remains non-fluorescent. This results in a simple on/off switch in fluorescence, where emission is recovered when the dyes are released from the nanoparticle. Though this method
provide a more straightforward mean to track where and when the dyes escapes from the nanoparticle, it also means that (contrary to classical FRET method) circulating nanoparticles are non-fluorescent and can not be tracked through spectroscopic method unless a third dye is introduced.
To occur, FRET requires that spectral absorption of the acceptor overlaps sufficiently with the donor emission. Though precise calculations are required, this generally means that absorption peaks of the donor and acceptor should be spaced by approximately 50 to 100 nm. On the one hand, with less than 50 nm, spectral overlap between donor and acceptor emissions might hinder FRET measurements. On the other hand, spectral differences of more than 100 nm will often result in low a spectral overlap, therefore very short Förster radii. The following table provides a few examples of near-infrared dyes (fluorescent or dark dyes) along with possible FRET pairing (Table 2 and 3).
2.3 Nucleic acids
Two types of nucleic acids will be presented: DNA or/and siRNA. In each case, high-quality plasmids or small interfering RNA (siRNA) preparations should be used.
Plasmid reporter genes
To visualize the efficiency and biodistribution of in vivo gene delivery, different reporter genes can be used. For in vivo bioluminescence, plasmids encoding for firefly luciferase are very commonly used (pgWIZ-luciferase (GENLANTIS, San Diego, USA) by example). The bacterial ß-galactosidase gene expression can be detected in vivo using near infrared fluorescent imaging (NIR). For plasmid DNA, OD260/280 ratio should be greater than 1.8. It is
best to use DNA prepared in water, free of salt, RNAs, proteins or endotoxins. Tracking of small interfering RNA (siRNA)
Concerning siRNA (21–23 nucleotides duplex RNA with symmetric 2 nucleotides 3’ overhangs), we use high-quality desalted siRNA (PAGE or HPLC purified). As for primer/probe design, a G/C content around 50% is usually selected and oligonucleotides with three or more of any purinenucleotide in a row are avoided. Prediction algorithms provide some guidance for siRNA sequence selection (Note 1).
2.4 DiD-DNA-lipid nanocapsules (LNC) compounds
Lipoplexes compounds
Cationic lipids used are DOTAP (1,2-DiOleoyl-3-TrimethylAmmonium-Propane) and DOPE (1,2-DiOleylsn-glycero-3-PhosphoEthanolamine) (Avanti Polar Lipids, Inc, Alabaster, USA). Plasmid DNA (pDNA) is a pgWIZ-luciferase (GENLANTIS, San Diego, USA) amplified and research grade purified by GENEART (Regensburg, Germany).
LNC components
DNA LNCs are composed of an oily core of Labrafac® WL 1349 (caprylic-capric acid triglycerides, European Pharmacopeia, IVth, 2002) and oleic Plurol® (Polyglyceryl-6 dioleate) which were kindly provided by Gatefosse S.A. (Saint-Priest, France) and a corona of tension active Solutol® HS-15 (30% of free polyethylene glycol 660 and 70% of polyethylene glycol 660 hydroxystearate (HS-PEG) European Pharmacopeia, IVth, 2002) which was a gift from BASF (Ludwigshafen, Germany) (7).
DiD fluorochrome (1,10-dioctadecyl-3,3,30,30-tetramethylindodicarbocyanine perchlorate (DiD, em. = 644 nm; exc. = 665 nm) was provided by Invitrogen (Carlsbad, CA, USA). DiD labeled DNA LNCs are purified thanks to PD10 Sephadex columns (Amersham Biosciences Europe, Orsay, France) containing Sephadex™ G-25. A second purification and a concentration step are then performed by ultrafiltration thanks to Millipore Amicon® Ultra-15 centrifugal filter devices (Millipore, St Quentin-Yvelines, France).
Post inserted polymer
1,2-DiStearoyl-sn-glycero-3-PhosphoEthanolamine-N-[methoxy(polyethyleneglycol)-2000] (DSPE-mPEG2000) (Mean Molecular Weight (MMW) = 2805 g/mol) was provided from Avanti Polar Lipids (Inc, Alabaster, USA)
Special equipment
Size, polydispersity index, or surface charge (zeta potential) of DiD labeled DNA LNCs, post inserted or not, can be measured using a Malvern Zetasizer® (Nano Series DTS 1060, Malvern Instruments S.A., Worcestershire, UK).
2.5 Fluorescent labeling of peptide
For purification of CADY by semi-preparative reverse-phase high performance liquid chromatography (RP-HPLC), we use C18 column Interchrom UP5 WOD/25M Uptisphere 300 5 ODB, 250 mm x 21.2 mm. For labeling, we use maleimide dyes (maleimide-FITC or Maleimide-Alexa) from Molecular Probes. Inc (Invitrogen, Carlsbad, CA, USA).
2.6 PEI DNA complex
Polyethylenimine (PEI) is a linear cationic polymer widely used in vivo for delivery of many nucleic acid including plasmid DNA, oligonucleotides and siRNA without triggering an immune response. PEI is widely used in animal models and also in the clinic. For in vivo transfection, we use “in jetPEI™” (Polyplus-transfection, Ilkirch, France). “In vivo-jetPEI™” mediates efficient nucleic acid delivery in a wide range of tissues, using various delivery routes: intravenous (IV), intraperitoneal (IP), intratumoral, intracardiac, sub-cutaneous, topical, intrathecal, intra-cerebral, etc. Upon IV administration, high levels of nucleic acid delivery are achieved in the lung. Other organs such as heart, spleen, pancreas and liver are also transfected following IV injection. In addition “in vivo-jetPEI™” is an
effective carrier for local gene delivery such as intratumoral or topical application on the skin. More recently “in vivo-jetPEI™” has become a powerful tool for in vivo RNA interference experiments.
2.7 Animals
All animal experiments are conducted in agreement with the “Principles of laboratory animal care” (NIH publication No. 86-23, revised 1985) and approved by the local ethical Committee. Optical imaging experiments are conducted on female 6-8 weeks old nude mice.
2.8 D-Luciferin
Powder (Promega, Charbonnières, France) is dissolved in DPBS without CaCl2 and MgCl2at
100 mg/mL.The solution is sterilized by filtrationacross a 0.2 µm membrane and stored at -80°Csheltered from light.
2.9 DDAOG
9H-(1,3-dichloro-9,9-dimethylacridin-2-one-7-yl) ß-D-galactopyranoside (Molecular Probes, Invitrogen, Carlsbad, CA, USA) is dissolved in DMSO/PBS v/v to get 5 mg/mL.
2.10 Fluorescence imaging set-up
Illumination is made by 633 or 660 nm Light Emitting Diodes (LEDs) equipped with interference filters. Fluorescence images are acquired with a back-thinned CCD cooled (-70°C) Camera (ORCAII-BT-512G, Hamamatsu Photonics, Massy, France) filtered either by a colored glass long pass filter RG 665plus a band pass filter 680 (MellesGriot, Voisins le Bretonneux, France)when illuminating at 633 nm or a high pass filter RG 9 (Schott, Clichy, France) when illuminating at 660 nm.
2.11 Common Reagents
PBS pH 7.4 (Gibco, Invitrogen, Carlsbad, CA, USA), Ultra-Pure DNAse–RNAse-free Sterile Water (GIBCO; Invitrogen, Carlsbad, CA, USA), dimethyl sulfoxide (DMSO) (Sigma; Saint-Quentin Fallavier, France), chloroform (Sigma, Saint-Saint-Quentin Fallavier, France)
3. METHODS
3.1
Nanocarriers
labeling
and
Nucleic
acids
and
nanocarrierscomplexation
3.1.1 DiD labelled DNA LNC formulation
Lipid nanocapsules (LNCs) were developed according to a solvent-free process based on an emulsion phase inversion. DNA complexed with cationic lipids i.e. DOTAP/DOPE, was encapsulated into LNCs leading to the formation of stable nanocarriers (DNA LNCs) with a size inferior to 130nm. Amphiphilic and flexible poly (ethylene glycol) (PEG) polymer coating [PEG lipid derivative (DSPE-mPEG2000)] at different concentrations was selected to make DNA LNCs stealthy..
a) Preparation of the aqueous phase (containing DNA and cationic liposome complexes) 1. Dissolve DOTAP dioleoyl-3-trimethylammonium-propane) and DOPE
(1,2-dioleyl-sn-glycero-3-phosphoethanolamine) in chloroform at a concentration of 20 mg/ml. To obtain a final concentration in positive charge of 25mM [+] in 3ml, mix DOTAP/DOPE at a molar ration of (1:1), i.e add 2.617 ml of DOTAP solution (20 mg/ml) to 2.790 ml of DOPE (20 mg/ml) in a 25 ml balloon and assure a homogeneous mixture of lipids (Note 2).
2. Once the lipids are thoroughly mixed in the organic solvent, remove the organic solvent by rotary evaporation at room temperature, under vacuum to yield a thin lipid film without solvent residues.
3. Hydrate the dry lipid film by adding 3ml of purifying deionized water (18 MΩ.cm, MilliQ), and incubate over night at 4°C.
4. After this incubation step, vigorously mix the lipid suspension by vortexing. The thus-formed multilamellar vesicles are sonicated 20 min in a bath sonicator to allow the formation of small unilamellar vesicles.
5. To form lipoplexes, mix DNA and cationic liposomes at a charge ratio (±) of 5 in 150 mM NaCl. Briefly, add 660 µg of pDNA in a solution containing 300 mM NaCl to obtain a final concentration of 660 µg of pDNA in 400µl NaCl. Then add the same volume of previously synthesized cationic liposomes (400 µl). Mix thoroughly with a pipette, and let incubate 30 min before use.
b) Preparation of the lipid phase (containing DiD stained Labrafac®)
1. Dissolve 5 mg of DiD in 1 ml of Acetone, to obtain a final solution at 5 mg/ml in a scintillation bottle. Gently mix 2h.
2. Mix 100 mg of 5 mg/ml DiD solution with 900 mg of Labrafac®. Mix 15 min, and let the bottle open under a cell culture hood during 2-3 hours to allow the acetone evaporation. Control the whole acetone evaporation by weighting before and after evaporation.
c) Preparation of DiD labeled DNA LNCs
1. Weigh all the LNC components in a scintillation bottle. First weigh 58 mg of Solutol HS-15®(Note 3), then add 38.7 mg of oleic Plurol®, 96.16 mg of DiD stained lipophilic Labrafac® (cf.2.b)), 14.1 mg of NaCl and 800 µl of aqueous solution containing lipoplexes (cf. 2.a))
2. Mix all the components together under magnetic stirring and heat to 60°C thanks to a hot plate stirrer.
3. Six temperature heat-cooling cycles were applied between 20 and 60°C, still under magnetic stirring, to obtain a phase inversion from an oil-in-water to a water-in-oil emulsion. Change in color can be observed in a zone between these two emulsions. In
this region, the system appeared translucent with blue glints, which is representative of microemulsions, this zone was called the phase inversion area (7). After these temperature cycles, in the phase inversion zone, the mixture underwent a fast cooling-dilution process with 500µl of cold water (4°C), leading to the formation of DiD labeled DNA LNCs in water (Note 5).
4. Control the size, polydispersity and surface charge (zeta potential) of DiD labeled DNA LNCs thanks to dynamic light scattering (DLS, size) and electrophoretic mobility (zeta potential) (ex. Malvern Zetasizer®, Nano Series DTS 1060, Malvern Instruments S.A., Worcestershire, UK).
5. Control the encapsulation properties of DiD labeled DNA LNCs thanks to electrophoresis migration of broken (Triton X100) or intact DNA LNCs in an agarose gel (1%) containing ethidium bromide (method developed in (5, 8, 9)).
d) Purification of DiD labeled DNA LNCs
1. Equilibrate a PD10 Sephadex® column with approximately 25 ml elution buffer. 2. Add DiD labeled DNA LNC suspension of a total volume of 2.5 ml per column. If the
volume is less than 2.5 ml, then add buffer until the total volume of 2.5 ml is achieved. 3. Elute with buffer and collect the flow-through. The fractions containing DiD labeled DNA LNCs were collected. After this purification step, the LNC concentration was low; a concentration step was therefore required.
4. Add 12 ml maximum of collected fraction of DiD labeled DNA LNCs in a Amicon® Ultra-15 centrifugal filter devices.
5. Centrifuge 30 min, 4000 rpm at room temperature.
6. The thus concentrated DiD Labeled DNA LNCs are collected from the filter unit sample reservoir, while the ultrafiltrate is collected in the provided centrifuge tube.
7. The DiD labeled DNA LNC concentration was fixed at 150 mg/ml. Place the DiD labeled DNA LNC suspension collected in the upper part to this reference concentration and to obtain a final NaCl concentration of 150 mM.
8. Control the size, polydispersity and surface charge (zeta potential) of DiD labeled DNA LNCs thanks to dynamic light scattering (DLS, size) and electrophoretic mobility (zeta potential) (ex. Malvern Zetasizer®, Nano Series DTS 1060, Malvern Instruments S.A., Worcestershire, UK).
9. Control the encapsulation properties of DiD labeled DNA LNCs thanks to electrophoresis migration of broken (Triton X100) or intact DNA LNCs in an agarose gel (1%) containing ethidium bromide (method developed in (5, 9)).
e) Formulation of PEGylated DiD labeled DNA LNCs
1. Weigh DSPE-mPEG2000 as a function of the wanted concentration in a vial. As an
example, add 28.5 mg of DSPE-mPEG2000 for a final molar concentration of 10 mM.
2. Add 1 ml of DiD labeled DNA LNCs in this vial. Mix by vortexing.
3. Co-incubate polymers and purified DiD labeled DNA LNCs in a vial placed in a water bath, 4h at 30°C.
4. After this co-incubation step, mix by vortexing and put the tube in an ice bath.
3.1.2 Procedure for fluorescent labeling of cell penetrating peptides
Cell-penetrating peptides (CPP) constitute promising tools for non-invasive cellular import of siRNA. CPP-based strategies have been successfully applied for ex vivo and in vivo delivery of therapeutic siRNA molecules. Recently, a new peptide-based system, CADY, has been described for efficient delivery of siRNA. CADY is a secondary amphiphatic peptide able to form stable non-covalent complexes with siRNA and to improve their cellular uptake. It is possible to modify this peptide for following CADY/siRNA complexes in vivo.
The protocol described below outline (a) A general procedure suitable for conjugation of most thiol-reactive probes (iodoacetamides, maleimides) to peptides and (b) different procedures for peptide purifications.
1. CADY (20-residues: Ac-GLWRALWRLLRSLWRLLWRA-cya; MW: 2653 Da) was synthesized by solid-phase peptide synthesis using AEDI-expensin resin with (fluorenylmethoxy)-carbonyl (Fmoc) continuous (Pionner, Applied Biosystems, Foster city, CA) as described previously (10). CADY was purified by semi-preparative reverse-phase high performance liquid chromatography (RP-HPLC) and identified by electrospray mass spectrometry and amino acid analysis (10). The peptide is acetylated at its N-terminus and carried a cysteamide group at its C-terminus.
2. Take the vial containing the peptide powder out of the freezer and equilibrate for 30 min at room temperature without opening the vial. Resuspend CADY at a final concentration of 2 mg/ml (774.5 µM) in ultra pure water RNAse, DNAse free and 2% DMSO. CADY powder should be first solubilized directly in DMSO, then add calculated volume of water to reach the 2 mg/ml final CADY concentration and 2% DMSO.
3. Mix gently by tapping the tube and sonicate the CADY solution for 10 min in the water bath sonicator. Sonication is essential to prevent peptide aggregation and finalize solubilization.
4. CADY (1 mM) was dissolved in Phosphate Buffer Saline (pH 7.5) at room temperature. At this pH, the C-terminal thiol group is nucleophilic and reacts exclusively with the fluorescent reagent. In contrast peptide amines are protonated and therefore not reactive.
5. Prepare a 10 mM stock solution of the reactive dye (FITC or Maleimide-Alexa from Molecular Probes. Inc., Invitrogen, Carlsbad, CA, USA) in DMSO and protect stock solutions from light by wrapping the tubes with an aluminum foil. Maleimide stock solutions can be stored at -20°C for a month.
6. A step of reduction of disulfide bonds in the peptide can be added to the protocol using a 10-fold molar excess of TCEP reducing agent. For labeling with iodoacetamides or maleimides, TCEP can be kept in the solution during conjugation. 7. Add 20 fold molar excess of the reactive dye drop wise to the peptide solution.
8. Allow the reaction to proceed for 2 hours at room temperature or overnight at 4°C. For more detail see The Handbook: A Guide to Fluorescent Probes and Labeling Technologies (probes.invitrogen.com).
9. Upon completion of the reaction with the protein, an excess of glutathione, and 2-ß-mercaptoethanol, is present, ensuring that no reactive species are formed during the purification step.
10. Fluorescently labeled peptide can be separate on a Sephadex G-25 columngel filtration column equilibrated in phosphate buffer saline (NAP-10 column). However, for in cellular or in vivo imaging, Fluorescently labeled peptides were further purified by RP-HPLC using a C18 reverse-phase HPLC column (Interchrom UP5 HDO/25M Modulo-cart Uptisphere, 250 mm x 10 mm) and identified by electrospray mass spectrometry.
where Ax = the absorbance value of the dye at the absorption maximum wavelength. And e= molar extinction coefficient of the dye or reagent at the absorption maximum wavelength (according to The Handbook: A Guide to Fluorescent Probes and Labeling Technologies).
The procedure for CADY-siRNA complex formation constitutes a major factor in the success and efficiency of CADY technology and should be followed carefully. It was well described previously in (11).
3.1.3 Synthesis of PEI FluoR (Figure 1)
A solution (1.5 mL) of borate buffer (0.2 M) was added into a vial containing 50 mg of PEI and the pH was adjusted to 8 by adding a solution of NaOH (10 M). 7.0 mg of tetramethylrhodamineisothiocyanate (RITC) was dissolved in 200 L of DMSO and the resulting solution was slowly added to the prior solution (under agitation). The reaction mixture was stirred overnight at room temperature with exclusion of light. TLC (CH2Cl2/MeOH; 80/20) of the reaction mixture was then carried to evaluate the presence of
starting material RITC. If required, the product maybe purified by column chromatography (Sephadex G25 PD10) in water. 34 mg of PEI FluoR was isolated (75% yield) and was then dissolved in 1.8mL of water. The exact concentration of the PEI FluoR solution may be determined by proton NMR and colorimetric measurement at 493 nm (ca. 150 mM).
The preparation of the PEI FluoR/nucleic acid complexes should be performed in a laminar flow hood using the sterile 10 % glucose solution.
1. Dilute the nucleic acid (plasmid DNA or siRNA; Table 4) using the 10% glucose stock solution in ddH2O and sterile water to prepare a solution of ½ the injection volume of
2. Dilute the PE-FluoR reagent using the 10% glucose stock solution and sterile water to prepare a solution of ½ the injection volume of 5% glucose. Vortex gently and spin down.
3. Add the diluted PEI FluoR to the diluted nucleic acid all at once, vortex gently, spin down.
4. Incubate for 15 min at room temperature. From this time point, the complexes are stable 2 h at room temperature and for 24 h if stored at 4ºC.
5. Perform injections into animals using complexes equilibrated at room temperature (Table 4).
6. The biodistribution of PEI-FluoR can be followed as early as 1 to 4 h following injection, using fluorescence of the whole animal or slices of fixed tissues depending on the target organ.
7. Monitor gene expression as required at the appropriate time point (1–96 h after the last injection) depending on the mode of injection and the targeted organ.
With the current formulation and delivery approaches employed today, silencing can be achieved in several tissues and cell types, most notably through direct delivery of siRNA to the back of the eye, to the central nervous system, and to lung epithelial cells, and through systemic delivery of siRNA to hepatocytes and tumor cells.
3.2
Pharmacokinetic study by in vivo Fluorescence Reflectance imaging
1. Mice are anesthetized (isoflurane/oxygen 3.5% for induction and 1.5% thereafter) and placed on a warm holder (37°C) for intravenous injection of the fluorescent mixture (100 to 200 µL) via the tail vein.
2. Mice are immediately placed in dorsal position in the fluorescence imaging set up and a real time imaging sequence is acquired over 15 min. Afterwards anesthesia is suspended till the next imaging time point.
3. One, 2, 3, 5 and 24 hours after injection fluorescence and bright field images are acquired in 4 mouse-body positions (ventral, dorsal and laterals).
4. At 24 hours post injection mice are anesthetized and some blood is sampled by heart puncture. Mice are then sacrificed and the principal organs are removed (brain, heart, lungs, liver, spleen, pancreas, stomach, guts, kidneys, suprarenal glands, ovaries, uterus, muscle, fat, skin, lymph nodes).
5. Blood is centrifuged (20 min, 2300 g, 4°C) and 200 µL of plasma are sampled for fluorescence imaging with the isolated organs.
6. Each fluorescence image can be superimposed on the bright field image for better location of the fluorescent signal. Semi-quantitative data are obtained from the fluorescence images by drawing regions of interest (ROI) on the area to be quantified. The results are expressed as a number of Relative Light Units per pixel for a 100 ms exposure time (RLU/pix/100 ms).
3.3
Luc gene transfer follow up by in vivo Bioluminescence imaging
In vivo luciferase expression is monitored by bioluminescence 24 hours after luciferase gene transfer in vivo.
1. The day of experimentation the solution is diluted to 10 mg/mL in DPBS without CaCl2 and MgCl2 and is kept sheltered from light.
2. Vigil mice are injected intraperitonealy with D-Luciferin (150 mg/kg) just before anesthesia (isoflurane 4% for induction and 1.5% thereafter).
3. Five minutes after Luciferin injection, bioluminescence images are acquired with the IVIS Kinetic (Caliper) (Figure 2).
4. Semi-quantitative data are obtained from the bioluminescence images by using the Living image software (Caliper). Regions of interest (ROI) are drawn on the areas to be quantified. The results are expressed as a number of photons per pixel per second (ph/pix/s).
5. After imaging, mice are sacrificed and the principal organs are removed for in vitro Luciferase activity measurement (brain, heart, lungs, liver, spleen, pancreas, stomach, guts, kidneys, suprarenal glands, ovaries, uterus, muscle, fat, skin, lymph nodes).
3.4
LacZ gene transfer follow up by in vivo Fluorescence Reflectance
imaging
In vivo ß-Gal expression is monitored by NIR fluorescence 24 hours after LacZ gene transfer in vivo.
1. Mice are anesthetized (isoflurane/oxygen 3.5% for induction and 1.5% thereafter) and placed on a warm mat (37°C) for intracardiac injection of DDAOG (100 µL).
2. Twenty minutes after injection, fluorescence and bright field images are acquired for 4 mouse-body positions (ventral, dorsal and laterals) (Figure 3).
3. Just after imaging, mice are sacrificed and the principal organs are removed (brain, heart, lungs, liver, spleen, pancreas, stomach, guts, kidneys, suprarenal glands, ovaries, uterus, muscle, fat, skin, lymph nodes) for ex vivo fluorescence imaging. 4. Each fluorescence image can be superimposed on the bright field image for better
location of the fluorescent signal. Semi-quantitative data are obtained from the fluorescence images by drawing regions of interest (ROI) on the area to be quantified.
The results are expressed as a number of Relative Light Units per pixel for a 100 ms exposure time (RLU/pix/100 ms).
3.5
In vitro enzymatic assays on isolated organs
Luciferase or ß-Gal activities are also assayed in vitro using the Luciferase Assay System or the ß-Gal Assay System (Promega) as recommended by the manufacturer.
1. Tissues are extracted and cut into small pieces with a razor blade. Fragments are mixed thoroughly in 1 mL lysis buffer.
2. After 15 minutes incubation, the samples are frozen at -20°C.
3. The following day, the samples are thawed and brought to room temperature before centrifugation (2 min, 15 600 g).
4. The supernatants are sampled for proteins content measurements using the DC-comp Bio-Rad assay (Bio-Rad, Marnes-la-Coquette, France) and luciferase or ß-Gal activity measurements.
In vitro luciferase activity assay
10 µL of the extract are mixed with 100 µL of luciferase assay substrate and the luciferase activity is measured for 10 s on a photoluminometer (Bethold, Thoiry, France). The luciferase activities are calculated as a number of Reference Light Unit per 10 s per mg of protein (RLU/10s/mg). As a reference, using purified firefly luciferase under the same experimental conditions, we determined that 2 ng of this enzyme produced 108 RLU/10 s.
50 µL of the extract are added to 50 µL of 2x Assay buffer and incubated 30 min at 37°C. The reaction is stopped by adding 150 µL of sodium carbonate 1 M and the absorbance is read at 420 nm on a spectrophotometer (Bio-Rad, Marnes-la-Coquette, France). The ß-Gal activities are expressed as a number of milliUnits (mU) per mg of protein (One mU corresponding to the hydrolyze of 1 nmol of substrate per minute at pH 7.5 and 37°C). As a reference, using purified ß-Gal under the same experimental conditions, we determined that 2 ng of this enzyme produced 0.654 mU.
4. Notes
Note 1: Several sequence prediction websites exist for the determination of the sequence of a siRNA. They are often associated with companies that sell siRNA.
• Whitehead siRNA Selection Web Server
http://jura.wi.mit.edu/bioc/siRNAext – Developed and hosted by the Whitehead Institute, this website is somewhat more complex, giving a large number of possible duplexes along with their thermodynamic properties, etc. An off-target search can be done for each duplex, within the site but in a separate step. (siRNA Selection Server: an automated siRNA oligonucleotide prediction server Bingbing Yuan, Robert Latek, Markus Hossbach, Thomas Tuschl and Fran Lewitter).
Rosetta siRNA Design Algorithm
Sigma-Aldrich has entered into an exclusive partnership with Rosetta Inpharmatics Sequence design : http://www.sigmaaldrich.com/life-science/your-favorite-gene-search.html. The Rosetta siRNA Design Algorithm utilizes Position-Specific Scoring Matrices (PSSM) and knowledge of the all-important siRNA seed region to predict the most effective and specific siRNA sequences for your target gene of interest.
• BIOPREDsi algorithm
Developed by the Novartis Institutes for BioMedical Research, this site features a very simple input and output, with only the essential information given (input is a gene Accession number or gene sequence, output is a user-defined number of optimized siRNA sequences: https://www.qiagen.com/geneglobe/default.aspx).
siRNA targeting gene, and a derived siRNAharbouring two mismatches, must be used for each target gene as control. A BLAST search is carried out to ensure that the chosen sequence does not target unwanted genes.
Fluorescent dyes are widely used to label at the 3' end or 5’ end of the sense strand siRNA for tracking of siRNA. Fluorescently labeled siRNA could be synthesized by different company according to the choosing sequences: Sigma (http://www.sigmaaldrich.com/life-science/) Dharmacon (www.dharmacon.com), Qiagen (https://www.qiagen.com), Ambion (http://www.invitrogen.com/site/us/en/home/brands/ambion.html), Eurogentec (https://secure.eurogentec.com).
Note 2: Add a plastic paraffin film at the bottom of balloon, and gently shake avoiding the solvent to evaporate or to enter in contact with the plasti cparaffin film.
Note 3: The stock solution of DiD in acetone (5mg/ml) can be stored at -20°C, in a well closed scintillation bottle.
Note 4: As Solutol HS-15® is viscous, this compound is weighted first, and could be added to the bottle with a syringe.
Note 5: This protocol led to a final volume of 1.479 ml of DiD labeled DNA LNCs. When a higher volume is needed, the proportions of the different LNC compounds have to be multiplied.
Note 6: the final concentration of nucleic acid is the injection volume should not exceed 0.5 µg/µl
Tables and figures : Target Fluorophore type Graftin g group Reactive group pH range Examples
Specific molecule Reactive
Primary amine (-NH2)
Isothicyanate ~ 9 FITC, RITC Succinimidyl ester ~ 8 Alexafluor®, Cydyes Thiol (-SH) Maleimide ~ 7 Alexafluor®, Fluoprobes® Whole nanoparticle Hydrophobic
None – non covalent interaction Any pH compatible with nanoparticle and fluorophore DiI, DiD
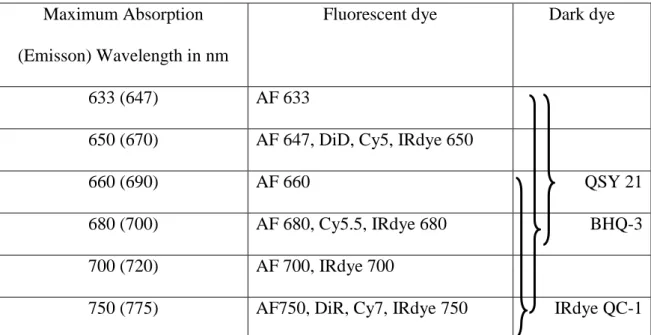
Maximum Absorption (Emisson) Wavelength in nm
Fluorescent dye Dark dye
633 (647) AF 633
650 (670) AF 647, DiD, Cy5, IRdye 650
660 (690) AF 660 QSY 21
680 (700) AF 680, Cy5.5, IRdye 680 BHQ-3
700 (720) AF 700, IRdye 700
750 (775) AF750, DiR, Cy7, IRdye 750 IRdye QC-1
Table 2: Fluorescent dyes grouped depending on their spectral properties and possible dark dye quenchers.
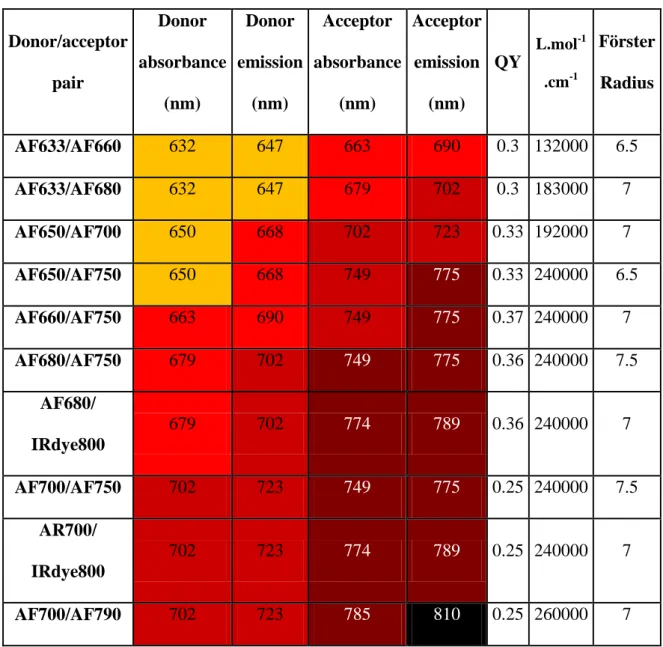
Donor/acceptor pair Donor absorbance (nm) Donor emission (nm) Acceptor absorbance (nm) Acceptor emission (nm) QY L.mol-1 .cm-1 Förster Radius AF633/AF660 632 647 663 690 0.3 132000 6.5 AF633/AF680 632 647 679 702 0.3 183000 7 AF650/AF700 650 668 702 723 0.33 192000 7 AF650/AF750 650 668 749 775 0.33 240000 6.5 AF660/AF750 663 690 749 775 0.37 240000 7 AF680/AF750 679 702 749 775 0.36 240000 7.5 AF680/ IRdye800 679 702 774 789 0.36 240000 7 AF700/AF750 702 723 749 775 0.25 240000 7.5 AR700/ IRdye800 702 723 774 789 0.25 240000 7 AF700/AF790 702 723 785 810 0.25 260000 7
Table 3: Possible near infrared FRET pairs with absorptions and emissions maxima, donor fluorescence quantum yield, acceptor molar extinction coefficient (providers’ data) and estimated Förster radius (using providers’ data in water or PBS).
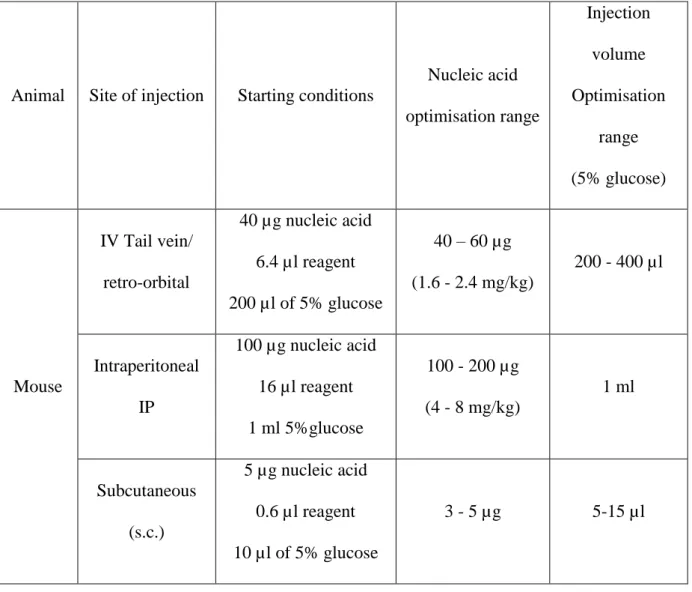
Animal Site of injection Starting conditions Nucleic acid optimisation range Injection volume Optimisation range (5% glucose) Mouse IV Tail vein/ retro-orbital 40 µg nucleic acid 6.4 µl reagent 200 µl of 5% glucose 40 – 60 µg (1.6 - 2.4 mg/kg) 200 - 400 µl Intraperitoneal IP 100 µg nucleic acid 16 µl reagent 1 ml 5%glucose 100 - 200 µg (4 - 8 mg/kg) 1 ml Subcutaneous (s.c.) 5 µg nucleic acid 0.6 µl reagent 10 µl of 5% glucose 3 - 5 µg 5-15 µl
Table 4: Recommended conditions for common administration routes in mice (http://www.polyplus-transfection.com/in-vivo-reagents-therapeutics/dna-sirna-delivery-in-vivo-jetpei/)
Figure 2: In vivolung bioluminescence imaging. Mice were injected intravenously with 50
µg (200 µl) of luciferase plasmid DNA combined with “In vivo-PEI”. Whole_body Bioluminescence imaging was performed 24 h after DNA-PEI injection and 10 min after Luciferine ip injection.
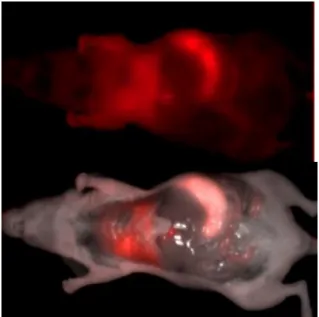
Figure 3: In vivo lung NIR fluorescence imaging. Mice were injected with 50 µg (200 µl)
of ß-galactosidase plasmid DNA combined with “In vivo-PEI”. Whole-body fluorescence imaging was performed 24 h after complex DNA-PEI injection and after i.c. injection of DDAOG.
Acknowledgments
The authors thank C Passirani, JP Benoit (INSERM Angers), I Texier-Nogues (CEA-LETI, Grenoble), P Erbacher (Polyplus transfection, Illkirch, France) for their help and advices. This work was funded by the Agence Nationale pour la Recherche (ANR pNANO, CALIF, ANR BiotecS GLIOTHERAP, ANR CES NANOBIOTOX) and the INCA (PLbio Poro-Combo ; PLBio Biosensimag).
References:
1. Weissleder, R. (2001) Nat Biotechnol 19, 316-7.
2. Weissleder, R., and Ntziachristos, V. (2003) Nat Med 9, 123-8.
3. Josserand, V., Texier-Nogues, I., Huber, P., Favrot, M. C., and Coll, J. L. (2007) Gene Ther 14, 1587-93.
4. Lin, E. H., Keramidas, M., Rome, C., Chiu, W. T., Wu, C. W., Coll, J. L., and Deng, W. P. (2011) Biomaterials 32, 1978-85.
5. Morille, M., Montier, T., Legras, P., Carmoy, N., Brodin, P., Pitard, B., Benoit, J. P., and Passirani, C. (2010) Biomaterials 31, 321-9.
6. Coll, J. L., Chollet, P., Brambilla, E., Desplanques, D., Behr, J. P., and Favrot, M. (1999) Hum Gene Ther 10, 1659-66.
7. Heurtault, B., Saulnier, P., Pech, B., Proust, J. E., and Benoit, J. P. (2002) Pharm Res 19, 875-80.
8. Morille, M., Passirani, C., Letrou-Bonneval, E., Benoit, J. P., and Pitard, B. (2009) Int J Pharm 379, 293-300.
9. Morille, M., Passirani, C., Dufort, S., Bastiat, G., Pitard, B., Coll, J. L., and Benoit, J. P. (2011) Biomaterials 32, 2327-33.
10. Crombez, L., Aldrian-Herrada, G., Konate, K., Nguyen, Q. N., McMaster, G. K., Brasseur, R., Heitz, F., and Divita, G. (2009) Mol Ther 17, 95-103.