HAL Id: hal-02628799
https://hal.inrae.fr/hal-02628799
Submitted on 26 May 2020
HAL is a multi-disciplinary open access
archive for the deposit and dissemination of
sci-entific research documents, whether they are
pub-lished or not. The documents may come from
teaching and research institutions in France or
abroad, or from public or private research centers.
L’archive ouverte pluridisciplinaire HAL, est
destinée au dépôt et à la diffusion de documents
scientifiques de niveau recherche, publiés ou non,
émanant des établissements d’enseignement et de
recherche français ou étrangers, des laboratoires
publics ou privés.
Distributed under a Creative Commons Attribution| 4.0 International License
complex genome of sugarcane
Olivier Garsmeur, Gaëtan Droc, Rudie Antonise, Jane Grimwood, Bernard
Potier, Karen Aitken, Jerry Jenkins, Guillaume Martin, Carine Charron,
Catherine Hervouet, et al.
To cite this version:
Olivier Garsmeur, Gaëtan Droc, Rudie Antonise, Jane Grimwood, Bernard Potier, et al.. A mosaic
monoploid reference sequence for the highly complex genome of sugarcane. Nature Communications,
Nature Publishing Group, 2018, 9 (1), 10 p. �10.1038/s41467-018-05051-5�. �hal-02628799�
ARTICLE
A mosaic monoploid reference sequence for the
highly complex genome of sugarcane
Olivier Garsmeur
1,2
, Gaetan Droc
1,2
, Rudie Antonise
3
, Jane Grimwood
4
, Bernard Potier
5
, Karen Aitken
6
,
Jerry Jenkins
4
, Guillaume Martin
1,2
, Carine Charron
1,2
, Catherine Hervouet
1,2
, Laurent Costet
7
,
Nabila Yahiaoui
1,2
, Adam Healey
4
, David Sims
4
, Yesesri Cherukuri
4
, Avinash Sreedasyam
4
, Andrzej Kilian
8
,
Agnes Chan
9
, Marie-Anne Van Sluys
10
, Kankshita Swaminathan
4
, Christopher Town
9
, Hélène Bergès
11
,
Blake Simmons
12
, Jean Christophe Glaszmann
1,2
, Edwin van der Vossen
3
, Robert Henry
13
,
Jeremy Schmutz
4,14
& Angélique D
’Hont
1,2
Sugarcane (Saccharum spp.) is a major crop for sugar and bioenergy production. Its highly
polyploid, aneuploid, heterozygous, and interspeci
fic genome poses major challenges for
producing a reference sequence. We exploited colinearity with sorghum to produce a
BAC-based monoploid genome sequence of sugarcane. A minimum tiling path of 4660 sugarcane
BAC that best covers the gene-rich part of the sorghum genome was selected based on
whole-genome pro
filing, sequenced, and assembled in a 382-Mb single tiling path of a
high-quality sequence. A total of 25,316 protein-coding gene models are predicted, 17% of which
display no colinearity with their sorghum orthologs. We show that the two species, S. of
fi-cinarum and S. spontaneum, involved in modern cultivars differ by their transposable elements
and by a few large chromosomal rearrangements, explaining their distinct genome size and
distinct basic chromosome numbers while also suggesting that polyploidization arose in both
lineages after their divergence.
DOI: 10.1038/s41467-018-05051-5
OPEN
1CIRAD (Centre de Coopération Internationale en Recherche Agronomique pour le Développement), UMR AGAP, F-34398 Montpellier, France.2AGAP,
Univ Montpellier, CIRAD, INRA, Montpellier SupAgro, 34060 Montpellier, France.3KEYGENE N.V., 6708 PW Wageningen, The Netherlands.
4HudsonAlpha Institute for Biotechnology, Huntsville, AL 35801, USA.5SASRI (South African Sugarcane Research Institute), Mount Edgecombe 4300,
South Africa.6CSIRO (Commonwealth Scientific and Industrial Research Organisation), St. Lucia, QLD 4067, Australia.7CIRAD, UMR PVBMT, F-97410 Saint-Pierre, La Réunion, France.8Diversity Arrays Technology, Yarralumla, ACT 2600, Australia.9J. Craig Venter Institute, Rockville, MD 20850, USA.
10Universidade de Sao Paulo, Sao Paulo 05508-090 SP, Brazil.11INRA-CNRGV, 31326 Toulouse, Castanet-Tolosan, France.12JBEI Joint BioEnergy Institute,
Emeryville, CA 94608, USA.13QAAFI (Queensland Alliance for Agriculture and Food Innovation), University of Queensland, St. Lucia, QLD 4072, Australia. 14Department of Energy, Joint Genome Institute, Walnut Creek, CA 94598, USA. Correspondence and requests for materials should be addressed to
A.D’H. (email:[email protected])
123456789
S
ugarcane—a member of the Poaceae family—produces 80%
of the world’s sugar and has recently become a primary crop
for biofuel production
1. Cultivars are vegetatively
propa-gated, while sugarcane breeding is still essentially focused on
conventional methods since sugarcane genetics knowledge has
lagged behind that of other major crops
2. This is due to the
interspecific, polyploid, and aneuploid nature of modern
sugar-cane cultivar genomes, a complexity that exceeds that of most if
not all other crops. Modern sugarcane cultivars are derived from
a few interspecific hybridizations performed a century ago
between S. officinarum and S. spontaneum, two highly polyploid
species. S. officinarum (2n = 8× = 80, x = 10)
3,4has a high sugar
content and is believed to have been domesticated around 8000
years ago from the wild species S. robustum (mainly 2n
= 60, 80,
and up to 200)
5,6. S. spontaneum is a wild species with various
cytotypes and many aneuploid forms (2n
= 5× = 40 to 16× =
128; x
= 8)
3,7and was used to incorporate disease resistance,
vigor, and adaptability
4. Recovery of high sugar production was
achieved by backcrossing the
first hybrid to S. officinarum and
then enhanced via 2n chromosome transmission by the female S.
officinarum
8,9. The resulting cultivars are highly heterozygous,
aneuploid, and have 100–130 chromosomes, most of which are
derived from S. officinarum, 10–20% from S. spontaneum, and
~10% from interspecific recombinants
10,11(Fig.
1
).
In the last 20 years, molecular geneticists have achieved
sig-nificant advances in developing molecular resources and
enhan-cing the overall understanding of the sugarcane genome. Several
geneticmaps have been produced (reviewed in ref.
12) mainly
based on single-dose markers that are the most informative
markers in this high polyploidy context
13. None of these maps
were saturated, but they revealed that chromosome assortment in
modern cultivars results from general polysomy with some cases
of preferential pairing
14–21, while the meiosis of modern
sugar-cane cultivars mainly involves bivalent pairing
8,22,23. Meanwhile,
comparative mapping with other Poaceae species revealed
extensive genome-wide colinearity with sorghum, which thus
became a model for sugarcane
15,24–27. QTL studies have been
performed to identify genomic regions involved in important
agronomic traits, generally revealing minor effects
28–31, except for
the presence of a few major resistance genes
20,32–34. New
approaches are now being developed, such as genome-wide
association (GWA) studies
35–37and genomic selection
38, both of
which exploit the high level of linkage disequilibrium observed
within sugarcane cultivars
39,40. Genomic resources such as large
expressed sequence tag (EST) libraries
41and BAC libraries
42,43have been developed. A sugarcane reference genome would
greatly help to achieve further progress on molecular genetics and
functional genomics geared toward assisting in the development
of improved cultivars. However, sequencing such a highly
com-plex genome poses challenges that have not been addressed in any
prior sequencing project due to the high polyploidy, aneuploidy,
and interspecific structure of this genome, with a complete set of
hom(oe)ologs predicted to range from 10 to 12 copies
44,45. This
polyploidy results in a total genome size of about 10 Gb for
sugarcane cultivars, while the monoploid genome size is about
800–900 Mb, close to that of sorghum (750 Mb)
46.
In this context, an attractive initial strategy would be to
assemble the gene-rich, recombinationally active part (i.e.,
euchromatin) of a monoploid (i.e., basic) sugarcane genome.
Sorghum and rice genome sequencing showed that euchromatin
is gene-rich, repeat-poor, and accounts for most of
recombina-tion, while being of similar physical size in sorghum and
rice (250–300 Mb) despite their overall genome-size difference
(450 Mb for rice and 750 Mb for sorghum)
47. Comparative
analysis among sugarcane hom(oe)ologous chromosome
seg-ments (BAC) showed very high gene colinearity and sequence
conservation
48,49. One haplotype sequence would thus provide a
good reference for the other haplotypes (=hom(oe)ologous
chromosomes). In addition, these studies revealed a high level of
microcolinearity between sorghum and sugarcane
47–51. Sorghum
could be used as a guide to identify a minimum tiling path (MTP)
of BACs covering the euchromatin of a monoploid genome of
sugarcane.
While new sequencing and assembling methods tailored for
complex genomes continue to be developed, we deployed this
original strategy to produce a
first sugarcane reference genome
sequence assembly.
This international initiative focused on the R570 cultivar,
which
has
the
best-characterized
sugarcane
genome
to
date
10,17,18,21,24,44,45. This cultivar was obtained by CERF (now
eRcane) in Réunion (
http://www.ercane.re/
). It has broad
adapt-ability and is used as a parent stock in many breeding stations
worldwide, while also being commercially very successful in
Réunion, Mauritius, and Guadeloupe. The genome of this cultivar
has about 115 chromosomes, including 10% of whole
chromo-somes derived from S. spontaneum and 10% from S. officinarum/
S. spontaneum recombinant chromosomes, with the remaining
being whole chromosomes from S. officinarum
10. Genetic maps
of this cultivar were constructed
17,18,21(
http://tropgenedb.cirad.
fr/tropgene/JSP/index.jsp
) and aligned with sorghum
24. A BAC
library of 103,296 clones
43representing 14× monoploid genome
coverage and 1.3× total genome coverage of this cultivar
44is
available and has been used by the research community for
comparative structural analyses
26,47–49,52,53.
Here, we implemented this strategy using WGP
TMtechnol-ogy
54to align sugarcane BACs from the R570 cultivar with the
sorghum genome and identify a MTP of 4660 sugarcane BACs
originating from distinct hom(oe)ologous chromosomes that
we sequenced, assembled, and annotated. We developed a
SNP-based genetic map for the R570 cultivar and performed global
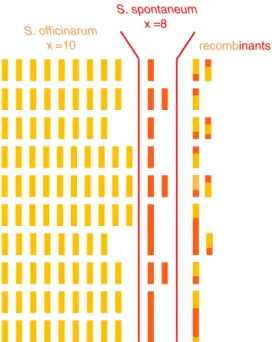
S. officinarum x =10
S. spontaneum x =8
recombinants
Fig. 1 Schematic representation of the genome of a typical modern sugarcane cultivar. Each bar represents a chromosome, in orange or red when originating from S. officinarum or S. spontaneum, respectively. Chromosomes aligned on the same row are hom(oe)ologous chromosomes (HG). The key characteristics of this genome are the high polyploidy, aneuploidy, bispecific origin of the chromosomes, the existence of structural differences between chromosomes of the two origins, and the presence of interspecific chromosome recombinants
genome-wise comparisons between S. officinarum, S.
sponta-neum, and sorghum. This
first sugarcane sequence represents the
gene-rich part of the monoploid sugarcane genome.
Results
A MTP for the gene-rich part of the genome. The overall
strategy that we used to produce a sugarcane monoploid reference
sequence assembly is represented in Fig.
2
. A total of 20,736 BAC
clones from the sugarcane R570 cultivar, representing around
two-fold the monoploid genome of sugarcane, were analyzed via
WGP. This technology generates Illumina short-read sequences
(WGP tags) from BAC clone-restriction fragments. A total of
701,066 WGP tags were obtained and those that were common to
several BACs were discarded. Half (222,745) of the remaining
WGP tags could be aligned onto the sorghum sequence. Among
them, 90,953 WGP tags aligning at a single position allowed
anchoring of 11,732 sugarcane BACs onto the ten sorghum
chromosomes (Table
1
). Another 577 already-sequenced BAC
clones were also anchored onto the sorghum genome. The
sugarcane BAC clones were, not surprisingly, mostly distributed
in sorghum gene-rich distal chromosomal regions (Fig.
3
) as
mainly genes are conserved between the two species. Among a
total of 12,309 anchored BACs, an MTP of 4660 BAC clones,
corresponding to the minimal set of BACs providing the best
coverage of the gene-rich part of the 10 sorghum chromosomes,
was defined (Table
1
and Supplementary Table
1
).
A 382-Mb mosaic sequence with 25,316 predicted gene models.
The 4083 BAC clones of the MTP for which no sequences were
available were sequenced in pools of 24 or 96 using PacBio RSII
technology with a sequencing depth of around 100× per BAC
(Supplementary Table
1
). BAC pools were designed to avoid
pooling hom(oe)ologous overlapping BACs that could complicate
the assembly of individual BACs. A total of 5896 PacBio contigs
were assembled with a mean length of 102,858 bp. Contigs were
assigned to each of the BAC clones using their corresponding
WGP tags. The vast majority of BAC clones were assembled in
one contig (85%) or a few contigs (Supplementary Table
1
). A
total of 4535 BAC sequences were obtained, including the 577
BAC clones that were already sequenced, corresponding to 531
Mb of sequence (Table
1
and Supplementary Table
1
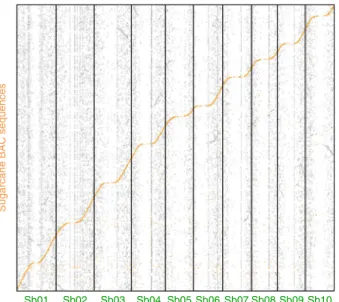
). Figure
4
illustrates the extensive coverage of the sorghum genome by
the sugarcane BAC sequences. The MTP contained sequence
overlaps between adjacent BAC clones that were then trimmed to
Sugarcane
BAC clones WGP sequence-tags
Sorghum sequence Sugarcane monoploid mosaic genome
a
Whole genome profilingb
BAC aligned on sorghum using tagsc
Selection and sequencing of a MTP of BAC Sugarcane homoeologous chromosomes segments MTP STPd
Single tiling pathe
Fig. 2 Sequencing strategy targeting the sugarcane monoploid genome based on the overall synteny and colinearity conservation within sugarcane hom (oe)ologs and with sorghum.a WGP sequence tags were produced from R570 sugarcane BACs. b WGP sequence tags were aligned onto the sorghum sequence, thus allowing the location of sugarcane BACs on sorghum.c A minimum tiling path of a BAC (MTP) corresponding to a monoploid sugarcane genome was defined and sequenced. d Overlapping BAC sequences were trimmed to construct the single tiling path (STP). e The STP sequence contains BAC contigs that belong to distinct hom(oe)ologous chromosomes. S. officinarum and S. spontaneum chromosome segments are represented in orange and red, respectively
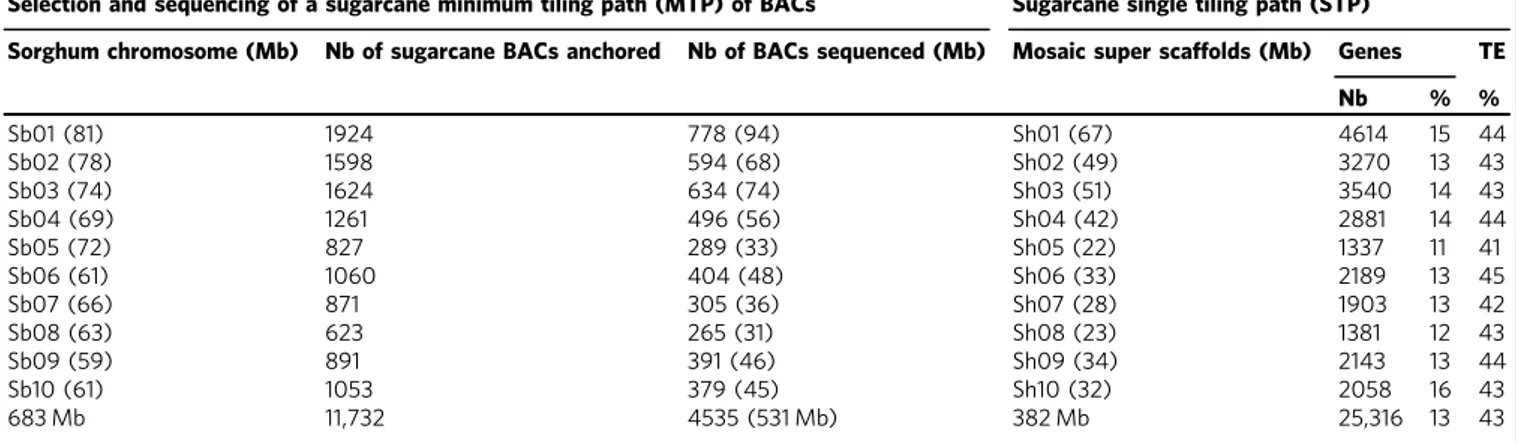
Table 1 Selection and sequencing of BACs targeting the gene-rich part of the sugarcane monoploid genome
Selection and sequencing of a sugarcane minimum tiling path (MTP) of BACs Sugarcane single tiling path (STP)Sorghum chromosome (Mb) Nb of sugarcane BACs anchored Nb of BACs sequenced (Mb) Mosaic super scaffolds (Mb) Genes TE
Nb % % Sb01 (81) 1924 778 (94) Sh01 (67) 4614 15 44 Sb02 (78) 1598 594 (68) Sh02 (49) 3270 13 43 Sb03 (74) 1624 634 (74) Sh03 (51) 3540 14 43 Sb04 (69) 1261 496 (56) Sh04 (42) 2881 14 44 Sb05 (72) 827 289 (33) Sh05 (22) 1337 11 41 Sb06 (61) 1060 404 (48) Sh06 (33) 2189 13 45 Sb07 (66) 871 305 (36) Sh07 (28) 1903 13 42 Sb08 (63) 623 265 (31) Sh08 (23) 1381 12 43 Sb09 (59) 891 391 (46) Sh09 (34) 2143 13 44 Sb10 (61) 1053 379 (45) Sh10 (32) 2058 16 43 683 Mb 11,732 4535 (531 Mb) 382 Mb 25,316 13 43
construct a single tiling path (STP) that is a single copy in the
sugarcane gene space. Based on sequence comparisons with WGS
data from S. officinarum and S. spontaneum, we could assign an S.
officinarum origin to 71% of the STP vs. 23% to S. spontaneum.
These proportions were consistent with the overall estimation of
S. officinarum vs. S. spontaneum chromosome constitution (~85
vs. ~15%) of cultivar R570 based on molecular cytogenetics
10.
BAC contigs from this STP were oriented and merged into 10
mosaic super-scaffolds based on synteny conservation with
sor-ghum. This STP consisted of 382 Mb of high-quality sequence in
3965 contigs, with an average size of 96 kb, and including only
0.02% uncalled bases (N).
A total of 25,316 protein-coding gene models were predicted,
which represented 13% of the STP sequence (Table
1
,
Supple-mentary Table
2
). A sorghum orthologous gene could be found
for 20,809 (82%) of these sugarcane-predicted genes among the
27,532 sorghum protein-coding gene models predicted on the
sorghum genome. Many of the remaining 4507 gene models were
short monoexonic predictions with no hits in the Uniprot/Trembl
sequence database (
http://www.uniprot.org
) and no Interpro
domains and likely corresponded to overpredictions. Among the
1267 gene models that had at least one Interpro domain, the most
frequently found domains corresponded to proteins involved in
signaling or defense responses such as kinases, receptor-like
kinases, and NB-ARC proteins. Proteins involved in protein
degradation by the proteasome were also found, specifically F-box
proteins and proteins with an SKP1/BTB/POZ domain
(Supple-mentary Table
3
). Many of these proteins are encoded by genes
that are known to evolve rapidly
55,56.
Among a set of 9871 conserved grass genes, 79% (7791) were
captured by the STP.
Gene colinearity conservation at the BAC level (i.e., ~100 kb)
was analyzed by comparing BACs of the sugarcane STP to the
corresponding orthologous regions in sorghum. Among the
20,809 sugarcane-predicted gene models for which an ortholog
could be found in the sorghum sequence, 83% were located
within the corresponding orthologous sorghum segments, thus
leaving 17% of sugarcane-predicted genes in the non-collinear
position in sorghum. Since we selected the BACs to be sequenced
based on their global alignments with sorghum, this level of
non-colinearity could be higher in more rearranged regions between
sugarcane and sorghum, or among sugarcane hom(oe)ologs.
Finally, based on a sequence comparison of 13,069 pairs of
orthologous genes, we evaluated the sugarcane/sorghum
diver-gence at 8.5 My (median ks
= ~0.111), which is in the upper
range of previous estimations
48–51.
Differential transposable element (TE) amplification among
Saccharum species. TEs were annotated in the STP and their
proportions estimated in WGS data from the R570 cultivar, one S.
spontaneum accession and one S. officinarum accession (Table
2
).
They represented 43% of the STP as compared to at least 52%
for the whole R570 cultivar genome in agreement with the
STP focusing on the gene-rich euchromatin fraction of the
gen-ome as opposed to the TE-rich heterochromatin. The most
represented TE families in both S. officinarum and S. spontaneum
are the LTR retrotransposon families Gypsy Chromovirus
and
Copia
Maximus/SIRE.
The
insertion
dates
of
the
complete LTR retrotransposons displayed an L shape, revealing
continuous transposition activity over the last few million years
Sugarcane BAC Sorghum genes
Sorghum transposable elements Sb01 Sb02 Sb03 Sb04 Sb05 Sb06 Sb07 Sb08 Sb09 Sb10 0 Mb 20 Mb 30 Mb 40 Mb 50 Mb 60 Mb 70 Mb 80 Mb 10 Mb
Fig. 3 Distribution of the 11,732 sugarcane BACs aligned onto the sorghum genome through WGP. Sugarcane BAC clones are represented by orange bars. Sorghum gene and transposable element densities are represented in green and gray, respectively
Sb01 Sb02 Sb03 Sb04 Sb05 Sb06 Sb07 Sb08 Sb09 Sb10
Sugarcane
BAC
sequence
s
Fig. 4 Coverage of the sorghum genome by the sequenced sugarcane BAC MTP. Dot plot with alignment of BAC sequences from the sugarcane MTP (y-axis) on the sorghum genomic sequence (x-axis). The sorghum genome covered by the sugarcane MTP sequence is highlighted in orange. Gray segments correspond to duplicated regions resulting from ancestral whole-genome duplications in Poales
(Supplementary Fig.
1
). TE represented a larger part of the
S. officinarum genome compared to the S. spontaneum genome
(~54 vs. ~47%), in agreement with their distinct basic genome
sizes of ~950 vs. ~ 800 Mbp
46,57. The larger basic genome of
S. officinarum mainly resulted from a more intense amplification
of the Gypsy Chromovirus and Copia Maximus/SIRE families in
this species’ lineage after its divergence from S. spontaneum
around 1.5–3.5 Mya
48,53. The majority of TE families are less
abundant in S. spontaneum compared to S. officinarum, with the
exception of two Gypsy families, Ogre_TAT and Athila that have
been amplified more intensively in S. spontaneum after the
divergence of these two species.
Chromosome structural variations among
Saccharum species.
A SNP-based genetic map was built using 186 individuals from a
self-progeny of cultivar R570 genotyped by DArTseq. A total of
12,468 single-dose SNPs were assembled into 132 cosegregation
groups (CGs) that included 5–624 DArTseq markers, with an
average of 94 markers.
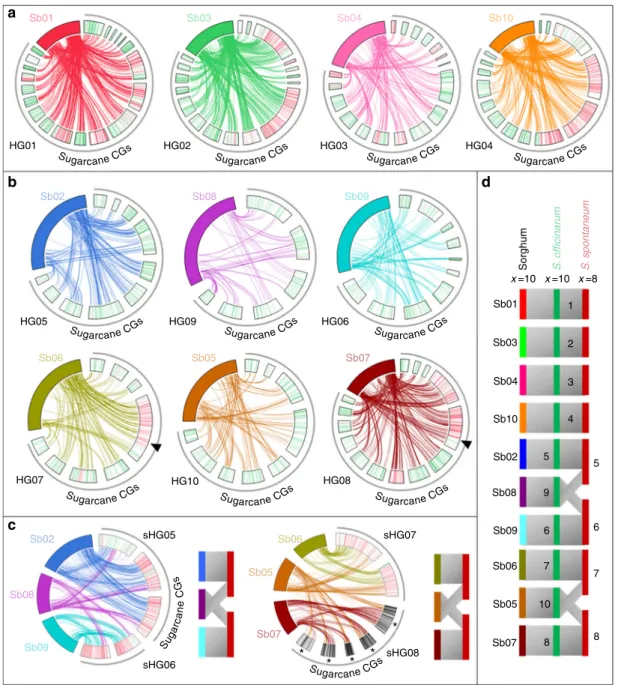
The origin of CGs was then tentatively assigned to ancestral
species (S. officinarum vs. S. spontaneum) based on 5377 SNPs
differentiating S. officinarum/S. robustum vs. S. spontaneum
accessions within a panel of 34 accessions genotyped with
DArTseq. Most CGs (74%) were assigned to S. officinarum and
26% were assigned to S. spontaneum or to recombinant
chromosomes between these two species (Fig.
5
). CGs assigned
to S. officinarum were generally much smaller (i.e., contained
fewer markers) than CGs assigned to S. spontaneum, as also
observed in previous sugarcane-mapping studies
18,58. This is
explained by the fact that the S. spontaneum genome is less
redundant than the S. officinarum genome in sugarcane cultivars
and thus bears more single-dose markers amenable to genetic
mapping.
Synteny conservation between sugarcane CGs and sorghum
chromosomes was analyzed using 5406 DArTseq markers from
the R570 genetic map that could be aligned with the sorghum
sequence. Most sugarcane CGs (125, 95%) had a large majority of
markers aligned with one single sorghum chromosome (Fig.
5
a, b,
Supplementary Fig.
2
), while for seven CGs a large majority of
markers aligned with two distinct sorghum chromosomes
(Fig.
5
c). Sugarcane CGs were assembled in hom(oe)ology groups
(HGs, one HG
= one basic chromosome set) based on these
syntenic relationships (Fig.
5
and Supplementary Figs.
2
,
3
).
Interestingly, all seven CGs that aligned with two sorghum
chromosomes were assigned to S. spontaneum chromosomes
or to recombinant chromosomes between S. spontaneum and
S. officinarum (Fig.
5
). These results suggested that a few large
chromosome rearrangements differentiate S. spontaneum on
one side and S. officinarum and sorghum on the other. In S.
spontaneum, one HG was orthologous to sorghum chromosome 2
and one arm of sorghum chromosome 8, whereas another HG
was orthologous to sorghum chromosome 9 and the other arm of
sorghum chromosome 8. A third S. spontaneum HG was
orthologous to sorghum chromosome 6 and one arm of sorghum
chromosome 5. The R570 SNP map did not feature any S.
spontaneum CG aligned with the second arm of sorghum
chromosome 5. However, preliminary SNP mapping data on
another sugarcane clone (MQ 76-53, Supplementary Fig.
3
)
revealed a few CGs orthologous to sorghum chromosome 7 and
part of sorghum chromosome 5 (Fig.
5
). In addition, Aitken
et al.
15also observed a few CGs in cultivar Q165 orthologous to
chromosomes 5 and 7 of sorghum. This suggests that one S.
spontaneum basic chromosome could be orthologous to sorghum
chromosome 7 and one arm of sorghum chromosome 5. This
configuration may have been lacking in the R570 genetic map,
probably because our map is far from saturation, and CGs only
partially cover the corresponding chromosomes. In addition, one
Table 2 Transposable element (TE) contents in the single tiling path (STP) and in whole-genome sequencing data from the R570
cultivar, one
S. officinarum (S. OFF) and one S. spontaneum (S. SPONT)
R570 STP annotation Repeat explorer clusters assembled from WGS data
STP BAC S. OFF BAC S. SPONT BAC STP reads R570 WGS S. OFF WGS S. SPONT WGS
TE (all) 43.1% 47.3% 38.3% 41.2% 50.9% 53.6% 46.5% DNA transposons 4.6% 4.9% 4.3% 1.8% 1.8% 1.9% 1.9% TIR DTA_hAT 2.79% 2.96% 2.68% 0.24% 0.24% 0.23% 0.28% DTC_CACTA 1.15% 1.23% 1.02% 0.71% 0.82% 0.86% 0.81% DTM_Mutator 0.51% 0.53% 0.51% 0.65% 0.43% 0.43% 0.53% DTX 0.18% 0.21% 0.12% 0.25% 0.34% 0.37% 0.28% LTR retrotransposons 36.8% 40.9% 32.3% 29.8% 38.1% 40.1% 34.6% Copia 16.09% 17.53% 14.44% 13.34% 14.01% 15.25% 12.09% RLC_AleI_Retrofit 2.51% 2.42% 3.01% 1.43% 0.66% 0.57% 0.83% RLC_Angela 1.09% 1.19% 1.00% 1.01% 0.95% 0.99% 0.80% RLC_Bianca 0.02% 0.02% 0.03% 0.15% 0.13% 0.13% 0.15% RLC_Ivana_Oryco 0.16% 0.16% 0.14% 0.37% 0.22% 0.25% 0.15% RLC_Maximus/SIRE 9.53% 10.74% 7.81% 10.02% 11.69% 12.92% 9.82% RLC_TAR 0.11% 0.11% 0.14% 0.25% 0.24% 0.25% 0.31% RLC_Tork 0.04% 0.06% 0.00% 0.11% 0.11% 0.13% 0.03% RLC 2.63% 2.83% 2.31% 0.00% 0.00% 0.00% 0.00% Gypsy 20.39% 23.06% 17.51% 16.46% 24.10% 24.80% 22.54% RLG_Athila 1.42% 1.32% 1.99% 1.71% 3.47% 3.27% 5.23% RLG_Chromovirus 11.00% 13.29% 7.38% 10.47% 16.65% 17.62% 11.32% RLG_Ogre_TAT 4.84% 4.85% 5.65% 4.27% 3.98% 3.91% 5.98% RLG_Reina 0.84% 0.95% 0.69% 0.00% 0.00% 0.00% 0.00% RLG 2.29% 2.64% 1.80% 0.00% 0.00% 0.00% 0.00% RLX 0.35% 0.35% 0.39% 0.00% 0.00% 0.00% 0.00% Unclassified 1.6% 1.4% 1.7% 9.6% 10.9% 11.6% 10.0%
large CG assigned to HG08 in cultivar R570 apparently resulted
from an interspecific recombination event between S. spontaneum
and S. officinarum chromosomes: this recombination could have
removed the portion orthologous to sorghum chromosome 7
from the original S. spontaneum chromosome (see the arrow in
Fig.
5
b). A similar situation was observed for one interspecific
recombinant CG assigned to HG07 (see arrow in Fig.
5
b).
Previous mapping studies have suggested a few large
chromo-some structural variations between sugarcane and sorghum with
some sugarcane CGs having segments orthologous to two
sorghum chromosomes
15,24,59. While our genetic map remains
unsaturated, our relatively high number of markers with
assign-ments to S. officinarum vs. S. spontaneum enabled us for the first
time to describe chromosome rearrangements involving two
sets of three ancestral chromosomes that were each rearranged in
two chromosomes (Fig.
5
). These rearrangements corroborated
and explained a variation in basic chromosome numbers in S.
officinarum vs. S. spontaneum, i.e., x = 10 and x = 8,
respectively
3,60. The coexistence of distinct chromosome
organi-zations in the genome of modern cultivars most likely has an
1 2 3 4 5 9 6 6 7 7 10 8 8 5
*
*
*
*
*
HG04 HG01a
b
c
d
HG05 Sb06 Sb05 HG09 HG06 HG08 HG10 sHG06 sHG08 sHG07 sHG05 HG07 Sb07 Sb01 Sb02 Sb02 Sb06 Sb05 Sb07 Sb03 Sb08 Sb08 Sb09 Sb09 Sb04 Sb10 HG02 HG03 Sorghum S. officinar um S . spontaneum Sb01 x =10 x =10 x =8 Sb03 Sb04 Sb10 Sb02 Sb08 Sb09 Sb06 Sb05 Sb07 Sugarcane CGs Sugarcane CGs Sugarcane CGs Sugarcane CGs Sugarcane CGs Sugarcane CGs Sugarcane CGs Sugarcane CGsSugarcane CGs Sugarcane CGs Sugarcane CGs
Su ga rca ne C G s
Fig. 5 SNP-based sugarcane genetic map with putative origin of cosegregation groups and comparison with sorghum chromosomes. The 132 CGs of cultivar R570 are represented with SNP markers assigned to S. officinarum or S. spontaneum indicated by green and red bars, respectively. Circos represents orthologous relationships between sugarcane CGs and sorghum chromosomes (Sb1–Sb10) based on the alignment, for each CG, of a majority of the markers on one (a, b) or two (c) sorghum chromosomes (color links) (see Supplementary Fig.2for representation of all links). Based on these orthologous relationships, CGs were assembled in hom(oe)ology groups (HGs):a Four HGs (HG1–HG4) including CGs from S. officinarum, S. spontaneum, and interspecific recombinants orthologous to one sorghum chromosome. b Six HGs (HG6–HG10) including S. officinarum CGs, and a few S. spontaneum and interspecific recombinant CGs orthologous to one sorghum chromosome. Arrows point to two interspecific recombinations (see text). c Two pairs of HGs (sHG5 and sHG6, and sHG7 and sHG8), each including S. spontaneum or interspecific recombinant CGs orthologous to two sorghum chromosomes. d Schematic comparison of the deduced basic genome organization in S. spontaneum (x= 8), S. officinarum (x = 10), and sorghum (x = 10). Asterisk represents CGs from the MQ76-53 SNP map (see text and Supplementary Fig.3)
impact on their meiosis and may be a source of the aneuploidy
observed in modern cultivars. A basic chromosome number of x
= 10 is found in both sorghum and S. officinarum and is
recognized as being ancestral in Saccharinae-Sorghinae
50. These
rearrangements must have arisen in the S. spontaneum lineage
after its divergence from the lineage of S. officinarum and its
recognized wild ancestor S. robustum. The mechanisms involved
will require further investigation but could imply two successive
reciprocal translocations, as reported in Brassicaceae and
Poaceae
61,62. This scenario also suggests that polyploidization
occurred independently in S. officinarum/S. robustum and S.
spontaneum lineages after their divergence around 1.5 to 3.5
Mya
48,53in discordance with previous hypotheses
50.
Discussion
The sequence reported here is the
first assembly of the sugarcane
genome with 382 Mb of sequence in 3965 high-quality contigs.
This was achieved by isolating BAC clones corresponding to a
monoploid genome of sugarcane to overcome assembly
difficul-ties linked to the high ploidy, aneuploidy, and heterozygosity of
sugarcane cultivars. This sequence assembly is proposed as a
reference for the euchromatin gene-rich part of the genome,
known to account for most of the recombination, and thus
representing the most useful part for breeding.
We confirmed the overall gene synteny conservation and
colinearity between sugarcane and sorghum, while identifying
17% of genes predicted to be non-collinear in the surveyed
regions. We showed that the two species involved in modern
cultivars differ for LTR retrotransposon amplification after their
divergence, and that the larger basic genome size of S. officinarum
compared to S. spontaneum is mainly due to the amplification of
two families, i.e., the Gypsy RLG_Chromovirus and Copia
RLC_Maximus/SIRE. In addition, we showed that these two
species differed by two rearrangements, each involving three sets
of ancestral chromosomes, which explains their distinct basic
chromosome numbers. Two chromosome organizations thus
coexist in the genome of modern cultivars. We propose a
chronologic sequence for these rearrangements and
poly-ploidization in the Saccharum genus.
This monoploid reference sequence provides an essential
genome template for aligning sequencing data, such as
genotyp-ing by sequencgenotyp-ing, WGS, and RNA-Seq data to explore hom(oe)
ologous allelic variation and perform genetic (e.g., QTL and
GWAS) and genomic studies in cultivars and sugarcane
germ-plasm. These studies, as before, will require methods (e.g., SNP
calling) adapted to the high polyploid context of sugarcane. This
reference will also facilitate the identification of candidate genes/
loci in regions found to be associated with targeted phenotypic
traits by permitting the location of these regions within the
annotated genome. Finally, it will provide an essential framework
to help current whole-genome sequencing initiatives meet the
challenge of assembling such a complex genome.
Methods
Sugarcane BAC selection through whole-genome profiling. WGP of 20,736 BACs from the R570 sugarcane BAC library43was performed as described by Van Oeveren et al54. A total of 701,066 WGP tags of 50 bp, corresponding to 18,843 BACs, were obtained, representing an average of 37 WGP tags per BAC. WGP tags common to distinct BACs were discarded and the remaining 455,656 WGP tags were aligned with the sorghum genome using Bowtie2 v.2.3.2 (http://bowtie-bio. sourceforge.net/bowtie2/index.shtml) with the following parameters: -D 15, -R 2, -N 1, -L 22, and -i S, 1 and 0.75. Around 50% of the tags (232,911) aligned with the sorghum sequence (V2.1). A total of 90,953 WGP tags (20%) aligned at a single position and 141,958 WGP tags (30%) aligned in multiple positions. Sugarcane BACs werefirst anchored onto the sorghum genome using tags that aligned at single positions. A BAC was anchored if at least 20% of the tags (representing a minimum of three tags) obtained from this BAC could be mapped in a 300-kb window. A total of 11,732 BACs could be anchored onto the sorghum genome
(Supplementary Table1). Then 22,299 WGP tags that aligned at multiple positions on sorghum but in the same 300-kb window as the anchored BACs were used as additional information to refine BAC positions. Another 577 already-sequenced BAC clones were anchored onto the sorghum genome using BLAST63. Finally, among the 12,309 anchored BACs, an MTP of 4660 BAC clones was selected based on visual inspection of their position on the sorghum genome and of BAC clone overlaps.
BAC sequencing and assembly. An initial set of 577 BAC clones were sequenced individually, including 245 BAC clones reported by De Setta et al.52, Garsmeur et al.49, and Jannoo et al.48, and 332 BAC clones sequenced by DOE-JGI using 2 × 250-bp paired-end single-indexed Illumina and assembled with Phrap (Green, http://www.phrap.org/phredphrap/phrap.html). For 4083 BAC clones, DNAs were extracted individually and then pools of BAC DNA were obtained. PACBIO RS II was used for sequencing with a targeted 100× depth per BAC. Half of the BACs were sequenced by KeyGene in pools of 24 clones and the other half by DOE-JGI in pools of 96 clones. Assembly was performed using HGAP3 (version 2.3.0) followed by consensus-sequence calling with Quiver (version 2.1). For each sequenced pool, WGP tags corresponding to the pooled BACs were aligned with the contigs obtained. BLAST alignments of WGP tags with identity and coverage equal to or greater than 99% were used to assign contigs to the corresponding BAC clones, resulting in the assembly of 3958 BAC sequences. Whole BAC sequence contigs were aligned to the sorghum sequence using the BLAST algorithm with the best hits being retained to produce Fig.4.
To construct STP, contigs (larger than or equal to 20 kb) from the
4535 sequenced BAC clones were aligned with the sorghum-annotated nucleotide gene set (version 3.1) using BLAT (https://github.com/dib-lab/ged-docs/wiki/ BLAT, parameters -noHead -extendThroughN -q=rna -t=dna). Sorghum gene alignments were used to inform the process of reducing the initial MTP in an STP representing a single copy of sugarcane gene space. BAC segments sharing at least two sorghum genes were considered as redundant overlapping regions. These BAC clones were aligned with one another using Gepard (http://cube.univie.ac.at/ gepard). Overlapping BAC regions sharing identical sorghum genes were then collapsed into a single path, thus maximizing the number of retained genes and minimizing sequence loss. Sorghum gene positions werefinally used to order, orient, and join the BAC contigs using 10,000 Ns to form 10 super-scaffolds. Ancestral origin of sugarcane BAC clones. To identify the origin, S. officinarum vs. S. spontaneum, of sugarcane BAC sequences, Illumina WGS data from one S. officinarum accession (LA Purple) and one S. spontaneum accession (SES234B) were aligned separately to BAC sequences using BWA-MEM. The cumulative read coverage of each BAC clone was calculated and compared using SAMtools (min depth= 5 reads, min quality = 20) and bedtools genomecov (-bga). BAC contigs were then classified if there was at least 10% difference in the total coverage of the BAC clone by S. officinarum or S. spontaneum reads. Among the 4535 BAC contigs sequenced, 86% could be assigned with 78% to S. officinarum and 22% to S. spontaneum. The remaining BAC contigs (>50 kb) were analyzed using species-specific 24-bp kmers (24 mers) extracted from (i) repetitive regions (read depth > 2 × SD of mean), and (ii) well-covered regions (read depth within 1 SD of the mean) of the previous set of S. officinarum and S. spontaneum BAC contigs assigned to S. officinarum and S. spontaneum. These kmers were used to mask BAC contig sequences, and the ancestral origin was determined based on the majority of sequences masked by the species-specific kmers. Finally, a total of 4281 BAC contigs were classified, representing 360 Mbp (94.4%) out of the 382 Mbp of the STP, with 272 Mb (71%) assigned to S. officinarum and 88 Mb (23%) to S. spontaneum.
R570 RNA-Seq data. RNA was extracted from R570 cultivar leaves, roots, and stems using a method adapted from Bugos et al64. Three cDNA libraries (one per tissue) were built using the TruSeqStranded mRNA sample preparation kit (Illu-mina) and subsequently paired-end sequenced (2 × 125 bp) on an Illumina HiSeq 2500 system. A total of 354 million reads were produced and 63, 54, and 57 million paired-read clusters were built for leaves, roots, and stems, respectively, and assembled using Trinity in 340,409 transcripts larger than 300 bp (https://github. com/trinityrnaseq/trinityrnaseq/wiki).
Sugarcane genes annotation. Structural annotation was performed using EuGene 4.2a (http://eugene.toulouse.inra.fr), which combines evidence from alternative splice site detection, sequence model training, genome masking, transcript map-ping, and protein homology to define confident gene models. The R570 cultivar RNA transcripts, together with transcripts from six sugarcane genotypes produced by Cardoso-Silva et al.65, were aligned on the sugarcane STP using GMAP (https:// github.com/juliangehring/GMAP-GSNAP/) and best-scoring hits were kept. The resulting alignments were integrated as sugarcane transcript evidence in the pre-diction process. Protein sequences from the reference sorghum proteome (Phy-tozome, release 3.1.1) were aligned with the sugarcane STP using BLASTX to obtain protein homology evidence.
Gene function annotation was assigned based on sequence and domain conservation. Protein sequences were aligned with SwissProt, TrEMBL, and
sorghum datasets by BLASTP using an E-value threshold of 1e-10. Best-hit BLAST results were then used to define the gene functions. Moreover, InterProScan = (https://www.ebi.ac.uk/interpro/search/sequence-search) was performed to annotate protein domains, extending the annotation to Gene Ontology terms associated with these protein domains. The predicted gene models werefinally screened to remove models that could correspond to TEs using CENSOR (https:// www.girinst.org/censor/)66resulting in a total of 25,316 sugarcane genes annotated on the STP.
TEs annotation. Sets of 2 million Illumina reads (150 bp) were retrieved from WGS data for the R570 cultivar, one S. officinarum accession (LA Purple) and one S. spontaneum accession (SES 234). A similar dataset was created from the sugarcane STP through generation of in silico Illumina reads with WGSIM (https:// github.com/lh3/wgsim). These four datasets were used to perform a graph-based clustering analysis of repetitive sequences using the RepeatExplorer pipeline67. A total of 179 clusters were obtained, manually inspected using the .htlm summary outputfile generated by the pipeline, and clusters corresponding to chloroplast or containing less than 3000 Illumina reads were not considered for further analyses. The 135 remaining clusters were manually annotated using a library of 58 pre-viously annotated sugarcane elements52and using similarity searches against Repbase (https://www.girinst.org/repbase/), a protein domain database of plant mobile elements (included in RepeatExplorer). For each annotated cluster, the WGS read numbers and percentage were calculated in datasets corresponding to STP, R570, S. officinarum, and S. spontaneum (Table2).
TE annotation of the sugarcane STP was performed with the TEannot pipeline from the REPET package v2.5 (https://urgi.versailles.inra.fr/Tools/REPET), which requires a reference library of TEs. This latter reference library was built through clustering of the following TE sequences:
—The 58 previously annotated sugarcane TEs.
—1883 full-length LTR retrotransposons detected in the sugarcane STP using LTR_FINDER v1.05 (https://github.com/xzhub/LTR_Finder).
—The 135 RepeatExplorer clusters described above.
A total of 446 clusters were obtained using UCLUST v1.2.22q with the following parameters: --id 0.80 --maxlen 25000 --minlen 100–nucleo (https://drive5.com/ usearch/manual/uclust_algo.html) and used for TE annotation with the REPET package.
The percentage of TE in the STP was calculated based on the sequence proportion covered by each TE type (Table2).
The timing of insertion of full-length LTR retrotransposons was determined by estimating the amount of divergence between LTR sequences. The two LTRs of each retrotransposon were aligned using MAFFT (https://mafft.cbrc.jp/alignment/ software/), and the genetic divergence was estimated using the Kimura 2 parameter method. The insertion dates were estimated using a substitution rate of 1.3e-08 per site per year68.
DArTseq genotyping. A mapping population encompassing 186 individuals from a self-progeny of cultivar R570 and a panel of 34 accessions belonging to the Saccharum genus were genotyped through DArTseq at Diversity Arrays Tech-nology Pty Ltd., Australia. Two adapters corresponding to two different restriction enzyme overhangs were used; a PstI-compatible adapter, including a barcode region for multiplexing and a reverse NspI-compatible adapter. Only fragments that contained both adapters (PstI–NspI) were used to build sequencing libraries (Illumina, USA). The resulting libraries (two copies per sample) were sequenced in batches of 94 per lane on Illumina Hiseq2500.
The raw sequencing data obtained were then demultiplexed using GBSX (https://github.com/GenomicsCoreLeuven/GBSX),filtered for quality using FASTQC (https://www.bioinformatics.babraham.ac.uk/projects/fastqc/), and barcode adapters were removed using Cutadapt (http://opensource.scilifelab.se/ projects/cutadapt/). Only sequence reads≥ 30 bp were kept for further analysis, representing 885 million reads for the mapping population and 161 million reads for the diversity data, corresponding to an average of around 5 million reads per sample.
Construction of the R570 cultivar SNP-based genetic map. Identification of high-confidence single-dose SNP markers: DArTseq data from the 186 individuals from the self-progeny of R570 were analyzed to identify high-confidence single-dose SNP markers useful for genetic mapping. The analysis was based on a de novo approach involving the assembly of a pseudomolecule that was further used as a template for read mapping. This pseudomolecule was assembled by clustering all DArTseq reads using CD-Hit-EST69with the following parameters: -c 0.9, -al 0.9, -p 1, and -M 0. Clusters were then randomly assembled to form the pseudomo-lecule, with each cluster being separated by a stretch of 1000“N”. A pipeline (available athttps://github.com/SouthGreenPlatform/VcfHunter/) was developed to perform the following complete process: (1) DArTseq reads were aligned on the pseudomolecule using BWA-MEM (http://bio-bwa.sourceforge.net); (2) a local realignment of reads around indels was performed with the GATK IndelRealigner (https://software.broadinstitute.org/gatk/documentation/tooldocs/3.8-0/ org_broadinstitute_gatk_tools_walkers_indels_IndelRealigner.php); (3) metrics were generated at each single-nucleotide position within realignments (count number of A, C, G, and T at each position) with Bam-readcount (https://github.
com/genome/bam-readcount); (4) SNP positions on the pseudomolecule and allele count were converted in a standard variant-calling formatfile (VCF); and (5) the VCF was then screened to determine the genotype (homozygous vs. heterozygous) of each individual and at each position. Several criteria were taken into account to improve the genotype determination accuracy. First, a 30× minimum and 1000× maximum read depth was required and only diallelic polymorphic markers were considered. For heterozygous genotypes, the minor allele then had to be repre-sented by at least two reads with a frequency of at least 4%. Ambiguous genotypes with a minor allele frequency ranging from 1 to 4% were converted as missing data (uncalled genotype). Homozygous genotypes were determined when no variant was observed or with a frequency of <1% (considered as sequencing error). (6) The segregation ratio of single-dose polymorphic markers within the population was then evaluated using aχ2test (p= 0.05). SNP markers displaying an expected 3:1 ratio and with less than 20% missing data were considered as high-confidence single-dose SNPs. A total of 13,062 single-dose SNPs were identified.
Construction of the R570 cultivar SNP-based genetic map and alignment with the sorghum genome: The genetic map was built with the 13,062 single-dose SNP markers using JoinMap 4.170with a LOD score threshold of 10 and a maximum recombinant fraction of 0.35. CGs containing at leastfive markers were kept. Markers were ordered with MSTmap71with standard parameters.
DArTseq markers from sugarcane CGs were aligned with the sorghum genome using BLASTN and 5406 DArTSeq markers with hit identity and coverage equal to or greater than 95% were kept. Orthologous relationships between sugarcane CGs and sorghum chromosomes were then established based on the proportion of DArTseq markers from one sugarcane CG aligned with each of the sorghum chromosomes. A minimum offive markers, representing at least 10% of aligned markers for a CG was used. For 125 CGs, a large majority of markers (mean= 88%) aligned with a single sorghum chromosome. For seven CGs, a large majority of markers (mean= 81%) aligned with two sorghum chromosomes. The resulting genetic map with markers aligned with the sorghum chromosomes was constructed using Circos72(Fig.5and Supplementary Figs.2,3).
S. officinarum vs. S. spontaneum origin of R570 cultivar CGs. DArTseq data from the panel of 34 Saccharum accessions, comprising 12 S. officinarum acces-sions (Ashy Mauritius, Badila, Banjarmasin Hitam, Black Cheribon, BNS-3066, Crystallina, EK28, IJ76-432, IS76-203, LA Purple, Lousier, and NG57-123), nine S. robustum (IJ76-445, IM76-234, IS76-138, Mol-4503, NG28-251, 021, NG77-054, NG77-108, and NG77-230), and 13 S. spontaneum accessions (Glagah-1286, Glagah-WT, IK76-041, IK76-067, Mandalay, Mol-5904, NG51-2, Coimbatore, SES-014, SES-178, SES-208, SES-264, and SES-289A), were aligned on the same pseu-domolecule developed for the analysis of DArTseq genetic mapping data. A raw VCFfile comprising the SNP positions and allele counts was created and filtered, as described above for identifying high-confidence SNP markers (pipeline, steps 1–5). A SNP was considered as originating from S. officinarum if present in at least two S. officinarum or S. robustum accessions and absent from all S. spontaneum acces-sions. Reciprocally, a SNP that was present in at least two S. spontaneum accessions and absent from all officinarum and robustum accessions was considered as ori-ginating from S. spontaneum. This enabled the determination of the ancestral origin of 5377 SNP markers from the R570 genetic map.
Sugarcane–sorghum comparative analysis. Identification of orthologous gene pairs: Sorghum gene models from the v2.1 DOE-JGI annotation set (http:// phytozome.jgi.doe.gov/) werefiltered to remove those corresponding to TE-like genes using CENSOR, as done previously for sugarcane genes. For genes with several predicted alternative transcripts, we only kept the longest one. The resulting 27,532 sorghum genes were aligned with the 25,316 annotated sugarcane genes using BLASTP, and orthologous gene pairs with identity equal to or greater than 70% and coverage equal to or greater than 40% were retained. Since both genomes were annotated with different pipelines, some genes that had been predicted in one genome could have been missed in the other genome. We checked if genes for which no orthologs were found using BLASTP could be retrieved in the genomic sequences. These genes were thus aligned with genomes using TBLASTN and the matching regions were realigned using EXONERATE73(model protein2genome: bestfit’ and cutoff identity equal to or greater than 70%). A second complementary approach was performed using BLAT.
Set of core grass genes: Orthologous genes between Sorghum bicolor v3.1 and ten other grass genomes Brachypodium distachyon v3.1, B. stacei v1.1, Oryza sativa v7_JGI, Oropetium thomaeum v1.0, Panicum hallii var FIL2 v2.0, P. virgatum v4.1, Setaria italica v2.2, S. viridis v1.1, Zea mays Ensembl-18, and Z. mays PH207 v1.1 were downloaded from Phytozome (https://phytozome.jgi.doe.gov/pz/portal.html). Phytozome uses the stand-alone InParanoid 4.1 software74, a BLAST-based algorithm to compute protein homology analysis with use_bootstrap set to 1 and the default parameters for other options to identify orthologous genes between each genome pair. S. bicolor genes with orthologs in all of the aforementioned grass species were considered as core grass genes in this study. Primary protein sequences (with the longest transcript) for core grass genes were obtained from Phytozome for further analysis.
Microcolinearity of sugarcane and sorghum genes: BAC sequences from the sugarcane STP were aligned with BLASTN on the sorghum genome to identify orthologous genomic regions between the two genomes. Then the gene content was
compared for each orthologous region. Sugarcane/sorghum orthologous gene pairs located in the expected orthologous regions were considered as colinear genes, while orthologous gene pairs located in regions that differed from those expected were considered as non-collinear genes.
Divergence timing: Protein sequences from sugarcane gene models were aligned with the sorghum proteome using BLASTP and best bidirectional mutual hits were retained. The 17,704 resulting orthologous gene pairs were realigned using CLUSTALW (https://www.ebi.ac.uk/Tools/msa/clustalw2/). These alignments were used to guide nucleic coding sequence alignments with PAL2NAL (http://www. bork.embl.de/pal2nal/). Synonymous substitution rates (Ks) were calculated using the Nei–Gojobori method implemented in the PAML package. All of these steps were automated with an available Python script (synonymous_calc.py,https:// github.com/tanghaibao/bio-pipeline/tree/master/synonymous_calculation). Divergence time (T) was then estimated using T= MKs/2k, where MKs represents the median Ks (0.1268) calculated from 17,704 orthologous gene pairs and k is the substitution rate of 6.5 × 10⁻⁹per site and per year75.
Code availability. The pipeline developed to perform the complete process of SNP mapping, calling, andfiltering is available athttps://github.com/
SouthGreenPlatform/VcfHunter/.
Data availability. BAC and STP sequences, as well as gene annotations are available on the sugarcane genome hub (http://sugarcane-genome.cirad.fr). BAC sequences have also been deposited in the European Nucleotide Archive (ENA) at the EMBL-European Bioinformatics Institute under accession number ERZ654945.
Received: 8 January 2018 Accepted: 13 June 2018
References
1. European Commission of Agriculture and rural development. Sugar.http://ec. europa.eu/agriculture/sugar/index_en.htm.
2. Gouy, M., Nibouche, S., Hoarau, J. H., & Costet, L. in Translational Genomics for Crop Breeding: Abiotic Stress, Yield and Quality, Vol. 2, (eds. Varshney, R. & Tuberosa, R.) Ch. 13, 211–237 (John Wiley & Sons, Ames, Chichester and Oxford, 2013).
3. D’Hont, A., Ison, D., Alix, K., Roux, C. & Glaszmann, J. C. Determination of basic chromosome numbers in the genus Saccharum by physical mapping of ribosomal RNA genes. Genome 41, 221–225 (1998).
4. Screenivasan, T. V., Ahloowalia, B. S. & Heinz, D. J. Sugarcane improvement through breeding. Cytogenetics 5, 211–253 (1987).
5. Brandes, E. Origin, dispersal and use in breeding of the Melanesian garden sugarcane and their derivatives, Saccharum officinarum L. Proc. Int. Soc. Sugarcane Technol. 9, 709–750 (1956).
6. Grivet, L., Glaszmann, J. C. & D’Hont, A. in Darwin’s Harvest: New Approaches to the Origins, Evolution and Conservation of Crops (ed Motley, T. J.) 49–66 (Columbia University Press, New York, 2006).
7. Panje, R. & Babu, C. Studies in Saccharum spontaneum. Distribution and geographical association of chromosome numbers. Cytologia 25, 152–172 (1960).
8. Bremer, G. A cytological investigation of some species and species-hybrids of the genus Saccharum. Genetica 5, 273–326 (1923).
9. Bremer, G. Problems in breeding and cytology of sugarcane. Euphytica 10, 59–78 (1961).
10. D’Hont, A. et al. Characterisation of the double genome structure of modern sugarcane cultivars (Saccharum spp.) by molecular cytogenetics. Mol. Gen. Genet. 250, 405–413 (1996).
11. Piperidis, G., Piperidis, N. & D’Hont, A. Molecular cytogenetic investigation of chromosome composition and transmission in sugarcane. Mol. Genet. Genom. 284, 65–73 (2010).
12. Zhang, J. et al. in Sugarcane: Physiology, Biochemistry, and Functional Biology (eds. Moore, P. H. & Botha, F. C) Ch. 23, 623–643 (John Wiley & Sons, Ames, Chichester and Oxford, 2014).
13. Wu, K. et al. The detection and estimation of linkage in polyploids using single-dose restriction fragment. Theor. Appl. Genet. 83, 294–300 (1992). 14. Aitken, K. S., Jackson, P. A. & McIntyre, C. L. A combination of AFLP and
SSR markers provides extensive map coverage and identification of homo(eo) logous linkage groups in a sugarcane cultivar. Theor. Appl. Genet. 110, 789–801 (2005).
15. Aitken, K. S. et al. A comprehensive genetic map of sugarcane that provides enhanced map coverage and integrates high-throughput Diversity Array Technology (DArT) markers. BMC Genomics 15, 152 (2014). 16. D’Hont, A. et al. A molecular approach to unraveling the genetics of
sugarcane, a complex polyploid of the Andropogoneae tribe. Genome 37, 222–230 (1994).
17. Grivet, L. et al. RFLP mapping in cultivated sugarcane (Saccharum spp.): genome organization in a highly polyploid and aneuploid interspecific hybrid. Genetics 142, 987–1000 (1996).
18. Hoarau, J. Y. et al. Genetic dissection of a modern sugarcane cultivar (Saccharum spp.).I. Genome mapping with AFLP markers. Theor. Appl. Genet. 103, 84–87 (2001).
19. Jannoo, N., Grivet, L., David, J., D’Hont, A. & Glaszmann, J. C. Differential chromosome pairing affinities at meiosis in polyploid sugarcane revealed by molecular markers. Heredity 93, 460–467 (2004).
20. Raboin, L. M. et al. Genetic mapping in sugarcane, a high polyploid, using bi-parental progeny: identification of a gene controlling stalk colour and a new rust resistance gene. Theor. Appl. Genet. 112, 1382–1391 (2006).
21. Rossi, M. et al. Genomic distribution and characterization of EST-derived resistance gene analogs (RGAs) in sugarcane. Mol. Genet. Genom. 269, 406–419 (2003).
22. Burner, D. M. & Legendre, B. L. Cytogenetic and fertlity characteristics of elite sugarcane clones. Sugar Cane 1, 6–10 (1994).
23. Price, S. Cytogenetics of modern sugarcanes. Econ. Bot. 17, 97–105 (1963). 24. Dufour, P. et al. Construction of a composite sorghum genome map and
comparison with sugarcane, a related complex polyploid. Theor. Appl. Genet. 94, 409–418 (1997).
25. Guimaraes, C. T., Sills, G. R. & Sobral, B. W. Comparative mapping of Andropogoneae: Saccharum L. (sugarcane) and its relation to sorghum and maize. Proc. Natl Acad. Sci. USA 94, 14261–14266 (1997).
26. Le Cunff, L. et al. Diploid/polyploid syntenic shuttle mapping and haplotype-specific chromosome walking toward a rust resistance gene (Bru1) in highly polyploid sugarcane (2n approximately 12x approximately 115). Genetics 180, 649–660 (2008).
27. Ming, R. et al. Detailed alignment of saccharum and sorghum chromosomes: comparative organization of closely related diploid and polyploid genomes. Genetics 150, 1663–1682 (1998).
28. Aitken, K. S. et al. Genetic control of yield related stalk traits in sugarcane. Theor. Appl. Genet. 117, 1191–1203 (2008).
29. Hoarau, J. Y. et al. Genetic dissection of a modern sugarcane cultivar (Saccharum spp.).II. Detection of QTLs for yield components. Theor. Appl. Genet. 105, 1027–1037 (2002).
30. Ming, R., Liu, S. C., Moore, P. H., Irvine, J. E. & Paterson, A. H. QTL analysis in a complex autopolyploid: genetic control of sugar content in sugarcane. Genome Res. 11, 2075–2084 (2001).
31. Piperidis, N. et al. Comparative genetics in sugarcane enables structured map enhancement and validation of marker-trait associations. Mol. Breed. 21, 233–247 (2008).
32. Al-Janabi, S. M. et al. Identification of a major quantitative trait locus (QTL) for yellow spot (Mycovellosiella koepkei) disease resistance in sugarcane. Mol. Breed. 19, 1–14 (2007).
33. Costet, L., Raboin, L. M., Payet, M., D’Hont, A. & Nibouche, S. Mapping of a major QTA for resistance to the yellow leaf disease of sugarcane caused by the Sugarcane yellow leaf virus (Luteoviridae). Plant Breed. 131, 637–640 (2012). 34. Daugrois, J. H. et al. A putative major gene for rust resistance linked with a RFLP marker in sugarcane cultivar‘R570’. Theor. Appl. Genet. 92, 1059–1064 (1996).
35. Debibakas, S. et al. Prospecting sugarcane resistance to Sugarcane yellow leaf virus by genome-wide association. Theor. Appl. Genet. 127, 1719–1732 (2014). 36. Wei, X., Jackson, P. A., McIntyre, C. L., Aitken, K. S. & Croft, B. Associations between DNA markers and resistance to diseases in sugarcane and effects of population substructure. Theor. Appl. Genet. 114, 155–164 (2006). 37. Gouys, M. et al. Genome wide association mapping of agro-morphological
and disease resistance traits in sugarcane. Euphytica 202, 269–284 (2015). 38. Gouy, M. et al. Experimental assessment of the accuracy of genomic selection
in sugarcane. Theor. Appl. Genet. 126, 2575–2586 (2013).
39. Jannoo, N. et al. Molecular investigation of the genetic base of sugarcane cultivars. Theor. Appl. Genet. 99, 171–184 (1999).
40. Raboin, L. M., Pauquet, J., Butterfield, M., D’Hont, A. & Glaszmann, J. C. Analysis of genome-wide linkage disequilibrium in the highly polyploid sugarcane. Theor. Appl. Genet. 116, 701–714 (2008).
41. Vettore, A. L. et al. Analysis and functional annotation of an expressed sequence tag collection for tropical crop sugarcane. Genome Res. 13, 2725–2735 (2003).
42. Figueira, T. R. et al. A BAC library of the SP80-3280 sugarcane variety (saccharum sp.) and its inferred microsynteny with the sorghum genome. BMC Res. Notes 5, 185 (2012).
43. Tomkins, J. P. et al. A bacterial artificial chromosome library for sugarcane. Theor. Appl. Genet. 99, 419–424 (1999).
44. Grivet, L. & Arruda, P. Sugarcane genomics: depicting the complex genome of an important tropical crop. Curr. Opin. Plant Biol. 5, 122–127 (2002). 45. Souza, G. M. et al. The sugarcane genome challenge: strategies for sequencing
a highly complex genome. Trop. Plant Biol. 4, 145–156 (2011).
46. D’Hont, A. & Glaszmann, J. C. Sugarcane genome analysis with molecular markers, afirst decade of research. Proc. Int. Soc. Sugarcane Technol. 24, 556–559 (2001).
47. Paterson, A. H. et al. The Sorghum bicolor genome and the diversification of grasses. Nature 457, 551–556 (2009).
48. Jannoo, N. et al. Orthologous comparison in a gene-rich region among grasses reveals stability in the sugarcane polyploid genome. Plant J. 50, 574–585 (2007). 49. Garsmeur, O. et al. High homologous gene conservation despite extreme
autopolyploid redundancy in sugarcane. New Phytol. 189, 629–642 (2011). 50. Kim, C. et al. Comparative analysis of Miscanthus and Saccharum reveals a
shared whole-genome duplication but different evolutionary fates. Plant Cell 26, 2420–2429 (2014).
51. Wang, J. et al. Microcollinearity between autopolyploid sugarcane and diploid sorghum genomes. BMC Genomics 11, 261 (2010).
52. De Setta, N. et al. Building the sugarcane genome for biotechnology and identifying evolutionary trends. BMC Genomics 15, 540 (2014).
53. Vilela, M. M. et al. Analysis of three sugarcane homo/homeologous regions suggests independent polyploidization events of Saccharum officinarum and Saccharum spontaneum. Genome Biol. Evol. 9, 266–278 (2017).
54. van Oeveren, J. et al. Sequence-based physical mapping of complex genomes by whole genome profiling. Genome Res. 21, 618–625 (2011).
55. Xu, G., Ma, H., Nei, M. & Kong, H. Evolution of F-box genes in plants: different modes of sequence divergence and their relationships with functional diversification. Proc. Natl Acad. Sci. USA 106, 835–840 (2009).
56. Zhang, Y., Xia, R., Kuang, H. & Meyers, B. C. The diversification of plant NBS-LRR defense genes directs the evolution of microRNAs that target them. Mol. Biol. Evol. 33, 2692–2705 (2016).
57. Zhang, J. et al. Genome size variation in three Saccharum species. Euphytica 185, 511–519 (2012).
58. Grivet, L., Glaszmann, J. C. & Arruda, P. Sequence polymorphism from EST data in sugarcane: afine analysis of 6-phosphogluconate dehydrogenase genes. Genet. Mol. Biol. 24, 161–167 (2001).
59. Glaszmann, J. C. et al. Comparative genome analysis between several tropical grasses. Euphytica 96, 13–21 (1997).
60. Ha, S. et al. Quantitative chromosome map of the polyploid Saccharum spontaneum by multicolorfluorescence in situ hybridization and imaging methods. Plant Mol. Biol. 39, 1165–1173 (1999).
61. Mandakova, T., Heenan, P. B. & Lysak, M. A. Island species radiation and karyotypic stasis in Pachycladon allopolyploids. BMC Evol. Biol. 10, 367 (2010). 62. Wang, H. & Bennetzen, J. L. Centromere retention and loss during the descent
of maize from a tetraploid ancestor. Proc. Natl Acad. Sci. USA 109, 21004–21009 (2012).
63. Altschul, S. F. et al. Gapped BLAST and PSI-BLAST: a new generation of protein database search programs. Nucleic Acids Res. 25, 3389–3402 (1997). 64. Bugos, R. C. et al. RNA isolation from plant tissues recalcitrant to extraction in
guanidine. Biotechniques 19, 734–737 (1995).
65. Cardoso-Silva, C. B. et al. De novo assembly and transcriptome analysis of contrasting sugarcane varieties. PLoS ONE 9, e88462 (2014).
66. Kohany, O., Gentles, A. J., Hankus, L. & Jurka, J. Annotation, submission and screening of repetitive elements in Repbase: RepbaseSubmitter and Censor. BMC Bioinformatics 7, 474 (2006).
67. Novak, P., Neumann, P., Pech, J., Steinhaisl, J. & Macas, J. RepeatExplorer: a Galaxy-based web server for genome-wide characterization of eukaryotic repetitive elements from next-generation sequence reads. Bioinformatics 29, 792–793 (2013).
68. Ma, J., Devos, K. M. & Bennetzen, J. L. Analyses of LTR-retrotransposon structures reveal recent and rapid genomic DNA loss in rice. Genome Res. 14, 860–869 (2004).
69. Fu, L., Niu, B., Zhu, Z., Wu, S. & Li, W. CD-HIT: accelerated for clustering the next-generation sequencing data. Bioinformatics 28, 3150–3152 (2012). 70. Ooijen, J. W. V. Multipoint maximum likelihood mapping in a full-sib family
of an outbreeding species. Genet Res. 93, 343–349 (2011). 71. Wu, Y., Bhat, P. R., Close, T. J. & Lonardi, S. Efficient and accurate
construction of genetic linkage maps from the minimum spanning tree of a graph. PLoS Genet. 4, e1000212 (2008).
72. Krzywinski, M. et al. Circos: an information aesthetic for comparative genomics. Genome Res. 19, 1639–1645 (2009).
73. Slater, G. S. & Birney, E. Automated generation of heuristics for biological sequence comparison. BMC Bioinformatics 6, 31 (2005).
74. Sonnhammer, E. L. & Ostlund, G. InParanoid 8: orthology analysis between 273 proteomes, mostly eukaryotic. Nucleic Acids Res. 43, D234–D239 (2015).
75. Gaut, B. S., Morton, B. R., McCaig, B. C. & Clegg, M. T. Substitution rate comparisons between grasses and palms: synonymous rate differences at the nuclear gene Adh parallel rate differences at the plastid gene rbcL. Proc. Natl Acad. Sci. USA 93, 10274–10279 (1996).
Acknowledgements
We thank the International Consortium for Sugarcane Biotechnology forfinancial support of this work. This work was supported by the South Green Bioinformatics platform (http://southgreen.cirad.fr). The work conducted by the Joint BioEnergy Institute and the Joint Genome Institute was supported by the Office of Science of the U. S. Department of Energy under Contract No. DE-AC02-05CH11231 with the Lawrence Berkeley National Laboratory.
Author contributions
O.G. performed WGP analysis, MTP selection, TE annotation, genetic mapping analysis, and comparative analyses with sorghum. E.V. and R.A. produced WGP data. J.G., B.P., K.A., R.A., D.S., M.-A.V.S., H.B., B.S., E.V., R.H., and J.S. performed BAC DNA extraction, pooling, sequencing, and assembly. M.-A.V.S. provided a set of annotated TE. K.S. provided WGS data. B.P., C.C., and C.H. produced RNA-Seq data. G.D., N.Y., and O.G. performed protein-coding gene annotation and analyses. A.S. identified the set of core grass genes. G.D. performed website development. J.J., Y.C., and A.H. assembled the STP and assigned contigs to ancestral species. L.C., C.H., A.K., G.M., A.C., C.T., and O.G. performed plant material development, DNA extraction, DArTseq and GBS genotyping, and SNP calling. A.D.H. and O.G. interpreted data and wrote the paper. J.-C.G., N.Y., and J.S. revised the manuscript. A.D.H. designed and coordinated the project.
Additional information
Supplementary Informationaccompanies this paper at https://doi.org/10.1038/s41467-018-05051-5.
Competing interests:The authors declare no competing interests.
Reprints and permissioninformation is available online athttp://npg.nature.com/ reprintsandpermissions/
Publisher's note:Springer Nature remains neutral with regard to jurisdictional claims in published maps and institutional affiliations.
Open Access This article is licensed under a Creative Commons Attribution 4.0 International License, which permits use, sharing, adaptation, distribution and reproduction in any medium or format, as long as you give appropriate credit to the original author(s) and the source, provide a link to the Creative Commons license, and indicate if changes were made. The images or other third party material in this article are included in the article’s Creative Commons license, unless indicated otherwise in a credit line to the material. If material is not included in the article’s Creative Commons license and your intended use is not permitted by statutory regulation or exceeds the permitted use, you will need to obtain permission directly from the copyright holder. To view a copy of this license, visithttp://creativecommons.org/ licenses/by/4.0/.