HAL Id: hal-01879955
https://hal-univ-rennes1.archives-ouvertes.fr/hal-01879955
Submitted on 16 Jul 2019
HAL is a multi-disciplinary open access
archive for the deposit and dissemination of
sci-entific research documents, whether they are
pub-lished or not. The documents may come from
teaching and research institutions in France or
abroad, or from public or private research centers.
L’archive ouverte pluridisciplinaire HAL, est
destinée au dépôt et à la diffusion de documents
scientifiques de niveau recherche, publiés ou non,
émanant des établissements d’enseignement et de
recherche français ou étrangers, des laboratoires
publics ou privés.
cell secretome and enhances response to chemotherapy
Susan E. Logue, Eoghan P. Mcgrath, Patricia Cleary, Stephanie Greene,
Katarzyna Mnich, Aitor Almanza, Eric Chevet, Roisin M. Dwyer, Anup
Oommen, Patrick Legembre, et al.
To cite this version:
Susan E. Logue, Eoghan P. Mcgrath, Patricia Cleary, Stephanie Greene, Katarzyna Mnich, et al..
Inhi-bition of IRE1 RNase activity modulates the tumor cell secretome and enhances response to
chemother-apy. Nature Communications, Nature Publishing Group, 2018, 9 (1), pp.3267.
�10.1038/s41467-018-05763-8�. �hal-01879955�
Inhibition of IRE1 RNase activity modulates the
tumor cell secretome and enhances response to
chemotherapy
Susan E. Logue
1,2
, Eoghan P. McGrath
1,2
, Patricia Cleary
1,2
, Stephanie Greene
3
, Katarzyna Mnich
1,2
,
Aitor Almanza
1,2
, Eric Chevet
4,5
, Róisín M. Dwyer
6
, Anup Oommen
2
, Patrick Legembre
4,5
,
Florence Godey
4,5
, Emma C. Madden
1,2
, Brian Leuzzi
1,2
, Joanna Obacz
4,5
, Qingping Zeng
7
,
John B. Patterson
3
, Richard Jäger
8
, Adrienne M. Gorman
1,2
& Afshin Samali
1,2
Triple-negative breast cancer (TNBC) lacks targeted therapies and has a worse prognosis
than other breast cancer subtypes, underscoring an urgent need for new therapeutic targets
and strategies. IRE1 is an endoplasmic reticulum (ER) stress sensor, whose activation is
predominantly linked to the resolution of ER stress and, in the case of severe stress, to cell
death. Here we demonstrate that constitutive IRE1 RNase activity contributes to basal
pro-duction of pro-tumorigenic factors IL-6, IL-8, CXCL1, GM-CSF, and TGF
β2 in TNBC cells. We
further show that the chemotherapeutic drug, paclitaxel, enhances IRE1 RNase activity and
this contributes to paclitaxel-mediated expansion of tumor-initiating cells. In a xenograft
mouse model of TNBC, inhibition of IRE1 RNase activity increases paclitaxel-mediated tumor
suppression and delays tumor relapse post therapy. We therefore conclude that inclusion of
IRE1 RNase inhibition in therapeutic strategies can enhance the effectiveness of current
chemotherapeutics.
DOI: 10.1038/s41467-018-05763-8
OPEN
1Apoptosis Research Centre, National University of Ireland Galway, University Road, Galway H91 TK33, Ireland.2School of Natural Sciences, National
University of Ireland Galway, University Road, Galway H91 TK33, Ireland.3Fosun Orinove PharmaTech Inc., 3537 Old Conejo Road, Suite 104, Newbury Park, CA 91320, USA.4Inserm U1242, Chemistry Oncogenesis Stress Signaling, Université de Rennes 1, Avenue de la Bataille Flandres Dunkerque, 35042 Rennes, France.5Centre de Lutte Contre le Cancer Eugène Marquis, Avenue de la Bataille Flandres Dunkerque, 35042 Rennes, France.6LAM 2015, Discipline of Surgery, Lambe Institute for Translational Research, National University of Ireland Galway, Costello Road, Galway H91 V4AY, Ireland.7Fosun Orinove
PharmaTech Inc., Suite 211, Building A4, 218 Xinghu St., Suzhou Industrial Park, Jiangsu 215123, China.8Hochschule Bonn-Rhein-Sieg, University of Applied
Sciences, Department of Natural Sciences, von-Liebig-Straße 20, 53359 Rheinbach, Germany. Correspondence and requests for materials should be addressed to A.S. (email:afshin.samali@nuigalway.ie)
123456789
I
nositol requiring enzyme 1 alpha (referred to as IRE1
here-after, also known as ERN1), an endoplasmic reticulum (ER)
resident type I transmembrane protein, is composed of an
N-terminal ER luminal domain and a C-N-terminal cytosolic domain
that possesses both kinase and endoribonuclease (RNase)
activ-ities. IRE1 function has been studied extensively during ER stress
where it constitutes an important pro-survival arm of the
unfolded protein response (UPR)
1. Accumulation of unfolded
proteins in the ER (ER stress) triggers IRE1 dimerization and
trans-autophosphorylation facilitating its activation
2. Activated
IRE1 cleavesX-Box Binding Protein 1 (XBP1) mRNA via its
RNase activity
3. Subsequent re-ligation of XBP1 mRNA, by RNA
2′,3′-cyclic phosphate and 5′-OH ligase (RTCB), permits
trans-lation of a transcription factor referred to as spliced XBP1
(XBP1s)
4. XBP1s has predominantly been studied within the
context of the UPR where its target genes encode mainly adaptive,
pro-survival factors involved in ER homeostasis
5. However,
recent studies indicate that XBP1s has a much broader range of
target genes than previously appreciated. For example, selective
ablation of IRE1/XBP1s signaling in lipopolysaccharide
(LPS)-treated macrophages reduced interleukin (IL)-6 and IL-8
pro-duction, thus attenuating pro-inflammatory responses
6. In
addi-tion to XBP1 splicing, IRE1 RNase activity facilitates selective
degradation of RNA by directly cleaving cytosolic RNA species, in
a process referred to as regulated IRE1 dependent decay (RIDD)
7.
Similar to the IRE1–XBP1s axis, RIDD signaling has been
pre-dominantly examined in cellular stress responses where it is
associated with both pro-survival and pro-death roles depending
upon the duration and severity of the initiating stress
8,9.
The UPR, and in particular, the IRE1–XBP1 branch, has been
linked to tumor development, progression, and post-therapy
responses in a wide range of cancers including breast, prostate,
and pancreatic cancer
10–13. The precise mechanism by which
IRE1 RNase signaling promotes cancer progression in these
set-tings is not fully understood. Nevertheless, the IRE1–XBP1s
sig-naling axis has emerged as a potential therapeutic target in cancer
leading to the development of small molecule inhibitors targeting
the IRE1 RNase domain
14–17. However, the majority of current
IRE1 RNase inhibitors have poor pharmacodynamic properties
rendering their use as clinical agents unlikely.
In this study, we evaluate the outcome of blocking IRE1 RNase
activity in triple-negative breast cancer (TNBC) cells using a small
molecule inhibitor—MKC8866. MKC8866 is a selective IRE1
RNase inhibitor that exhibits acceptable pharmacokinetic and
toxicity profiles, making it an attractive agent for pre-clinical
development. Inhibition of IRE1 RNase activity by MKC8866 in
breast cancer cells leads to the decreased production of
pro-tumorigenic factors including IL-6, IL-8, chemokine (C-X-C)
ligand 1 (CXCL1), transforming growth factor
β 2 (TGFβ2), and
granulocyte-macrophage-colony-stimulating-factor
(GM-CSF),
linking constitutive IRE1 RNase activity to maintenance of a
pro-tumorigenic secretome.
Chemotherapy-induced modulation of the secretome is a
known promoter of tumor relapse
18,19. Paclitaxel, a commonly
used chemotherapeutic for the treatment of TNBC, has been
linked to the production of pro-tumorigenic factors
18,19. Our
results demonstrate that this occurs in a manner partly dependent
on IRE1 RNase activity, leading us to propose that the
combi-nation of IRE1 RNase inhibitors with chemotherapeutics, such as
paclitaxel, may be more efficacious than chemotherapy alone.
Indeed, we observe decreased mammosphere formation
post-paclitaxel treatment in MKC8866-treated TNBC cells compared
to those treated with vehicle alone. Likewise, in vivo, MKC8866
administered in combination with paclitaxel enhances the
effec-tiveness of paclitaxel and limits tumor regrowth upon cessation of
paclitaxel treatment.
Results
Breast cancer cells exhibit constitutive IRE1 RNase activity. A
panel of breast cancer cell lines encompassing the main molecular
subtypes (estrogen receptor positive—MCF7, T47D, Human
Epidermal growth factor Receptor 2 (HER2) positive—SKBR3
and triple negative—MDA-MB-231, MDA-MB-468) was
exam-ined for basal IRE1 RNase activity by assessing levels of spliced
XBP1. In all breast cancer lines tested, XBP1s mRNA was
detected, to varying degrees, with the highest levels present in
TNBC cells (Fig.
1
a). Examination of XBP1s protein expression
revealed a similar pattern with the highest expression evident in
the TNBC cell lines MDA-MB-231 and MDA-MB-468 (Fig.
1
b).
MCF10A, a spontaneously immortalized, transformed,
non-tumorigenic breast epithelial cell line, did not display basal IRE1
RNase activity (Fig.
1
a, b). However, treatment of MCF10A cells
with the ER stress inducer, Tunicamycin (Tm), triggered
sig-nificant XBP1 splicing, indicating that IRE1 RNase, while not
constitutively active, is functional in these cells (Fig.
1
a, b). In
addition to commonly used breast cancer cell lines IRE1 RNase
activity was also assessed by quantitative PCR (Q-PCR) in a range
of primary patient samples. Similar to the results obtained in the
breast cancer cell lines, the ratio of spliced to total XBP1 was
highest in samples derived from basal-like breast cancers (most of
which are TNBC) compared to luminal samples, and
tumor-associated normal tissue (TAN) (Fig.
1
c).
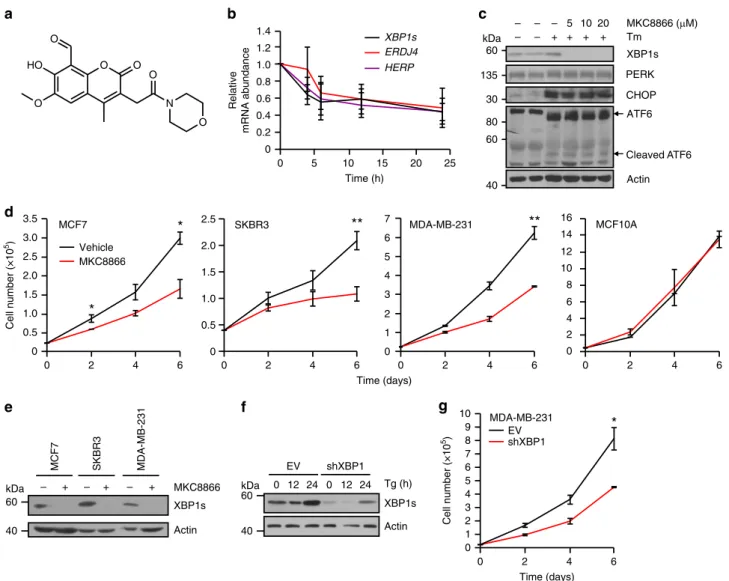
Inhibition of IRE1 reduces breast cancer cell proliferation.
MKC8866 (Fig.
2
a) is a member of a small molecule IRE1 RNase
inhibitor family
first described by Patterson and colleagues in
2011
14. It is a salicylaldehyde analog, that binds to IRE1 within
the RNase catalytic site and inhibits both XBP1 splicing and
RIDD activity
14. Addition of MKC8866 rapidly attenuated basal
IRE1 RNase activity in MDA-MB-231 cells, as demonstrated by
decreased levels of XBP1s transcript and its downstream targets
endoplasmic reticulum DNA J domain-containing protein 4
(ERDJ4, also known as DNAJB9) and homocysteine-responsive
ER protein with ubiquitin like domain 1 (HERP, also known as
HERPUD1) (Fig.
2
b). Addition of MKC8866 blocked Tm-induced
IRE1-mediated signaling but did not affect Tm-induced
activation of the other two arms of the UPR, protein kinase R
(PKR)-like endoplasmic reticulum kinase (PERK) or activating
transcription factor 6 (ATF6) (Fig.
2
c). Indeed, neither PERK
phosphorylation and downstream CHOP induction, nor ATF6
processing were affected by MKC8866, underscoring the
selec-tivity of MKC8866 for IRE1 under both basal and stress
condi-tions. To examine the effect of the constitutive IRE1 signaling
observed in breast cancer cells, IRE1 RNase activity was blocked
by addition of MKC8866 and the outcome on cell proliferation/
viability was assessed (Fig.
2
d, e, Supplementary Fig. 1a, b).
Addition of MKC8866 decreased proliferation of all breast cancer
cell lines tested without inducing cell death (Fig.
2
d,
Supple-mentary Fig. 1a). Cell cycle analysis, using
5-ethynyl-2′-deox-yuridine (EdU) incorporation, indicated that inhibition of IRE1
RNase activity by MKC8866 reduced the number of cells entering
S phase (Supplementary Fig. 1b). In contrast, addition of
MKC8866 to MCF10A cells, which do not display constitutive
IRE1 RNase activity, did not alter cell proliferation (Fig.
2
d,
Supplementary Fig. 1c). Knockdown of XBP1 or IRE1 in
MDA-MB-231 cells similarly reduced cell proliferation when compared
to controls (Fig.
2
f, g, Supplementary Fig. 1d-g).
IRE1 gene signature associates with basal-like breast cancer.
Transcriptomic data obtained from MKC8866 versus vehicle-only
microarray experiments identified 401 differentially expressed
probe-sets representing 395 genes. These initial candidate
markers were tested in a training dataset containing gene
expression profiles of a panel of 27 breast cancer cell lines. Genes
with a strong positive or negative correlation with IRE1 activity
were further prioritized using BioInfoMiner to generate an
83-gene signature predictive of IRE1 activity (IRE1 83-gene signature)
(Supplementary Table 1). This IRE1 gene signature was applied to
the 27 breast cancer cell lines, ranking them based on their
pre-dicted level of IRE1 RNase activity (Fig.
3
a). The resultant
ranking largely mirrored results achieved by western blotting for
XBP1s (Fig.
1
b) with those cell lines representative of TNBC
being ranked highest (MDA-MB-231) while those lines
repre-sentative of HER2-positive (SKBR3) and estrogen
receptor-positive (T47D) ranked lower. We then applied the IRE1 gene
signature to a cohort of 595 breast cancer tumors from The
Cancer Genome Atlas (TCGA) database and, using the same
approach, identified two distinct subsets of patients indicative of
low (n
= 79) and high IRE1 (n = 63) activity (Fig.
3
b). Analysis of
the breast cancer subtype in each, based on PAM50 classification
criteria
20, revealed that a high IRE1 gene signature associated
exclusively with basal-like breast cancers, while tumors associated
with a low IRE1 gene signature were predominantly of the
luminal subtype (Fig.
3
c). Gene set enrichment analysis (GSEA)
indicated cancers with an elevated IRE1 gene signature associated
with a more mesenchymal-like phenotype, increased invasiveness
and a worse clinical outcome (Supplementary Fig. 2).
IRE1 activity induces production of pro-inflammatory factors.
To identify biological processes associated with constitutive IRE1
RNase activity in breast cancer patients, we again applied the
IRE1 gene signature to the 595 breast cancer tumors from TCGA
database. An IRE activity score for each tumor was predicted
based on expression levels of the 83 genes from the IRE1 gene
signature and the Pearson correlation coefficient was calculated
between the score and every other gene across 595 tumors to
produce a ranked gene list. We then performed GSEA using gene
ontology terms on the ranked gene list. Using this approach, we
found that predicted IRE1 activity strongly associates with the
expression of genes involved in inflammatory responses
(Sup-plementary Fig. 3). We also noted that genes encoding
pro-inflammatory factors (IL6, IL8, and TGFB2) comprised a subset
of the downregulated genes in the microarray experiment,
sug-gesting a link between IRE1 RNase activity and the production of
pro-inflammatory factors in TNBC cells.
Comparison of IL6, IL8, GM-CSF, CXCL1, and TGFB2 mRNA
expression levels between the IRE1 RNase high and IRE1 RNase
low activity populations within the 595 patient cohort from
TCGA revealed a significantly higher expression level of each
pro-inflammatory factor in the IRE1 RNase high grouping (Fig.
3
d).
Examination of pro-tumorigenic cytokine and XBP1s expression,
via immunohistochemistry, showed that high XBP1s expression
positively correlates with elevated IL-8 and CXCL1 staining in
human TNBC tissue sections (Fig.
3
e, f) supporting our in silico
findings.
To further investigate this link we generated conditioned
medium from MDA-MB-231 cells following 48 h treatment with
MKC8866 or vehicle alone. Once equal cell number post
treatment was confirmed (Supplementary Fig. 4a), the
condi-tioned medium was applied to a cytokine array assaying 102
different factors. Using this approach we observed reduced levels
of IL-6, IL-8, GM-CSF, and CXCL1 in MKC8866 conditioned
medium compared to vehicle-only conditioned medium (TGFβ2
was not present on the array) (Fig.
4
a). Using a combination of
ELISAs and Q-PCR, we confirmed that inhibition of IRE1 RNase
activity by MKC8866 treatment reduced the production and
secretion of IL-6, IL-8, CXCL1, GM-CSF, and TGFβ2 in
MDA-MB-231 cells (Fig.
4
b–d). We also tested the effect of MKC8866
addition on IL-6, IL-8, CXCL1, GM-CSF, and TGFβ2 secretion in
three additional TNBC cell lines (MDA-MB-468, BT-549, and
*
300 bp kDa 500 bp 40a
b
c
MCF7 T47D SKBR3 MCF10A MDA-MB-231 MDA-MB-468 XBP1s Actin MCF7 SKBR3 MDA-MB-231 MCF10A – Tm + Tm – Tm + Tm XBP1s GAPDH XBP1u 0.0 0.5 1.0 1.5 2.0Basal-like Luminal TAN
XBP1s/XBP1
total mRNA
50 400 bp
*
Fig. 1 Breast cancer cells exhibit constitutive IRE1 RNase activity. a Expression of spliced and unsplicedXBP1 mRNA was assessed in a panel of breast cancer cell lines (MCF7, SKBR3, MDA-MB-231) and the non-tumorigenic breast epithelial cell line MCF10A via RT-PCR. Tunicamycin (Tm) (1μg ml−1 )-treated MCF10A cells act as a positive control forXBP1 splicing. GAPDH was used as a loading control. b Immunoblotting of XBP1s in a panel of breast cancer cell lines (MCF7, T47D, SKBR3, MDA-MB-231, and MDA-MB-468) and the non-tumorigenic breast epithelial cell line MCF10A. Tm (1μg ml−1 )-treated MCF10A cells act as a positive control for XBP1 splicing. Actin was used as a loading control.c Q-PCR quantification of the relative mRNA levels of spliced to totalXBP1 in RNA samples obtained from basal-like tumor tissue (n = 5), luminal tumor tissue (n = 4), and tumor-associated normal (TAN) tissue (n = 4). Results shown for a and b are representative of three independent experiments. *P < 0.05 based on a pairwise single factor ANOVA tests comparing each tissue type. Error bars represent s.e.m.
HCC1806). However, CXCL1 was the only common factor
significantly reduced by MKC8866 (Fig.
4
e) in all cell lines tested,
suggesting IRE1 RNase activity may be of particular importance
in regulating CXCL1 production in TNBC cells.
To validate that the effect of MKC8866 on cytokine production
was indeed a consequence of reduced IRE1 RNase signaling we
knocked down IRE1 expression in MDA-MB-231 cells by siRNA
and examined secretion of IL-6, IL-8, TGFβ2, GM-CSF, and
CXCL1. With the exception of TGFβ2, IRE1 knockdown reduced
the secretion of each cytokine to levels observed in non-targeting
siRNA controls (NC) treated with MKC8866 (Supplementary
Fig. 4b-d). In agreement with these data, analysis of transcript
levels demonstrated a similar pattern with a reduction in all
factors, again with the exception of TGFβ2, observed in IRE1
knockdown cells compared to NC (Supplementary Fig. 4e).
Likewise, knockdown of XBP1 reduced transcript levels of IL6,
IL8, GM-CSF, CXCL1, and to a lesser extent TGFB2
(Supplementary Fig. 4e). Since TGFβ2 regulation upon IRE1
knockdown differed to the results obtained with MKC8866, we
questioned whether this was an off-target effect of MKC8866. To
examine this, we added MKC8866 to both NC and IRE1
knockdown cells. While MKC8866 suppressed TGFβ2 secretion
in NC controls it failed to do so in IRE1 knockdown cells
verifying its reliance on IRE1 expression (Supplementary Fig. 4d).
It is possible that reducing protein expression of IRE1 triggers a
compensatory increase in TGFβ2 production through
IRE1-independent mechanisms.
Collectively, these
findings indicate that constitutive IRE1
RNase activity in MDA-MB-231 cells contributes to the
composition of the secretome and that addition of a small
molecule IRE1 RNase inhibitor, MKC8866, can limit the
production of secreted pro-tumorigenic factors. Since MKC8866
addition slowed the proliferation rate of MDA-MB-231 cells we
asked whether any of the cytokines identified as being regulated
**
*
*
**
*
O O HO O O N O O MKC8866 Vehicle SKBR3 – –b
c
d
a
Cleaved ATF6 XBP1s CHOP ATF6 Actin Tm MKC8866 (μM) PERKe
MKC8866 XBP1s Actin – + – + – + MCF7 SKBR3 MDA-MB-231 4 2 6 8 10 12 14 0 16 0 2 4 6 MCF10A 0 2 4 6 MDA-MB-231 7 6 5 4 3 2 1 0 Cell number (×10 5) Cell number (×10 5) 0 3.5 3.0 2.5 2.0 1.5 1.0 0.5 MCF7 0 2 4 6 0 2.5 2.0 1.5 1.0 0.5 0 2 4 6 Time (days) 0 5 10 15 20 25 Time (h) 0 0.2 0.4 0.6 0.8 1.0 1.2 1.4 Relative mRNA abundance XBP1s ERDJ4 HERP Tg (h) 0 12 24 0 12 24 XBP1s Actin EV shXBP1f
g
Time (days) MDA-MB-231 shXBP1 EV 0 1 2 3 4 5 6 7 8 9 10 6 0 2 4 – – + – + 5 + 20 + 10 135 60 kDa 40 60 30 80 60 40 kDa kDa 60 40Fig. 2 Inhibition of IRE1 reduces breast cancer cell proliferation. a Chemical structure of MKC8866. b MDA-MB-231 cells were treated with 20μM MKC8866 for 4, 6, 12, and 24 h after which RNA was extracted and levels ofXBP1s, ERDJ4, and HERP mRNA transcripts quantified by Q-PCR (n = 4). c T47D cells were treated for 24 h with 1μg ml−1Tm alone or in combination with increasing concentrations of MKC8866 (5, 10, 20μM) and cell lysates immunoblotted for XBP1s, PERK, CHOP, ATF6, and Actin.d MCF7 (n = 3), SKBR3 (n = 5), MDA-MB-231 (n = 2), and MCF10A (n = 3) cells were treated with 20μM MKC8866 or an equal volume of DMSO and cell proliferation monitored by cell counts every second day for 6 days. e MCF7, SKBR3, and MDA-MB-231 cells were treated with 20μM MKC8866 for 24 h and cell lysates immunoblotted for XBP1s and Actin. f Empty vector (EV) and XBP1shRNA MDA-MB-231 cells were treated for the indicated times with Tg (0.5μM) after which expression of XBP1s and Actin was determined by immunoblotting.g Proliferation of empty vector (EV) and XBP1shRNA MDA-MB-231 cells was monitored by cell counts every second day for 6 days (n = 3). Results shown forc, e, and f are representative of three independent experiments. *P < 0.05, **P < 0.01 and ***P < 0.001, based on a Student’s t test. Error bars represent s.e.m.
in an IRE1 RNase-dependent manner contributed to cell
proliferation. To this end, we incubated MDA-MB-231 cells with
either MKC8866 or neutralizing antibodies against each of
CXCL1, IL-6, IL-8, GM-CSF, and TGFβ2. We observed a
decrease in MDA-MB-231 cell proliferation, comparable to that
observed with MKC8866, following administration of
anti-CXCL1, IL-6, IL-8, GM-CSF, and TGFβ2 antibodies
(Supple-mentary Fig. 4f).
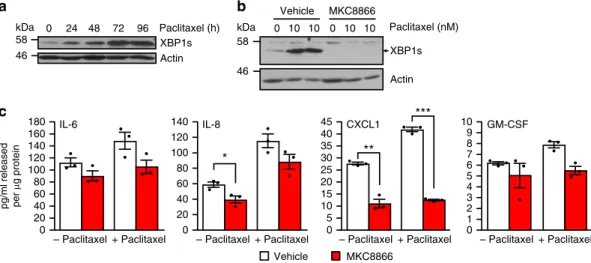
Paclitaxel increases IRE1-dependent cytokine secretion.
Neo-adjuvant chemotherapy is the current standard of care for TNBC
****
****
****
****
**
Up 0 50 100 150 200 120 100 80 60 40 20 0IL-8 staining intensity
XBP1s staining intensity R2 = 0.8 R2 = 0.7
e
0 50 100 150 200 120 100 80 60 40 20 0 CXCL1 staining intensity XBP1s staining intensityf
a
IRE1 high Basal-like NA Total = 63 IRE1 low HER2-enriched Luminal A Luminal B NA Total = 79c
b
IRE1high IRE1low IRE1high IRE1lowd
mRNA expression 4 0 –2 –4 2 –6 IL6 0 –2 –4 2 –6 –8 IL8 5 0 –5 –10 CXCL1 4 0 –2 –4 2 GM-CSF 4 0 –2 –4 2 TGFB2 Down DNTTIP2 TOMM40 MARS2 TIMM8A BYSL BOP1 SNAPC1 FOSL1 CYP1B1 DPH2 RRP1 PWP2 MRTO4 WDR3 PNPT1 PNO1 DDX21 ADAT2 TAF4B TEAD4 WDR4 SLC25A33 SLC7A5 EIF5A2 SERPINB2 PPAT YRDC KIAA0020 NIP7 FZD7 RIOK1 FOXC1 TOX LTV1 HSD17B7P2 TCEAL8 POP1 TRERF1 GTPBP4 RHOT1 C14orf1 JUP OCLN MANSC1 DHCR24 KIAA0430 GOLPH3L TMEM87B SLC5A6 MAML3 SORL1 FAM46C MKNK2 DBP MST1R BBS2 MAP3K13 TINAGL 1 LIPH ATP7A LMBRD1 CCNG2 RDH11 FAM63A MEGF9 SPDEF PBX1 SSBP2 ALDH6A1 MLLT3 KRT19 TCEA3 GDPD1 TP531NP1 ST6GALNAC2 BCAS3 REPS2 SLC1A1 GPR137B FDFT1 MAP3K12 PRICKLE2 ORAI3 BT.549 Hs578T MDA.MB.436 HCC.1806 MCF.7 CAL.51 HCC.38 HCC.1143 HCC.1937 HCC.70 HCC.1500 HCC.1419 UACC.812 T47D BT.474 HCC.1428 UACC.893 HCC.2218 HCC.1954 BT.20 ZRT MDA.MB.468 MDA.MB.453 AU565 SKBR3 DU4475 MDA.MB.231 BCAS3 GDPD1 MANSC1 MAP3K13 TCEAL8 FDFT1 GPR137B GOLPH3L PBX1 TCEA3 DBP DHCR24 MKNK2 TMEM87B C14orf1 HSD17B7P2 MST1R SLC1A1 FAM46C KlAA0430 TP53INP1 ORAI3 SPDEF SORL1 CCNG2 PRICKLE2 TRERF1 MAP3K12 MLLT3 MEGF9 ATP7A SSBP2 REPS2 ALDH6A1 FAM63A LMBRD1 RHOT1 BBS2 RDH11 MAML3 OCLN ST6GALNAC2 LlPH KRT19 JUP WDR3 DDX21 NIP7 FOXC1 TAF4B KlAA0020 TOMM40 MRT04 MARS2 SLC25A33 DNTTIP2 YRDC FZD7 SNAPC1 PPAT TEAD4 ADAT2 LTV1 PNPT1 RIOK1 GTPBP4 PN01 SLC7A5 WDR4 TIMM8A BOP1 POP1 DPH2 BYSL PWP2 RRP1 SLC5A6 FOSL1 TINAGL1 EIF5A2 CYP1B1 TOX SERPINB2 DO2264DO3668DO2084DO4671DO1276DO3322DO1808DO1264DO4998DO1532DO4970DO3128DO1773DO3418DO1434DO4341DO1429DO5604DO2925DO2258DO6104DO2521DO1569DO3158DO1618DO2802DO1653DO1331DO4942DO2885DO4497DO4977DO3245DO3862DO3082DO4161DO5877DO4335DO5130DO1688DO1325DO1797DO3715DO5486DO3644DO1574DO3816DO1388DO2949DO3116DO3233DO2989DO3566DO1289DO1755DO2389DO1299DO5333DO1270DO5618DO1972DO6064DO2931DO3412DO5794DO1271DO4467DO3352DO2168DO5102DO5689DO4928DO3140DO5123DO1761DO4437DO5046DO1250DO4036DO5326DO4044DO1258DO4143DO2020DO4713DO4104DO4743DO3662DO4080DO1712DO4389DO4731DO1287DO5291DO1301DO3910DO2713DO1727DO5417DO1678DO4866DO5375DO5361DO5668DO4893DO4062DO5682DO4689DO5060DO3916DO2891DO2783DO1589DO2515DO1885DO1459DO4847DO1564DO6072DO1584DO1368DO1277DO2776DO1384DO2509DO1392DO3482DO4383DO2659DO3013DO4854DO4233DO4347DO3076DO1842DO1255DO2897DO1559DO2813DO1316DO3822DO6160patients. To determine if chemotherapeutics such as paclitaxel
impact IRE1 RNase activity, MDA-MB-231 cells were treated
with therapeutically relevant concentrations of paclitaxel and
IRE1 RNase activity was assessed. Paclitaxel concentrations as low
as 10 nM increased IRE1 RNase activity as demonstrated by an
increase in levels of XBP1s protein (Fig.
5
a). Moreover, addition
of MKC8866 was sufficient to completely block
paclitaxel-induced expression of XBP1s (Fig.
5
b). Since our results
****
***
***
*
**
*
***
*
*
****
***
*
*
***
Vehicle MKC8866 0 0.2 0.4 0.6 0.8 1.0 1.2a
Vehicle MKC8866 1 2 3 4 1 2 3 4 1. CXCL1 2. IL-6 3. IL-8 4. GM-CSF CXCL1 Vehicle MKC8866 0 1 2 3 4 5 6 7 8 9 10 IL-8 Vehicle MKC8866 0 0.5 1.0 1.5 2.0 2.5 3.0 3.5 0 0.1 0.2 0.3 0.4 0.5 0.6 0.7 0.8 TGFβ2 Vehicle MKC8866 ng/ml released Vehicle MKC8866 0 0.05 0.10 0.15 0.20 0.25 Vehicle MKC8866 0 0.1 0.2 0.3 0.4 0.5 0.6 Vehicle MKC8866 0 5 10 15 20 GM-CSFb
ng/ml released IL-6c
MDA-MB-468e
HCC1806 CXCL1 ng/ml released BT549 Vehicle MKC8866 0 0.2 0.4d
0.6 0.8 1.0 1.2 1.4 1.6 1.8 0 0.2 0.4 0.6 0.8 1.0 1.2Relative mRNA abundance IL6 IL8 CXCL1 GM-CSF TGFB2 XBP1s
Vehicle MKC8866
Fig. 4 IRE1 activity induces production of pro-inflammatory factors. a–d MDA-MB-231 cells cultured in medium containing 2% serum were treated with 20 μM MKC8866 or vehicle alone for 48 h after which cells and conditioned medium were collected. a Conditioned medium was applied to a Human XL Cytokine Array. Expression profile of cytokines in vehicle alone versus MKC8866-conditioned medium was determined by chemiluminescence. b, c Cytokine secretion was quantified in conditioned medium using ELISAs selective for IL-6, IL-8, CXCL1, GM-CSF, and TGFβ2 (n = 3). d mRNA transcript levels ofIL6, IL8, CXCL1, GM-CSF, TGFB2, and XBP1s were quantified by Q-PCR (n = 3). e CXCL1 quantification in conditioned medium collected from HCC1806, BT549, and MDA-MB-468 cells treated for 48 h in 2% serum-containing medium supplemented with vehicle alone or 20μM MKC8866 (n = 3). Results shown fora are representative of two independent experiments. *P < 0.05, **P < 0.01, ***P < 0.001 and ****P < 0.0001, based on a Student’s t test. Error bars represent s.e.m.
Fig. 3 IRE1 gene signature associates with basal-like breast cancers. a The putative IRE1 RNase-dependent gene signature was applied to a gene expression data set comprised of 27 breast cancer cell lines. Hierarchical clustering was performed and cell lines ranked based on their predicted IRE1 RNase activity. Expression across each gene (row) was centered and scaled so that mean expression is zero and standard deviation is one. Red indicates those genes with high expression and blue those with low expression relative to the mean.b IRE1 RNase-dependent gene signature was used to stratify 595 breast cancer gene expression data sets in TGCA. Cohorts with high and low IRE1 activity where identified and are represented as a heat map. Red indicates genes with high expression while blue those with low expression relative to the mean.c Pie charts depicting the breast cancer molecular sub-types (based on PAM50 classification) of IRE1 high and IRE1 low cohorts. NA indicates samples where PAM50 classification information was not available. d mRNA expression levels ofIL6, IL8, CXCL1, GM-CSF, and TGFB2 in IRE1 high versus IRE1 low cohorts. Box plots show the median, 25th and 75th percentiles, and whiskers indicate the location of the minimum and maximum values for each of the IRE1 low (n = 79) and IRE1 high (n = 63) groups. e Correlation between immunohistochemistry staining intensity for XBP1s and IL-8 in TNBC human tumor sections (n = 16). f Correlation between immunohistochemistry staining intensity for XBP1s and CXCL1 in human TNBC tumor sections (n = 14). *P < 0.05, **P < 0.01, ***P < 0.001, and ****P < 0.0001, based on comparison of the two groups using a two-tailedt test with Welch’s correction. Error bars represent s.e.m.
indicated that IRE1 RNase activity exerted control over the
secretome and that paclitaxel treatment enhanced IRE1 RNase
activity, we investigated whether paclitaxel treatment could
increase cytokine production in an IRE1 RNase-dependent
manner. We treated MDA-MB-231 cells with vehicle, paclitaxel
or a combination of paclitaxel and MKC8866. Following 72 h
treatment, cells and conditioned medium were harvested and
analyzed for cytokine production. As predicted, we observed a
paclitaxel-induced increase in the secretion of IL-6, IL-8, CXCL1,
and GM-CSF (Fig.
5
c). Co-treatment with MKC8866 reduced
paclitaxel-induced increases in CXCL1, GM-CSF, IL-6, and to a
lesser extent IL-8 secretion (Fig.
5
c).
Studies have shown that chemotherapy, while effective in the
short term, can lead to tumor relapse in the longer term, with
increases in pro-tumorigenic secreted factors considered key
elements in this process
18,19. To assess the longer term impact of
paclitaxel on MDA-MB-231 cells we treated cells with a low dose
(10 nM) of paclitaxel for 72 h, after which paclitaxel was removed,
cells washed and left to recover in fresh medium containing
vehicle alone or MKC8866. After 72 h of recovery, conditioned
medium was collected and cytokine levels were assessed. Addition
of MKC8866 post-paclitaxel treatment significantly reduced
CXCL1 and IL-8 levels compared to vehicle-only controls
(Fig.
6
a). Since chemotherapy-induced increases in
pro-tumorigenic cytokines have been linked to expansion of
tumor-initiating cell populations, we assessed the ability of
paclitaxel-treated cells incubated with either MKC8866 or vehicle alone
during the recovery phase to form mammospheres (a functional
readout of tumor-initiating cell expansion). Following 72 h of
recovery, cells were counted, equal numbers seeded out onto
low-adherence plates, and 5 days later, mammospheres greater than
40
μm were counted and mammosphere-forming efficiency was
calculated. As previously reported
18, treatment with paclitaxel
significantly increased the mammosphere-forming efficiency of
MDA-MB-231 cells (Fig.
6
b). Addition of MKC8866
post-paclitaxel treatment substantially reduced mammosphere
forma-tion when compared to vehicle-only treated controls, suggesting
an important role for IRE1 RNase signaling in this process
(Fig.
6
b). Since we had observed a reduction in the levels of
CXCL1 and IL-8 in conditioned medium post-paclitaxel
treatment (Fig.
6
a), we asked if these cytokines contributed to
paclitaxel-induced mammosphere formation in MDA-MB-231
cells. To answer this, we depleted CXCL1 and IL-8 levels through
addition of neutralizing antibodies during the 72 h recovery phase
post-paclitaxel treatment and assessed the ability of cells to form
mammospheres. Addition of neutralizing antibodies against
either IL-8 or CXCL1 blocked the ability of paclitaxel-treated
MDA-MB-231 cells to form mammospheres (Fig.
6
c,
Supple-mentary Fig. 4g-i). In addition to neutralizing CXCL1 and IL-8,
we carried out a reciprocal experiment where we assessed the
ability of exogenous CXCL1 and IL-8 to overcome
MKC8866-mediated suppression of mammosphere formation. Combination
of MKC8866 with recombinant CXCL1 or IL-8 during the 72 h
recovery phase partially reversed MKC8866-mediated inhibition
of mammosphere formation (Fig.
6
d) further underscoring the
importance of these pro-tumorigenic cytokines.
MKC8866 enhances the effectiveness of paclitaxel in vivo. To
determine the efficacy of MKC8866 treatment in vivo,
MDA-MB-231 tumor xenografts were established in athymic nude mice.
Once tumors had reached a palpable size (225–250 mm
3),
ani-mals were randomized into treatment groups and treated with
vehicle alone, 300 mg kg
−1MKC8866 alone, 10 mg kg
−1pacli-taxel alone or a combination of paclipacli-taxel and MKC8866.
Treatments in all groups were administered until tumors reached
maximal size (2000 mm
3) or on day 60, whichever came
first.
MKC8866 was well tolerated after 60 consecutive oral doses and,
based on pharmacokinetic allometric scaling, systemic exposures
were well above anticipated clinical therapeutic levels. Treatment
with MKC8866 alone did not attenuate tumor growth compared
to vehicle-only controls (Fig.
7
a). Analysis of percentage XBP1
mRNA splicing in those tumors treated with MKC8866
con-firmed a reduction in IRE1 RNase activity verifying on-target
effect (Fig.
7
b). While paclitaxel treatment reduced tumor growth,
combination with MKC8866 markedly enhanced the efficacy of
paclitaxel. Significantly reduced tumor growth (P ≤ 0.0001) was
observed throughout the 60-day experiment in animals receiving
a paclitaxel-MKC8866 combination compared to paclitaxel alone
(Fig.
7
c). A similar synergistic effect was observed following a
***
**
*
a
XBP1s Actin 0 24 48 72 96 Paclitaxel (h)b
Actin 0 10 10 0 10 10 Vehicle MKC8866 Paclitaxel (nM)c
Vehicle MKC8866 GM-CSF pg/ml released per μ g protein IL-6 + Paclitaxel– Paclitaxel – Paclitaxel+ Paclitaxel – Paclitaxel+ Paclitaxel – Paclitaxel+ Paclitaxel CXCL1 IL-8 0 20 40 60 80 100 120 140 160 180 0 20 40 60 80 100 120 140 0 5 10 15 20 25 30 35 40 45 0 1 2 3 4 5 6 7 8 9 10 kDa kDa 58 46 XBP1s 58 46
Fig. 5 Paclitaxel increases IRE1-dependent cytokine secretion. a MDA-MB-231 cells were treated with 10 nM paclitaxel for the indicated times, and cell lysates were immunoblotted for XBP1s and Actin.b MDA-MB-231 cells were treated with 10 nM paclitaxel in the presence of 20μM MKC8866 or vehicle (DMSO) for 72 h, cell lysates were harvested and immunoblotted for XBP1s and Actin.c MDA-MB-231 cells were treated with 10 nM paclitaxel in combination with DMSO or 20μM MKC8866 for 72 h in the presence of Boc-D-fmk (40 μM). Following treatment conditioned medium was collected and analyzed by ELISA for secretion of IL-6, IL-8, CXCL1, and GM-CSF. Cells were lysed and protein quantified (n = 3). Results shown for a and b are representative of three independent experiments. *P < 0.05, **P < 0.01, ***P < 0.001, based on a Student’s t test. Error bars represent s.e.m.
paclitaxel-MKC8866 combination starting on day 14 (or ~700
mm
3tumor volume) (P
≤ 0.001) or on day 28 (or ~1300 mm
3tumor volume) (P
≤ 0.05) when compared to paclitaxel alone
(Fig.
7
c). Examination of XBP1 splicing in tumors revealed
paclitaxel treatment increased IRE1 RNase activity, which was
reduced upon combination with MKC8866 (Fig.
7
d,
Supple-mentary Fig. 5). The decrease in tumor volume observed
fol-lowing a combination of paclitaxel and MKC8866 also translated
to an increase in survival. Mice receiving daily MKC8866
administration in combination with paclitaxel from day 1 to 60,
day 14 to 60, and day 28 to 60 displayed significantly longer
survival compared to those treated with paclitaxel alone (Fig.
7
e).
Since our in vitro studies indicated that IRE1 RNase inhibition
by MKC8866 reduced mammosphere formation post-paclitaxel
treatment, we tested the outcome of maintaining IRE1 inhibition
following paclitaxel withdrawal in vivo. Following MDA-MB-231
tumor formation, mice were treated with paclitaxel alone (7.5 mg
kg
−1) for days 1–10, or a combination of paclitaxel (days 1–10)
and MKC8866 (300 mg kg
−1, days 1–28). After withdrawal of
paclitaxel treatment on day 10, an initial reduction in tumor
volume was apparent in both treatment groups (Fig.
8
). Tumor
regrowth, evident after day 18 in those animals receiving no
further treatment, was repressed in the treatment group still
receiving MKC8866. Tumor regrowth was only apparent in this
group following cessation of MKC8866 on day 28 (Fig.
8
).
After 28 days of dosing the mice, the maximum systemic
concentration of MKC8866 was ~110
μg ml
−1as measured by
LC/MS/MS with no signs of overt toxicity or significant changes
in body weight. Tumor volume measurements revealed 8 out of
10 animals displayed partial tumor regression and 1 animal
showed complete tumor regression in the paclitaxel-MKC8866
combination group (Supplementary Table 2). This compared
favorably to paclitaxel alone, which had just three partial
regressions, one complete regression, and one tumor-free survival
observed (Supplementary Table 2). Additional studies are
required to fully evaluate tumor growth after treatment is
discontinued.
Discussion
The current dogma regarding IRE1 signaling in cancer is very
much aligned with its role as a mediator of the UPR facilitating
cell survival under stress conditions. While this is undoubtedly
an important function of IRE1 signaling especially early in
tumorigenesis
21,
numerous
other
reports
have
linked
IRE1 signaling to facets of tumor biology more aligned with
tumor progression, including angiogenesis and metastasis
10,22.
In our system, we identified IRE1 RNase signaling as an
important modulator of the secretome in TNBC cells. Through
a combination of transcriptomics, Q-PCR, cytokine arrays, and
ELISAs we identified IL-6, IL-8, CXCL1, GM-CSF, and TGFβ2
****
*
*
***
*
*
*
****
**
*
*
**
b
a
c
0 0.2 0.4 0.6 0.8 1.0 IL-6 1.2 1.4 1.6 IL-8 TGFβ2 CXCL1 GM-CSFCytokine release (relative to vehicle)
Vehicle MKC8866 0 0.2 0.4 0.6 0.8 1.0 1.2 Mammosphere formation (relative to vehicle) MKC8866 Anti-IL-8 Anti-CXCL1
d
Vehicle Paclitaxel> Vehicle Paclitaxel> MKC8866 Treatment>Recovery 0 0.5 1.0 1.5 2.0 2.5 3.0 3.5(%) Mammosphere forming efficiency
(%) Mammosphere forming efficiency
Untreated Vehicle MKC8866+ rIL-8 MKC8866 + rCXCL1 MKC8866 0 0.5 1.0 1.5 2.0 2.5 3.0 3.5 Vehicle
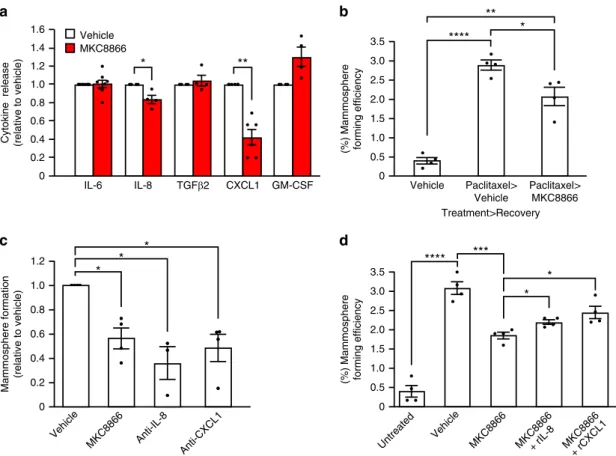
Fig. 6 Paclitaxel alteration of secretome enhances mammosphere formation. a–d MDA-MB-231 cells were treated with paclitaxel (10 nM) for 72 h, after which paclitaxel-containing medium was removed and cells were washed.a, b Cells were incubated for a further 72 h in fresh medium containing vehicle alone or MKC8866 (20μM). a Conditioned medium was collected and levels of IL-6 (n = 7), IL-8 (n = 4), TGFβ2 (n = 4), CXCL1 (n = 6), and GM-CSF (n = 4) were quantified by ELISA. Cytokine release was normalized to that of vehicle-only treated controls. b After treatment, cells were seeded at equal densities onto low-adherence plates and mammospheres quantified after a further 5 days (n = 4). c, d Fresh medium containing vehicle alone, MKC8866 (20μM), c neutralizing antibodies against CXCL1 (10 μg ml−1) or IL-8 (500 ng ml−1) (n = 4), d MKC8866 (20 μM) plus recombinant CXCL1 (rCXCL1, 500 pg ml−1) or recombinant IL-8 (rIL-8, 3 ng ml−1) was added and cells incubated for an additional 72 h. Cells were seeded at equal densities onto low-adherence plates and mammospheres quantified after a further 5 days (n = 4). *P < 0.05, **P < 0.01 and ***P < 0.001, based on a Student’s t test. Error bars represent s.e.m.
*
* Paclitaxel + MKC8866 Day 28–60 Paclitaxel + MKC8866 Day 14–60 Paclitaxel + MKC8866 Day 14–60 0 0.2 0.4 0.6 0.8 1.0 1.2 1.4 1.6 1.8 2.0 0 5 10 15 20 25 30 35 40 45 50 55 60a
c
0 0.5 1.0 1.5 2.0 2.5 0 5 10 15 20 25 30 Tumor volume (×10 3) (mm 3) Tumor volume (×10 3) (mm 3) Vehicle MKC8866 Vehicle Paclitaxel Paclitaxel + MKC8866 Day 1–60 Time (days) Time (days) XBP1 splicing (%) MKC8866 0 10 20 30 40 50 60 70 Vehicleb
e
0 20 40 60 0 20 40 60 80 100 Time (days) (%) Survival Vehicle Paclitaxel Paclitaxel + MKC8866 Day 1–60Vehicle Paclitaxel Paclitaxel MKC8866 XBP1 splicing (%) 0 10 20 30 40 50 60 70 80 90 100
d
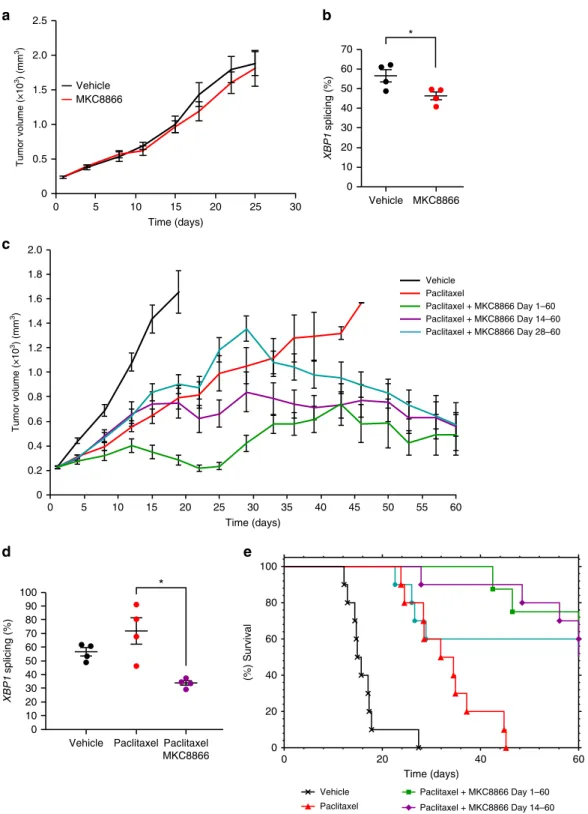
Paclitaxel + MKC8866 Day 28–60Fig. 7 MKC8866 enhances the effectiveness of paclitaxel in vivo. Xenografts were established by subcutaneously injecting 5 × 10⁶MDA-MB-231 cells into
the rightflank of female athymic nude mice (Crl:NU(Ncr)-Foxn1nu, Charles River). When tumors were palpable (250 mm3) mice were randomized into
groups and treatments initiated.a Vehicle-only versus MKC8866 (300 mg kg−1) daily via oral gavage. Tumor size was assessed every 2–3 days via caliper measurement and tumor volume calculated. By day 25, all tumors had reached their maximum permitted size (n = 10 mice per group). b Percentage XBP1 mRNA splicing was determined in vehicle-only versus MKC8866-treated xenografts (n = 4 per treatment group). c Paclitaxel was administered weekly at 10 mg kg−1by intravenous injection, alone and in combination with MKC8866 administered daily at 300 mg kg−1by oral gavage from day 1 to 60, from day 14 to 60, and from day 28 to 60. Tumor size was assessed every 2–3 days via caliper measurement and tumor volume calculated (n = 10 mice per group).d PercentageXBP1 mRNA splicing was determined in vehicle-only, MKC8866-treated and paclitaxel plus MKC8866-treated xenografts (n = 4 per treatment group).e Kaplan–Meier plot showing survival in animals administered with MKC8866 in combination with paclitaxel (for indicated times) compared to paclitaxel alone or vehicle alone. *P < 0.05, based on a Student’s t test. Error bars represent s.e.m.
as factors regulated in an IRE1-dependent manner in
MDA-MB-231 cells. Previous reports have linked IRE1-dependent
signaling, via direct XBP1s transcriptional upregulation, to both
IL-6 and IL-8 production in innate immune cells and most
recently in melanocytes
23–25but a role for IRE1 RNase activity
in promoting CXCL1, GM-CSF, or TGFβ2 expression has not
been previously reported. Cells transfected with XBP1 siRNA
displayed
decreased
transcript
levels
of
all
cytokines
tested suggesting a direct IRE1–XBP1s signaling mechanism.
However, given that XBP1 knockdown also reduced IRE1
transcript levels, further studies are required to determine the
exact mechanism. Examination of
nuclear-factor-kappa-light-chain-enhancer of activated B cells (NF-κB), signal transducer
and activator of transcription 3 (STAT3), and
hypoxia-inducible-factor-1α (HIF1α) in MDA-MB-231 cells following
MKC8866 treatment did not detect any change in the activation
of these transcription factors in MDA-MB-231 cells
(Supple-mentary Fig.
6).
Irrespective
of the
precise signaling
pathway our work clearly demonstrates a link between IRE1
RNase activity and the production of soluble factors by TNBC
cells.
IL-6, IL-8, CXCL1, GM-CSF, and TGFβ2 are recognized
pro-tumorigenic factors associated with cancer progression
18,26–28.
Elevated serum and tissue levels of IL-6 and IL-8 are markers of
poor clinical outcome in breast cancer
29–32and, along with
CXCL1, both IL-6 and IL-8 have been implicated in TNBC tumor
progression in vivo
26,28. The tumor secretome has been linked to
the recruitment of diverse cell types establishing a
pro-tumorigenic microenvironment. CXCL1 and GM-CSF have
been reported to recruit myeloid-derived suppressor cells
(MDSCs), a cell type connected to tumor angiogenesis and T cell
immunosuppression
28,33while IL-8 and IL-6 have been linked to
the recruitment of mesenchymal stem cells and neutrophils
amongst others. This suggests that inhibiting IRE1 RNase activity
could be an effective way of limiting the impact of the tumor cell
secretome on both the tumor itself and the wider tumor
micro-environment. Indeed, recent work in glioblastoma multiform
supports this viewpoint. Lhomond and colleagues linked
enhanced IRE1–XBP1s signaling to the promotion of
angiogen-esis, invasion, and macrophage recruitment
34.
While undoubtedly important in cancer progression, the
impact of the tumor secretome is particularly pertinent post
therapy. Currently, neo-adjuvant chemotherapy is the only
treatment option available to TNBC patients. Although successful
in the short term, a large number of patients relapse within 1–3
years
35with cancer stem cell expansion, a key determinant in
tumor relapse
36,37. This subset of tumor cells, which are highly
resistant to chemotherapy and radiation, drive tumor
re-establishment resulting in drug resistant, rapidly proliferating
and highly metastatic tumors refractory to treatment.
Therapy-induced changes in the tumor secretome have been identified as a
driver of cancer stem cell expansion. In breast cancer specifically,
cancer stem cell expansion post therapy has been reported
37,38and shown to be dependent on the production of several
pro-tumorigenic factors including IL-6, IL-8, and TGFβ
18,19,39. As
such, developing therapies to reduce cancer stem cell expansion is
key to limiting tumor re-emergence post therapy. Several studies
have already illustrated the potential of targeting pro-tumorigenic
factors post therapy in breast cancer. Inhibitors of C–X–C motif
chemokine receptor 1 (CXCR1), the IL-8 receptor, and
antag-onistic TGFβ antibodies have been demonstrated to reduce
can-cer stem cell expansion and limit tumor relapse post therapy
18,39.
Similar to published
findings, we observed increased cytokine
production post-paclitaxel treatment in MDA-MB-231 cells. Our
study takes this further, demonstrating a link between increased
pro-tumorigenic cytokine production and a therapy-induced
increase in IRE1 RNase activity. Combining MKC8866 with
paclitaxel inhibited splicing of XBP1 and reduced production of
pro-tumorigenic cytokines in vitro. Mammosphere formation, a
widely used functional readout for tumor-initiating cells, was
significantly increased in MDA-MB-231 cells following paclitaxel
treatment. Addition of MKC8866, post-paclitaxel treatment,
reduced mammosphere formation indicating a requirement for
IRE1 RNase activity. Analysis of conditioned medium revealed
MKC8866 addition reduced the levels of both CXCL1 and IL-8.
Moreover, addition of neutralizing antibodies against IL-8 or
CXCL1 post paclitaxel also reduced mammosphere formation.
These data suggest reduced mammosphere formation in
MKC8866-paclitaxel-treated cells is a likely consequence of
decreased cytokine production. Similar to our
findings, Chen and
colleagues, using an inducible shRNA-mediated knockdown of
XBP1, recently linked XBP1 expression to cancer stem cell
expansion and tumor relapse post therapy, although a role for the
secretome in this process was not extensively explored
10. While
genetic knockdown is a powerful experimental tool, it is not a
viable therapeutic strategy easily translatable to patients unlike a
small molecule inhibitor. In vivo, we found daily MKC8866
administration to be well tolerated in mice with no toxicity
evi-dent after 60 consecutive daily oral doses at 300 mg kg
−1.
Although not effective as a single agent in the TNBC xenograft
model, MKC8866 significantly enhanced paclitaxel-mediated
repression of tumor growth. Additionally, maintenance of IRE1
RNase inhibition post-paclitaxel withdrawal sustained
suppres-sion of tumor regrowth, confirming in vivo, that blocking IRE1
RNase may increase the efficacy of chemotherapeutic agents such
as paclitaxel.
Our study supports IRE1 as a therapeutic target in TNBC and
illustrates the therapeutic potential of small molecule IRE1 RNase
inhibitors in TNBC treatment. Recently published
findings by
Zhao and colleagues further support this view, demonstrating
pharmacological
inhibition
of
the
IRE1–XBP1 pathway
*
**
*
**
**
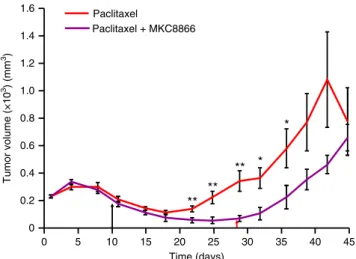
Tumor volume (×10 3) (mm 3) 0 0.2 0.4 0.6 0.8 1.0 1.2 1.4 1.6 0 5 10 15 20 25 30 35 40 45 Time (days) Paclitaxel Paclitaxel + MKC8866Fig. 8 MKC8866 reduces tumor regrowth post-paclitaxel withdrawal. Xenografts were established by subcutaneously injecting 5 × 10⁶
MDA-MB-231 cells into the rightflank of female athymic nude mice (Crl:NU(Ncr)-Foxn1nu, Charles River). When tumors were palpable (250 mm3) mice were
randomized into groups and treatments initiated. Paclitaxel (7.5 mg kg−1by intravenous injection) was administered every second day until day 10 (last dose indicated by the black arrow) as a single agent or in combination with MKC8866 (300 mg kg−1by oral gavage). MKC8866 treatment was administered daily from day 1 to 28 (last dose indicated by the red arrow). Tumor size was assessed every 2–3 days via caliper measurement and tumor volume calculated (n = 10 mice per group). *P < 0.05, **P < 0.01 based on a Student’s t test. Error bars represent s.e.m.
suppresses MYC-driven breast cancers
40. To extrapolate our
in vitro
findings to primary patient-derived samples, we
gener-ated a putative IRE1 gene signature reflective of IRE1 RNase
activity. When applied to TCGA breast cancer gene expression
data sets, this gene signature identified two distinct cohorts
reflective of IRE1 RNase high and IRE1 RNase low activities.
Examination of these groupings revealed that breast cancers
characterized by a high IRE1 gene signature associated with
basal-like breast cancers and exhibited increased expression of
pro-inflammatory factors when compared to those with low IRE1
gene signature. These data, in conjunction with our in vitro cell
line
findings, strongly support the hypothesis that an elevated
IRE1 RNase activity is associated with basal-like/TNBC. The
development of genetic signatures such as this could enable the
identification of breast cancer patients most likely to benefit from
treatment with IRE1 RNase inhibitors and act as a companion
diagnostic. In conclusion, our work demonstrates a role for
IRE1 signaling as an important regulator of the TNBC cell
secretome and provides compelling evidence to support the use of
IRE1 RNase inhibitors in combination with chemotherapeutics
for the treatment of TNBC.
Methods
Cell culture and treatments. MCF10A (ATCC) cells were maintained in DMEM/ F-12 (Gibco, 11320-074) supplemented with 5% horse serum (Sigma-Aldrich, H1270), 20 ng ml−1epidermal growth factor (PeproTech, AF-100-15), 0.5μg ml−1 Hydrocortisone (Sigma-Aldrich, H0888), 100 ng ml−1Cholera toxin (Sigma-Aldrich, C8052), 10μg ml−1insulin (Sigma-Aldrich, I1882), 50 U ml−1penicillin,
and 50μg ml−1streptomycin (Sigma-Aldrich, P0781). MCF7 cells (ECACC) were cultured in DMEM high glucose (Sigma-Aldrich, D6429), SKBR3 (ECACC) cells in McCoys5A (Sigma-Aldrich, M9309), HCC1806 cells (ATCC), and BT549 (ATCC) in RPMI-1640 medium (Sigma-Aldrich, R0883) supplemented with 10% fetal bovine serum (FBS) (Sigma-Aldrich, F7524), 50 U ml−1penicillin, 50μg ml−1 streptomycin (Sigma-Aldrich, P0781), and 2 mML-glutamine (Sigma-Aldrich, G7513). MDA-MB-231 cells obtained from ATCC and ECACC were used in this study. MDA-MB-231 cells were cultured in DMEM high glucose (Sigma-Aldrich, D6429) supplemented with 10% FBS, 50 U ml−1penicillin, 50μg ml−1 strepto-mycin, and 2 mML-glutamine. The data from both cell clones were similar. Cells
from ATCC were tested and were mycoplasma negative. HEK293T cells were from ATCC and were cultured in DMEM high glucose supplemented with 10% FBS, 2 mML-glutamine, 50 U ml−1penicillin, and 50μg ml−1streptomycin. All cells were cultured at 37 °C, 5% CO2in a humidified incubator and seeded at an appropriate
number 24 h prior to treatment. Cells were treated with the indicated concentra-tions of MKC8866 (Fosun Orinove PharmaTech Inc.), Tunicamycin (Tm) Aldrich, T7765), Thapsigargin (Tg) Aldrich, T9033), Paclitaxel (Sigma-Aldrich, T7402), Boc-D-fmk (Biovision, 1160-5), Etoposide (Sigma-(Sigma-Aldrich, E1383), or an equal volume of DMSO (Sigma-Aldrich, D2650). Neutralizing antibodies against IL-6 (R&D Systems, MAB206), IL-8 (R&D Systems, MAB208), CXCL1 (R&D Systems, MAB275), and GM-CSF (R&D Systems, MAB215) were used at 0.5μg ml−1, while TGFβ2 neutralizing antibody (R&D Systems, AF302) was used at 1.12μg ml−1.
Western blotting. Cells were washed once in ice-cold phosphate-buffered saline (PBS) and lysed in whole cell lysis buffer (2% sodium dodecyl sulfate (SDS), 50 mM Tris HCl pH 6.8, 5% glycerol, 0.05% bromphenol blue, 357 mM β-mercaptoetha-nol) or radioimmunoprecipitation assay (RIPA) buffer (0.1% SDS, 1% NP-40, 0.5% sodium deoxycholate, 50 mM Tris-HCl pH 8.8, 150 mM NaCl) after indicated treatments and cell lysate boiled at 95 °C for 5 min. Protein samples were separated on an SDS polyacrylamide gel, transferred onto nitrocellulose membrane (Amer-sham Protran 0.2 10600001) and blocked with 5% milk in PBS-0.1% Tween. For detection of protein expression the following antibodies were used: Actin (Sigma-Aldrich, A-5060, 1:5000), XBP1 (Abcam, 37152, 1:1000), XBP1s (Biolegend, 647502, 1:1000), PERK (CST, 3192, 1:1000), CHOP (CST, 2895, 1:1000), ATF6 (CosmoBio, AM-73-500-B, 1:1000), phospho-p65 (CST 3033, 1:1000), total-p65 (CST 8242, 1:5000), phospho-STAT3 (SantaCruz, 8059, 1:1000), total-STAT3 (Santa Cruz, 482, 1:1000),β-catenin (CST 8480, 1:1000), FOXO1 (CST 2880, 1:1000), and HIF1α (Novus Biologicals, NB100-479, 1:1000). Anti-rabbit (111-035-003) and anti-mouse (115-035-(111-035-003) HRP-conjugated secondary antibodies were purchased from Jackson Immunoresearch and the signal was visualized using western blotting luminol reagent (SantaCruz, sc-2048). Uncropped western blot images are shown in Supplementary Fig. 7.
EdU incorporation assay. S phase cells were determined using EdU (Berry & Associates PY7563) according to manufacturer’s instructions. Post-treatment cells were trypsinised, washed with PBS, andfixed in 70% ice-cold ethanol for 1 h before
storing at−20 °C. After thawing cells were washed in PBS, resuspended in 1 ml of Click cocktail (10 mM sodium ascorbate, 100μM 5′ fluorescein isothiocyanate azide and 2 mM copper II sulfate) and incubated in the dark at room temperature for 30 min. The signal was quenched by adding 10 ml PBS, 0.5% Tween-20, and 1% bovine serum albumin (BSA) for 10 min at room temperature. Samples were then washed with PBS and analyzed on the FL1 channel of a FACSCaliburflow cyt-ometer (Becton Dickinson).
Propidium iodide assessment of cell death. Membrane permeability was assessed using propidium iodide (PI) staining. Briefly, cells were harvested by trypsinization and incubated 15 min at 37 °C to restore membrane integrity. Cells were collected by centrifugation, resuspended in PBS, stained with 0.6μg ml−1of PI (Sigma-Aldrich 81845), and analyzed using a FACSCaliburflow cytometer (Becton Dickinson).
Generation of conditioned medium. MDA-MB-231 cells were cultured in 2% serum-containing medium in the presence of 20 µM MKC8866 or an equal volume of vehicle (DMSO). After 48 h, the supernatant was removed,filtered, and the resultant conditioned medium was used for further experiments. In the case of neutralizing antibody experiments, a portion of the conditioned medium post neutralization was analyzed by ELISA to confirm successful neutralization. Human XL Cytokine Array. We used a Human XL Cytokine Array kit (R&D systems, ARY022) as per manufacturers’ instructions. In brief, membranes were blocked with Buffer 6 for 1 h at room temperature and incubated with conditioned medium overnight at 4 °C with gentle agitation. The following day, membranes were washed three times for 10 min with wash buffer. Detection antibody cocktail was added to each membrane for 1 h at room temperature followed by washing. Streptavidin-HRP (2 ml) was added to each membrane and incubated for 30 min at room temperature. Membrane washes were repeated and signals were visualized by addition of Chemi Reagent Mix (2 ml).
ELISA. IL-6 (DY206), IL-8 (DY208), CXCL1 (DY275), GM-CSF (DY215), and TGFβ2 (DY302) DUOSET ELISA’s were purchased from R&D Systems and carried out as per manufacturer’s instructions.
RNA extraction, PCR, and Q-PCR. Total RNA was isolated using TRI Reagent (Sigma-Aldrich, T9424) according to the manufacturer’s instructions. In total, 500–2000 ng of RNA was reverse transcribed using Superscript II (Invitrogen 18064014). For standard PCR, products were visualized using 1% agarose gels. Q-PCR reactions were performed using Takyon ROX Master Mix (Eurogentec UFRP5XC0501) and the StepOne Plus platform (Applied Biosystems). Target transcript levels were normalized to GAPDH, and relative abundance was deter-mined using theΔΔCt method. Transcript-specific TaqMan assays were purchased from Integrated DNA Technologies. For tumor xenografts, XBP1u and XBP1s transcript levels were normalized to the average Ct of control gene, ACTB using the ΔΔCt method. MDA-MB-231 cDNA was used as the control sample for ΔΔCt calculations. Percentage XBP1 mRNA splicing was determined by calculated as XBP1s/(XBP1s+ XBP1u) × 100. Sequences of primers and probes used are detailed in Supplementary Table 3.
Q-PCR to determine relativeXBP1 splicing in patient samples. The Galway University Hospitals Clinical Research Ethics Committee approved the use of human tissue samples following informed patient consent. Patients provided written informed consent for use of samples, and work was performed according to the principles of the Declaration of Helsinki. Breast tissue samples (basal (n= 5), luminal (n= 4), TAN (n = 4)) were harvested in theater at University Hospital Galway. Samples were preserved by immediate immersion in RNAlater® (Sigma-Aldrich R0901) and subsequently stored at−80 °C until required for RNA extraction. RNA quality was determined by resolving at least 250 ng of total RNA on a 1% sodium borate agarose gel, and samples displaying degradation were excluded from the study. An aliquot of 500 ng of total RNA was reverse transcribed as described above. Total XBP1 and XBP1s transcript levels were normalized to the average Ct of control genes, PPIA and MRPL19 using theΔΔCt method. A pool of cDNA was used as an inter-plate/run control and as the control sample forΔΔCt calculations. Results are displayed as: relative XBP1s abundance/relative XBP1 total abundance.
Transient knockdown and overexpression. For knockdown, MDA-MB-231 cells were transfected with 25 nM of Dharmacon On-Target SMARTpool Plus siRNA targeting XBP1 (L-009552-00), IRE1 (L-004951-02), or non-targeting control (NC) siRNA (D-001810-01-20) using Dharmafect 4 (Dharmacon T-2004-02) according to the manufacturer’s instructions.
Stable shRNA knockdown. pLKO control vector (SHC001) and human XBP1 (SHCLND-NM_005080) lentiviral shRNA constructs were purchased from Sigma-Aldrich. Lentivirus was generated by co-transfecting the above plasmids with